Optimum dietary protein levels and protein to
Bạn đang xem bản rút gọn của tài liệu. Xem và tải ngay bản đầy đủ của tài liệu tại đây (153.49 KB, 7 trang )
International Journal of Fisheries and Aquaculture Vol. 2(2), pp. 058-063, March 2010
Available online at />© 2010 Academic Journals
Full Length Research Paper
Optimum dietary protein levels and protein to energy
ratios on growth and survival of juveniles spotted
Babylon (Babylonia areolata Link) under the
recirculating seawater conditions
N. Chaitanawisuti1*, C. Rodruang2 and S. piyatiratitivorakul2
1
Aquatic Resources Research Institute, Chulalongkorn University, Phya Thai Road, Bangkok, Thailand 10330.
2
Department of Marine Science, Faculty of Science, Chulalongkorn University, Phya Thai Road,
Bangkok, Thailand 10330.
Accepted 5 January, 2009
A feeding experiment of three dietary protein levels (35, 40 and 45%) and three dietary energy levels (3.8,
-1
4.0 and 4.2 kcal g diet) factorial design with four replicates was conducted to determine the proper
dietary protein and energy levels for the growth and survival of the juveniles spotted Babylon Babylonia
areolata under the recirculating seawater conditions. Snails with initial body weight averaging 0.29 ±
0.01 g were fed the experimental diets for 16 weeks. Survival rates (SR) of each group was above 95%
and no significant difference among dietary treatments (p > 0.05). Mean weight gain of snails fed the
35% protein diets with 4.0 kcal/g diet was significantly (P < 0.05) different from that of snails fed the 40
and 45% protein diets at all energy levels. Feed conversion ratio (FCR) was significantly influenced by
-1
dietary protein and energy levels (p < 0.05). Diets containing 35% protein level and 4.0 kcal g energy
level appeared to be utilized more efficiently in term of FCR (3.21) than diets containing the other dietary
protein and energy levels, ranging 3.62 - 4.54. The results of this study indicate that a diet containing
-1
35% dietary protein and 4.0 kcal g diets with P/E ratio of 85.99 mg protein/kcal was recommended for
juvenile B. areolata growth under our experimental recirculating seawater conditions.
Key words: B. areolata, dietary protein, protein / energy ratio, growth, survival.
INTRODUCTION
The spotted Babylon, Babylonia areolata, is generally
carnivores and feed mostly on fresh meat of trash fish.
However, feeding fish meat to spotted Babylon entails
problems such as variability in nutritive content and
supply, thus resulting a slow and heterogenous growth
rate of the species. Typical growth rates of spotted
-1
Babylon are approximately 1.19 g mo and therefore, 6 7 months are required to produce a marketable size. Due
to problems associated with the use of trash fish as feed
for spotted babylon, intensive spotted Babylon culture is
*Corresponding author. E-mail:
becoming increasingly reliant upon formulated practical
diets (Chaitanawisuti Kritsanapuntu and Natsukari, 2002).
The use of prepared feeds can be very practical since
formulation can be manipulated to obtain an optimum
nutritional value. Further, they are available on demand
and if properly prepared may be stored for a long time.
The use of formulated feeds in spotted Babylon farming
will therefore make a significant contribution to spotted
Babylon production in Thailand. Zhou et al. (2007) found
that the optimal dietary protein requirement for maximum
growth rate and feed of Babylonia areolata increased with
an increase in protein content from 27 - 45%. The
success of intensive fish culture depends to a large
extent on adequate information on nutrient requirements,
Chaitanawisuti et al.
059
Table 1. Percentage (dry weight basis) and proximate analysis (%) of the formulated diets and natural food.
Fishmeal
Soybean meal
Shrimp meal
Wheat flour
Wheat gluten
Tuna oil
a
Vitamin premix
b
Mineral premix
Cellulose
3.8
45.12
9.48
2.4
3.0
4.77
6.54
4.0
4.0
20.69
4.0
45.12
9.48
2.4
3.0
4.77
11.54
4.0
4.0
15.69
4.3
45.12
9.48
2.4
3.0
4.77
14.54
4.0
4.0
12.69
Protein levels (%)
40
-1
Gross energy level (kcal g )
3.8
4.0
4.3
50.76
50.76
50.76
8.06
8.06
8.06
2.4
2.4
2.4
3.0
3.0
3.0
4.77
4.77
4.77
6.17
11.17
14.17
4.0
4.0
4.0
4.0
4.0
4.0
16.84
11.84
8.84
Proximate composition
Crude protein (%)
Crude lipid (%)
Ash (%)
Energy (kcal /g diet)
P/E ratio (mg/kcal)
35.56
9.67
20.86
3.89
89.97
35.21
14.99
20.70
4.07
85.99
35.24
18.25
20.78
4.27
81.96
40.11
10.11
20.56
3.83
104.43
35
Ingredients (%)
40.63
14.52
20.67
4.05
98.76
40.87
18.02
20.84
4.19
95.46
45
3.8
50.76
11.85
2.4
3.0
4.77
6.1
4.0
4.0
13.12
4.0
50.76
11.85
2.4
3.0
4.77
11.1
4.0
4.0
8.12
4.3
50.76
11.85
2.4
3.0
4.77
14.1
4.0
4.0
5.12
45.32
10.04
20.44
3.72
120.96
45.25
15.09
20.73
3.93
114.50
45.67
18.02
20.55
4.16
108.17
a
Vitamin premix (mg kg-1 or IU): vitamin A, 10000000 IU; vitamin D3, 1000000 IU; vitamin E, 10000 mg kg-1; vitamin K3, 1000 mg kg-1; vitamin B1, 500 mg kg-1;
vitamin B2, 5000 mg kg-1; vitamin B6, 1500 mg kg -1; vitamin C, 10000 mg kg-1; folate, 1000 mg kg-1; dealmethionine, 16038 mg kg-1.
b
Mineral premix (mg kg-1): Ca, 147 g kg-1; P, 147 g kg-1; Fe, 2010 mg kg-1; Cu, 3621 mg kg-1; Zn, 6424 mg kg-1; Mn, 10062 mg kg-1; Co, 105 mg kg-1; I, 1000 mg kg-1;
Se, 60 mg kg-1.
especially dietary protein, which is the most essential but
expensive component in artificial diets. A dietary excess
or deficiency of energy can reduce growth rate of farmed
fish because energy is needed for metabolic activities
(Sweilum Abdella and Eldin, 2005). The use of protein as
a dietary energy source for aquatic animals is
undesirable because of the high cost of dietary protein as
compared with the cost of non-protein energy sources.
Increasing protein level in diets can lead to improve
production, especially for carnivorous species. However,
excessive dietary protein level is not economical for fish
and shellfish culture because it is responsible for a large
part of the feed cost (Lee and Kim, 2001). However,
protein and energy levels are known to influence the
growth and body composition of various fish and
shellfish. With respect to dietary energy levels, Shiau and
Huang (1990) found that FCR and protein efficiency ratio
of hybrid tilapia Oreochromis aureus were improved at
-1
dietary energy levels higher than 12.97 kj 100 g diet
when the fish fed a diet containing 25% protein. Similarly,
El-Sayed and Teshima (1992) reported that at 30%
dietary protein, fish growth and feed utilization were
significantly improved by increasing the dietary energy
-1
level from 12.56 - 20.93 kj 100 g diet. In addition, a
proper balance of crude protein and digestible energy
can improve growth rate, feed efficiency and protein
utilization; minimizes excessive accumulation of lipids
and glycogen in the somatic tissues and liver; and
minimizes undesirable nitrogenous waste output thereby
improving the quality of farm effluents (Bicuda Sado and
Cyrino, 2009). It is important to know the response of
spotted Babylon to various nutrients in order to be able to
produce an effective low-cost feeds for the species.
Hence, this study was designed to determine the effects
of different levels of dietary protein and energy in
formulated diets on growth of juveniles spotted Babylon
B. areolata, reared under the recirculating system.
MATERIALS AND METHODS
Experimental diets
A 3 × 3 factorial experiment in a completely randomized design
using three replicates was used. Nine experimental diets were
formulated to contain with three levels of protein (35, 40 and 45%)
and three levels of energy (3.8, 4.0 and 4.2 kcal g-1). The feed
formulation and biochemical composition of the experimental diets
are summarized in Table 1. The major dietary protein sources used
were fish meal, shrimp meal and soybean meal and dietary protein
level increased in a proportion to its percentage. Wheat flour was
used as carbohydrate source and tuna oil was used as the lipid
source. Mineral and vitamin mixes were added to the diets. Wheat
gluten was used as binders. The diets were prepared by weighing
the dry ingredients and mixing thoroughly in a mixer. The lipid
sources were added drop by drop while the mixture was further
blended to ensure homogeneity. Approximately 200 ml hot water
060
Int. J. Fish. Aquac.
was then added for each kg of this mixture. The diets were
extruded and dried at room temperature for 48 h. Upon feeding, the
feeds were made into small pieces (round shape of 1.5 cm
diameter) to facilitate sucking by the snails. All experiment diets
were then stored in a refrigerator at 4°C until use. All diets were
analyzed in duplicate for the proximate compositions according to
standard methods (AOAC, 1990).
Pond preparation and culture management
This study was assigned to use the recirculating culture system. A
series of rectangular plastic tanks (1.0 × 3.0 × 1.0 m) were used as
the rearing ponds and the animals were kept in rearing unit (plastic
baskets) of 25.0 × 35.0 × 25.0 cm which contained numerous pores
of 1.5 cm2 (4 holes cm-2) at each side. Bottom of each rearing unit
was covered with coarse sand of 2 cm thickness as substratum.
Aeration was provided with an air diffuser. This study consisted of 9
feeding treatments, and each treatment included three replicates.
Twenty-seven baskets were assigned to the tanks using a completely randomized design. A plastic tank (3.0 × 2.0 × 1.0 m) was
used as the biological filter tanks containing bioballs as biofilter.
Seawater from the rearing pond was flowed into the biological filter
tank and seawater was pumped back into the rearing pond continuously at a constant rate of 200 L/h. Rearing units were scrubbed
and new seawater in rearing pond was replaced every 30 days after
measurement of length and weight to minimize accumulation of
metabolites in the culture system. During the experimental period,
water quality was maintained periodically during the feeding trials.
Water temperature and salinity were 29.0 - 31.0°C and 29.0 - 30.0
ppt, respectively. Salinity was monitored daily, as necessary, to
keep the variation within ±2.0 ppt by addition of fresh water to correct for any increased salinity due to water evaporation. Dissolved
oxygen was not less than 5 mg/l, and there were negligible levels of
free ammonia and nitrite. Natural light cycle was used in the feeding
trials.
Experimental animals and feeding experiments
Juvenile B. areolata used in the feeding trials were transported from
a commercial private hatchery in Petchaburi, Thailand, transported
to the laboratory and kept in three 300 L circular plastic tanks for
acclimatization. During the acclimatization period, the snails were
fed chopped trash fish mixed with the basal diet. The amount of
trash fish was gradually replaced by the diet until the snails can
accept diet totally. The acclimatization period lasted over 5 days. At
the beginning of the experiment, healthy juveniles were sorted a
uniform size to prevent possible growth retardation of small spotted
Babylon when cultured with larger ones. Mean initial shell length
and whole body weight of juveniles were 1.15 ± 0.01 cm and 0.29 ±
0.01 g (mean ± S.D, n = 30), respectively and did not differ
significantly (p > 0.05) among treatments (Table 2). Juveniles were
distributed randomly into 27 rearing tanks of 25.0 x 35.0 x 25.0 cm
(3 tanks /diet) at a density of 50 snails per tank. At the beginning of
the feeding trial, juveniles were hand-fed to once daily (10:00 h) to
apparent visual satiation with the experimental diets. All groups
were fed their respect diets at the same fixed rate of initially 5% of
body weight per day. The amount of feed was adjusted daily based
on the amount of food consumed by snails within 0.5 h on the
previous day to ensure that only a minimal amount of feed left.
Apparent satiation was determined from observation of the point at
which snails ceased active feeding, moving away from the feeding
area and buried under sand substratum. Uneaten food was
siphoned out immediately after the snails stopped eating to prevent
contamination of water and sand substratum. The amount of feed
eaten was recorded daily for calculation of feed conversion ratio.
No any chemical and antibiotic agent was used throughout the
entire experimental periods. Grading by size was not carried out in
any pond throughout the growing - out period. Mortalities were
recorded daily. Each feeding trial was terminated at 16-week.
Sample collection and analysis
The wet weight of all snails from each tank was measured
individually at the beginning of the experiment and every 2 weeks in
feeding trials for growth estimation. Growth performance and feed
utilization was calculated as following: specific growth rate (SGR),
absolute growth rate (AGR), feed efficiency (FE) and survival. The
calculation formulae are as following: percent weight gain (PWG,
%) = [(final weight - intial weight) / initial weight] x 100; specific
growth rate in weight (SGRW, % day-1) = [(ln final body weight - ln
initial body weight) / feeding trial period in day] x 100; feed
conversion ratio (FCR) = dry feed fed (g) / wet weight gain (g); and
survival (SR, %) = 100 x (final snail number) / (initial snail number)
(Tan, Mai and Luifu, 2001; Ye et al., 2006; Liu et al., 2006).
Statistical analysis
The data are presented as mean ± SD of the three replicates. All
growth data from each treatment were analyzed by one-way and
two-way analysis of variance (ANOVA) to test for the effects of the
dietary protein and energy levels. If significant (p < 0.05) differences were found in the one-way ANOVA test. A least significant
difference test was used to compare means. Treatment effects
were considered significant at P < 0.05.
RESULTS AND DISCUSSION
Final weight (FW), weight gain (WG), specific growth rate
in weight (SGR), survival rate (SR) and feed conversion
ratio (FCR) of juvenile B. areolata fed experimental diets
(Figure.1) containing various dietary protein (DP) and
dietary energy (DE) levels for 16 weeks are presented in
Table 2. Two-way ANOVA showed that dietary protein
significantly affected FW, WG and SGR (P < 0.05) but not
for SR, while dietary energy did not affect FW, WG, SGR
and SR (p > 0.05) but not for FCR. Significant
interactions were observed between dietary protein and
energy levels (p < 0.05) regarding FW, WG, SGR and
FCR but not for those of SR (Table 2). After 16 weeks of
the feeding trials, the spotted Babylon fed the diet
containing 35% DP and 4.0 kcal/g had the highest final
weight (2.88 g/snail), which were significantly different
from those fed 45% DP diets at all dietary energy levels
(2.17 - 2.67 g/snail). Weight gain (WG) of spotted
Babylon was significantly influenced by dietary protein
levels (p < 0.05) but not for dietary energy level (P >
0.05) and WG of snails were improved as dietary protein
decreased (p < 0.05). However, there was no significant
difference in WG between those of snails fed the diet
containing 35% and 40% dietary protein at the same
energy levels (p > 0.05). Spotted Babylon fed diet 2 (35%
-1
DP and 4.0 kcal g DE) had the highest WG (2.58 g /
snail). For all dietary protein, PWG of snails increased
with increasing dietary energy levels. Spotted Babylon
-1
fed diet 2 (35% DP and 4.0 kcal g DE) had the highest
PWG (874.53%), while those fed diet of 45% DP at all
Chaitanawisuti et al.
061
Table 2. Weight gain, specific growth rate, survival rate, feed efficiency ratio and protein efficiency ratio of juvenile B. areolata fed experimental diets
containing different dietary protein and energy levels for 16 weeks.
Diet
1
2
3
4
5
6
7
8
9
CP
35
35
35
40
40
40
45
45
45
DE
3.8
4.0
4.3
3.8
4.0
4.3
3.8
4.0
4.3
Two – way ANOVA
Dietary protein (CP)
Dietary energy (DE)
CP x DE
1
2
3
-1
4
5
Final Weight (g)
a
2.19 ± 0.11
b
2.88 ± 0.05
c
2.58 ± 0.34
d
2.65 ± 0.23
c
2.58 ± 0.12
d
2.67 ± 0.29
e
2.34 ± 0.07
a
2.17 ± 0.04
a
2.17 ± 0.07
WG (mg/snail)
a
1.89 ± 0.11
b
2.58 ± 0.06
c
2.29 ± 0.35
d
2.36 ± 0.24
c
2.29 ± 0.12
d
2.38 ± 0.27
2.05 ± 0.08e
1.89 ± 0.04a
a
1.85 ± 0.07
PWG (%)
a
651.29 ± 28.91
b
874.53 ± 10.21
c
759.54 ± 29.15
d
787.61 ± 64.87
e
816.72 ± 73.92
f
829.30 ± 99.24
g
696.90 ± 63.72
a
656.59 ± 32.21
h
579.73 ± 34.81
SGRW (%day )
a
1.88 ± 0.09
2.14 ± 0.02b
b
2.05 ± 0.17
b
2.08 ± 0.11
b
2.07 ± 0.07
b
2.09 ± 0.11
ab
1.94 ± 0.07
a
1.88 ± 0.05
a
1.85 ± 0.08
SR (%)
a
98.0 ± 1.2
a
98.6 ± 0.7
a
98.0 ± 3.6
a
97.5 ± 2.9
a
98.2 ± 0.6
98.3 ± 10.9a
a
97.7 ± 7.8
a
97.8 ± 10.4
a
97.8 ± 7.3
FCR
a
4.54 ± 0.23
b
3.21 ± 0.11
c
4.10 ± 0.43
d
3.88 ± 0.29
e
3.62 ± 0.20
f
3.68 ± 0.50
a
4.44 ± 0.24
a
4.43 ± 0.14
a
4.54 ± 0.08
0.00
0.132
0.001
0.000
0.132
0.001
0.000
0.037
0.003
0.000
0.162
0.007
0.442
0.519
0.717
0.000
0.001
0.003
Values (means ± SD of three replications) in the same column with different superscript are significantly different (P < 0.05).
CP: Crude protein (%); DE: Gross energy (kcal g-1)
1
weight gain: (final weight – intial weight)
2
Percent weight gain: [(final weight – intial weight) / initial weight] x 100
3
Specific growth rate in weight: 100 (ln final weight – ln initial weight) / days
4
Survival: 100 (final snail number) / (initial snail number)
5
Food conversion ratio: Feed consumed / wet weight gain.
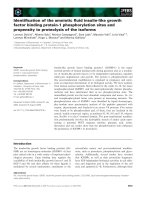
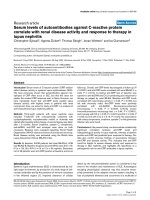
Figure 1. Growth in body weight of juvenile B. areolata fed experimental diets containing
different dietary protein and energy levels for 16 weeks.
dietary energy levels had the lowest PWG (579.73 696.90%), which were significantly different from those
fed other DP and DE diets (ranging 651.29 - 829.30%).
Similarly, specific growth rate in weight (SGRW) of
spotted Babylon was significantly influenced by dietary
protein levels (p < 0.05) but not for dietary energy levels
062
Int. J. Fish. Aquac.
(p > 0.05) and SGRW of snails was improved as dietary
protein decreased (p < 0.05). However, there was no
significant difference in SGRW between those of snails
fed the diet containing 35% and 40% protein at the same
energy levels (p > 0.05). Spotted Babylon fed diet 2 (35%
-1
DP and 4.0 kcal g DE) had the highest SGRW (2.14%
-1
day ), which were not significantly different from those
-1
fed diet 3, 4, 5 and 6 (ranging 2.05 - 2.09% day ), but not
for those fed diet 1, 7, 8 and 9 (ranging 1.85 - 1.94 %
-1
day ). This study did not agree with the study of Zhou et
al. (2007) which mentioned that optimal dietary protein
requirement for maximum growth and feed utilization of
juvenile B. areolata is 45% of dry diet. Maximum weight
gain, specific growth rate and soft body to shell ratio
occurred at 43% dietary protein level. However, those
diets contained higher levels of energy than all diets used
-1
in this study, ranging 15.13 to 15.40 MJ kg . Furthermore, Lee and Kim (2005) showed that mean weight gain
of the snail Semisulcospira gottschei was improved with
increasing dietary protein level up to 22 and 32% at 3.3
-1
and 3.9 kcal g diet, respectively, and mean weight gain
-1
of snails fed the 22% protein diet with 3.9 kcal g diet
was not significantly different from that of snails fed the
-1
32 - 52% protein diets with 3.3 and 3.9 kcal g diets.
Considering this growth response, optimal dietary protein
and energy levels are about 35% and 4.0 kcal/g diet for
growth of the spotted Babylon.
Survival rates (SR) of each group was all above 95%
and no significant difference among dietary treatments (P
> 0.05). SR of spotted Babylon was not influenced by
dietary protein and dietary energy levels, which agreed
with the studies with various fish and shellfish such as
snail Semisulcospira gottschei (Lee and Kim 2005),
abalone Haliotis asinina (Teruel and Millamema, 1999),
olive flounder Paralichthys olivaceus (Kim et al. 2004),
cuneate drum Nibea miichthioides (Wang et al. 2006),
rock lobster Jasus edwardsii (Ward et al. 2003), ivory
shell Babylonia areolata (Zhou et al. 2007), native frog
Rana rugulosa (Somsueb and Boonyaratpalin, 2001),
yellowtail Seriola dumerili (Vidal et al., 2008). Survival
was generally high ranging 97.8 - 98.6% for all treatments. The high survival of spotted Babylon noted for all
treatments may well indicated that there was generally a
balance of nutrients in the diets although the lower
protein content in the diet may not have been enough to
sustain comparable growth of spotted Babylon with those
fed the other dietary protein and energy diets.
Feed conversion ratio (FCR) of spotted Babylon was
significantly influenced by dietary protein and dietary
energy levels (p < 0.05). Diets containing 35% dietary
protein and 4.0 kcal / g dietary energy appeared to be
utilized more efficiently in term of FCR (3.21) than diets
containing the other dietary protein and energy levels,
ranging 3.62 - 4.54. The FCR (>4.0) shown in Table 2
obtained with spotted Babylon fed the highest protein diet
(45%) at all dietary energy, ranging 4.43 - 4.54).
However, the FCR obtained with spotted Babylon fed
40% protein diet at all dietary energy ranged 3.62 - 3.88.
This result suggested that the amount of calories taken in
by the snails somehow affected the amount of food
consumed.
The protein and energy requirements of aquatic
animals vary with fish and shellfish species size, dietary
protein quality, and environmental conditions. The non
protein energy levels may also influence the dietary
protein requirement of animals. When insufficient nonprotein energy is available in feeds, dietary protein is
deaminated in the body to supply energy for metabolism
rather than being used for tissue growth, and excreted
ammonia can reduce water quality. Because fish
consume food to satisfy their energy requirement, excess
dietary energy may limit intake of essential nutrients like
protein and amino acids. Thus, excesses of energy can
lead to growth reduction and increase fat deposition in
fish (Daniels and Robinson 1986). A good agreement
was observed in this study that the snails fed on diets
containing higher protein level (45%) and energy levels
94.0 and 4.5 kcal/g diet had slower growth than those fed
diets with lower protein of 35% and 4.0 kcal/g diet of
energy level. Lee and Kim (2005) also indicated that a
diet containing 22% protein and 3.3 kcal/g diet with P/E
ratio of 69 mg protein/kcal was recommended for growth
of snail (Semisulcospira gottschei). In addition, snails fed
the 3.9 kcal/g diet showed a tendency toward to higher in
18:1n-9, 18:2n-6, 18:3n-3 and 22:6n-3 and lower in
20:4n-6 and 22:1n-9 than those of snails fed the 3.3
kcal/g diet energy diets. He also suggested that snail
require n-3 unsaturated fatty acids as essential fatty acids
in diets for normal growth, and plant oil could be used as
an energy source when n-3 highly unsaturated fatty acids
requirement is satisfied. Information on essential fatty
acids requirements of spotted Babylon is not available.
Some studies showed that the proper ratio of n-3 to n-6
levels was critical for the growth or high resistance to
disease infection of several fish rather than n-3 level or n6 level alone (Lee and Kim, 2001). Therefore, more
studies considering dietary fatty acid profiles on the performance of spotted Babylon are necessary.
Furthermore, if the most effective protein / energy ratio is
maintained, then a reduction in the level of dietary protein
without a corresponding reduction in growth might be
possible. Also, a modification of the proportions of dietary
carbohydrate and lipid may contribute to a greater growth
response. However, a possible reduction in dietary lipid,
as suggested by the efficient use of carbohydrate as an
energy source must be approached carefully to ensure
that satisfaction of the essential fatty acid requirements is
maintained. A reduction in dietary lipid will also contribute
to successful manufacture of a diet on a commercial
scale.
In conclusion, results of the present study indicate that a
-1
diet containing 35% dietary protein and 4.0 kcal g diet
with P/E ratio of 85.99 mg protein / kcal was
recommended for juvenile B. areolata growth under our
Chaitanawisuti et al.
experimental recirculating seawater conditions.
ACKNOWLEDGMENTS
This study was supported by the National Research
Council of Thailand (NRCT), who provided the funding for
this research in the fiscal year 1996-2008. We are
especially grateful to Professor Yutaka Natsukari, Faculty
of Fisheries, Nagasaki University, Japan for his
encouragement and critical reading of the manuscript.
REFERENCES
Bicudo AJA, Sado RY, Cyrino JEP (2009) Growth and haematology of
pacu, Piaractus mesopotamicus, fed diets with varying protein to
energy ratio. Aquacult. Res. 40: 486-495.
Catacutan MR, Pagador GE, Teshima S (2001) Effect of dietary protein
and lipid levels and protein to energy ratios on growth, survival and
body composition of the mangrove red snapper, Lutjanus
aregentimaculatus (Forsskal 1175). Aquacult. Res. 32: 811-818.
Fineman-kalio AS, Camacho AS (2008). The effects of supplemental
feeds containing different protein: energy ratios on the growth and
survival of Oreochromis niloticus (L.) in brackish water ponds.
Aquacult. Res. 18: 139-149.
Kim KW, Wang XW, Choi SM, Park GJ, Bai SC (2004). Evaluation of
optimum dietary protein to – energy ratio in juvenile olive flounder
Paralichthys olivaceus (Temminck et Schlegel). Aquacult. Res. 35:
250-255.
Lee SM, Kim KD (2001). Effects of dietary protein and energy levels on
the growth, protein utilization and body composition of juvenile masu
salmon (Oncorhynchus masou Brevoort). Aquacult. Res: 32: 39-45.
063
Lee SM, Kim TJ (2005). Effects of dietary protein and energy levels on
the growth and lipid composition of juvenile snail (Semisulcospira
gottschei). J. Shellfish Res. 24: 99-102.
Montes LG, Esquivel ZG, Abramo LR, Shimada A, Pelaez CV, Viana
MT (2003). Effect of dietary protein : energy ratio on intake, growth
and metabolism of juvenile green abalone Haliotis fulgens.
Aquaculture 220: 769-780.
Somnueh P, Boonyaratpalin M (2001). Optimum protein and energy
levels for the Thai native frog, Rana rugulosa Weigmann. Aquacult.
Res. 32: 33-38.
Sweilum MA, Abdella MM, El Din SAS (2005). Effect of dietary protein –
energy levels and fish initial sizes on growth rate, development and
production of Nile tilapia, Oreochromis niloticus L. Aquacult. Res. 36:
1414-1421.
Teruel MNB, Millamena OM (1999). Diet development and evaluation
for juvenile abalone, Haliotis asinina : protein / energy levels
Aquaculture 178: 117-126.
Vidal AT, Garcia FDG, Gomez AG, Cerda MJ (2008). Effect of the
protein / energy ratio on the growth of Mediterranean yellowtail
(Seriola dumerili). Aquacult. Res. 39: 1141-1148.
Ward LR, Carter CG, Crear BJ, Smith DM (2003). Optimal dietary
protein level for juvenile southern rock lobster, Jasus edwardsii, at
two lipid levels. Aquaculture 271: 483-500.
Wang Y, Guo JL, Li K, Bureau DP (2006). Effect of dietary protein and
energy levels on growth, feed utilization and body composition of
cuneate drum (Nibea miichthioides). Aquaculture 252: 421-428.
Zhou JB, Zhou QC, Chi SY, Yang QH, Liu CW (2007). Optimal dietary
protein requirement for juvenile ivory shell, Babylonia areolata.
Aquaculture 270: 186-192.
Zhou QC, Zhou JB, Chi SY, Yang QH, Liu CW (2007). Effect of dietary
lipid level on growth performance, feed utilization and digestive
enzyme of juvenile ivory shell, Babylonia areolata. Aquaculture 272:
535-540.