Effect of drying, blanching and rehydration behavior on the quality of green peas
Bạn đang xem bản rút gọn của tài liệu. Xem và tải ngay bản đầy đủ của tài liệu tại đây (866.74 KB, 15 trang )
Int.J.Curr.Microbiol.App.Sci (2019) 8(3): 2340-2354
International Journal of Current Microbiology and Applied Sciences
ISSN: 2319-7706 Volume 8 Number 03 (2019)
Journal homepage:
Original Research Article
/>
Effect of Drying, Blanching and Rehydration Behavior
on the Quality of Green Peas
Madhuri More1* and Datta Tayade2
1
2
Department of Agricultural Process Engineering, DYPCAET, Kolhapur, India
Department of Agricultural Process Engineering, CAET, Jalgaon-Jamud, India
Affiliated by MPKV, Rahuri, India
*Corresponding author
ABSTRACT
Keywords
Pre-treatments,
Drying time, Drying
rate, Drying air
temperature,
Quality evaluation
Article Info
Accepted:
20 January 2019
Available Online:
10 February 2019
Green Peas (Pisum sativum) is one of the most commonly grown food legumes in the
world. Three different samples of Green Peas with respect to pre-treatments viz. raw,
blanched and blanched after pricking were taken for drying experiment. A laboratory
model tray dryer was used for drying green peas with different levels of drying air
temperatures (50°, 60°, 70°C). The moisture content of green peas decreases an elapsed
drying time during tray drying of green peas. The result shows that the blanched green
peas had slightly higher moisture content than raw and pricked green peas. The drying rate
was higher at 70°C when compared to 50°C and 60°C drying air temperature. The value of
Rehydration Ratio (RR) and Coefficient of Rehydration (COR) where higher in case of
dried pricked green peas samples at all drying air temperature. The maximum value of RR
and COR where found as 1.968 and 0.617 for pricked green peas at 50 0C drying air
temperature. The above dried green peas show best rehydration characteristics to yield
good quality rehydrated Green Peas which could be preserved and used during off-season.
Introduction
Green peas (Pisum sativum) is one of the
most commonly grown food legumes in the
world it has been widely used in human diet
for a long time because it is an excellent
source of nutrients and contains high
proportion
of
digestible
protein,
carbohydrates, minerals and vitamins. In case
of Indian peoples, they consume fresh green
peas as a vegetable in food. But due to their
seasonal and perishable nature, drying is
useful to increase the shelf life. The
cultivation of green peas is a very ancient.
They are recognized as a high quality
nutritious source. The field pea is native to the
Mediterranean region of the Southern Europe
and to Western Asia. It is probably
indigenous to the region comprising Italy and
South Western Asia, eastwards of the
Himalayas, including northern India. The
major producer countries include China,
India, United States, France and Egypt (Singh
et al., 1983). The fruit is a typical pod
containing four to nine seeds. The length of
pods is 5 to 9 cm and shape are inflated but
they are available only during seasons. Green
peas are available for around 5 months during
2340
Int.J.Curr.Microbiol.App.Sci (2019) 8(3): 2340-2354
winter season only. They are used for making
vegetables, as additives in certain vegetables
and for making several snack preparations.
But the shelf life of green peas is not more
than 3-4 days.
Drying is one of the oldest methods and most
traditional methods. By reducing the moisture
up to a certain level in fruits and vegetables,
the microbiological spoilage and deteriorative
chemical reactions are greatly minimized. In
addition to preservation, drying lowers the
cost of packaging, storage and transportation
by reducing both of the weight and volume of
the final product (Doymaz and Kocayigit,
2011).
Materials and Methods
Good quality fresh Green Peas (Pisum
sativum) was purchased from a local market.
Damaged, immature, and dry pods was
removed manually by visual inspection. The
pea pods were shelled manually. The average
diameter sized green peas were selected by
using required sieves. The initial moisture
content of green peas was determined using a
standard method by hot air oven drying at
1020C±2 for 24 h by AOAC (Association of
Official Analytical Chemist) method. The
most critical raw material was collected fresh
and matured green pea pods.
Traditional methods of drying
Water content for properly dried foods varies
from 5 to 25% depending on the food. When
drying foods, the key is to remove moisture as
quickly as possible at a temperature that does
not seriously affect the flavor, texture and
color of the food. If the temperature is too low
in beginning, micro-organisms may survive
and even grow before food is adequately
dried. If the temperature is too high and the
relative humidity is too low, the food may
harden on the surface. This makes it more
difficult for moisture to escape and the food
does not dry properly (Sahay and Singh,
1994). But drying technique preserves them
for few months and the original taste, flavor
and color is also retained. In drying of fruits
and vegetables the color changes during
process is important factor.
So, pretreatments like blanching or acid
treatments are concerned. Also, the drying
time and drying rate are important during
drying so before drying, operation like
pricking is carried out (CFTRI, Mysore). So,
keeping in view the main aim of this research
work is to study the traditional methods for
processing of green peas, to study the drying
characteristics of different green peas samples
during hot air drying and to study the quality
characteristics of dried green peas.
Most of the agricultural products especially
fruits and vegetables are perishable materials.
So, from time immemorial there were big
efforts in every culture about preservation of
foods. These efforts called traditional
methods of food processing. These traditional
methods play very important role in every
culture. So, this study deals with survey of
traditional methods for green peas processing.
Procurement of raw material and sample
preparation
The fresh and good quality green peas were
procured from local market of Kolhapur as
showed in Figure 1. A damaged, immature,
and dry pod was removed manually by visual
inspection. The average diameter sized green
peas were selected by using required sieves.
The concerned information was collected
from farmers, local market, processors and
traders.
Pretreatments
Pretreatment prevents the loss of color by
inactivating enzymes, reduces the drying time
by relaxing tissue structure, and yields a good
quality dried product. Pricking was done by
2341
Int.J.Curr.Microbiol.App.Sci (2019) 8(3): 2340-2354
using needle of regular size as it affects the
drying rate and blanching is a pretreatment
method used to arrest some physiological
process for drying of vegetables and fruits.
For blanching green peas was immersed in
hot water at 85°C for 1 minute and then
immediately placed under running cold water
for at least 3 minutes (Doymaz and Kocayigit,
2011).
(1)
In this expression Wm is the weight of
material in gram and Wd is the weight of dry
matter in gram.
The moisture content of the sample can be
calculated as:
Determination of moisture content
(2)
The determination of moisture is empirical
methods because the various moisture
determination methods measure more or less
the water present in the product. Thus, the
experimental conditions or method govern to
some extent, the amount of moisture obtained.
Air oven method is most suitable method for
determination of moisture content. Initial
moisture content of the green peas was
determined for finding the dry matter as well
as moisture content of the raw sample.
The samples (20-25g) were dried in the hot
air oven at 102°C ± 2°C for 24 hours. The
moisture content of prepared raw green peas
was determined from 70 to 75% (w.b).
In this expression W1is the initial weight of
sample in gram and W2is the final weight of
sample in gram.
Drying rate is expressed as follows:
(3)
Drying of green pea samples
The drying operation was carried out with
following independent and dependent
parameters/variables to study the Drying
Characteristics.
Samples: Raw, Blanched and Blanched after
pricking as showed in Figure 2, 3 and 4.
Independent variables
Drying air temperatures: 50°, 60° and 70° C.
Type of sample: Raw, blanched, blanched
after pricking
Blanching time: 1 minute in boiling water at
85°C.
Drying air temperature: 50°, 60° and 70°C
Dependent variables
In these ways three samples of green peas viz.
Raw, Blanched and Blanched after pricking
was prepared. The total dry materials or the
initial moisture content of raw green peas was
determined in accordance with AOAC
method (Anonymous, 1990) and Moisture
Content (w.b) was calculated using following
formula:
Drying time (minutes)
Drying rate (kgW/kg.dm.h)
Moisture content in final product (% w.b.)
Experimental procedure
An electrical tray dryer was used for drying
green peas. Three different samples of green
2342
Int.J.Curr.Microbiol.App.Sci (2019) 8(3): 2340-2354
peas viz. raw, blanched and blanched after
pricking was taken for drying experiment at
each level of drying air temperature.
The drying air temperature was set at desired
level (50°, 60°, 70°C) by adjusting thermostat
an electric balance was used to measure the
weight of green peas at different time
intervals. Drying was continued till the green
peas up to attained constant weight (safe
moisture content). Drying time, drying rate,
moisture content of final product was
calculated by using experimental records. The
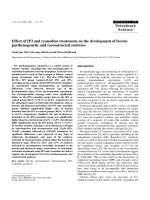
experimental procedures of pre-treatments of
green pea are as shown in Figure 5.
excess water was drained off through filter
paper. The drained samples were weighed.
Rehydration Ratio (RR), Coefficient of
Rehydration (COR) and moisture in the
rehydrated samples (MCR) were computed
using following formulae:
(4)
(5)
(6)
Quality characteristics of dried green peas
The dried green pea samples were evaluated
for their quality by sensory evaluation for
colour, taste, and appearance. Rehydration
characteristics of dried green peas were also
determined.
Sensory evaluation
To the customer point of view, organoleptic
characteristics such as colour, taste, texture,
and appearance was observed. The dried
green peas were tested for above organoleptic
attributes. Performa consisting of basic
organoleptic characteristics was prepared and
evaluated in a 9-point hedonic scale as per
method described by Ranganna (1986). A
group of 10 technically competent panelists of
the college was asked to judge the quality of
the products sensorially and give marks for
different quality attributes out of 10 marks.
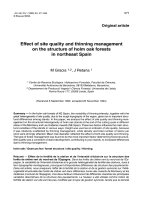
Rehydration
The rehydration quality of dried green peas
was determined by rehydration test
(Ranganna, 1986). The dehydrated sample of
10 g each was placed in glass beakers, 200 ml
of water was added and heated at 40°C to
45°C for 60 min as showed in Figure 6. The
Where,
A
= Moisture content of samples before
dehydration, percent (w.b.)
B
= Moisture content of dehydrated
sample, percent (w.b.)
C
= Drained weight of rehydrated
sample, gram.
D
= Weight of dehydrated samples
taken for rehydration test, gram.
E
= Dry matter content in the sample
taken for rehydration, gram.
Results and Discussion
In this chapter, the results of the current
investigations have been presented under
appropriate heads and sub-heads and have
been discussed wherever possible in light of
the causes and effects. This chapter deals with
the results of survey of traditional methods for
green pea processing, blanching of green pea,
blanched after pricking of green pea and
quality characteristics of dried green pea
Traditional
processing
methods
for
green
pea
A survey was conducted to study the present
status of processing of green peas in nearby
2343
Int.J.Curr.Microbiol.App.Sci (2019) 8(3): 2340-2354
area of Kolhapur. Efforts were made to obtain
complete information from farmers, traders,
local processers etc. The collected
information included the practices carried out
after harvesting of green peas.
The results of survey show that common
practices like cleaning, sorting of green peas
pods is the first step off after harvesting. the
major portion of this green peas pods goes to
the market where it is sold as a fresh
vegetable. Some portion of fresh green peas
sun dried up to 3 to 4 days depends on
available sunshine. Sun drying produces
inferior quality product with high loss of
nutrients also the shelling of pods and sun
drying process are time consuming and labour
intensive practices.
Survey result underlined the need of
technological investigation at various stages
of post-harvest processing of green peas.
Drying characteristics of dried green peas
moisture or weight loss also increases for all
the treatments. Higher temperature of drying
helps to reduce the time required to dry the
peas up to equilibrium moisture content for
the drying temperatures of 50°C, 60°C and
70°C respectively.
The changes in the moisture content of green
pea samples with drying time under different
drying conditions was studied with the help of
Figure 7, 8 and 9. The moisture content of the
green peas decreased with drying time
irrespective of drying air temperatures
indicating continuous drying process. The
decrease in the drying time with increase in
drying air temperature and type of sample was
due to increase in the water vapour pressures
within the food. Curve fitting was also carried
out in Figure 7, 8 and 9 to see the moisturetime relationship. An exponential type
relationship was observed in all three types of
peas.
Effect of drying air temperature and
treatment on drying rate of green peas
Raw, blanched and blanched after pricking
samples of dried green peas were dried in the
tray dryer at three drying air temperatures
namely 50°C, 60°C and 70°C. Weight loss in
terms of moisture was recorded and
observations are tabulated Table 1. Drying
time, moisture reduction and drying rate was
seen through different data tables constructed
to plot drying curves.
Effect of drying air temperature, treatment
on drying time and moisture reduction of
green peas
The moisture content at different time interval
(elapsed time) for tray drying of green peas
samples at different drying air temperatures
has been shown in Table 1.
From the Table 1, it is clear that as the drying
air temperature increases, the reduction in
The drying rates were calculated from the
drying data by estimating the change in the
moisture content, which occurred in each
consecutive time interval and was expressed
in kgw/kg.dm.h ×10–3 as shown in Tables 2, 3
and 4 and to plot different drying rate curves
(Figure 10). The drying rate curves were
plotted between average moisture content
(kgw/kg.dm) and drying rate (kgw/kg.dm.h
×10–3). The drying rates were higher at the
beginning of the drying process when
moisture content was highest and later
decreases with decreasing moisture content,
for all the drying conditions.
The main factor influencing the drying rate
was the drying air temperature. The higher air
temperature resulted in higher drying rate, and
consequently shorter drying time. This is due
to increase of heat transfer between the air
2344
Int.J.Curr.Microbiol.App.Sci (2019) 8(3): 2340-2354
and the green pea samples. The rate of drying
was higher at 70°C when compared to 50°C
and 60°C drying air temperature.
followed by raw and blanched samples. From
the average scores in Table 5, it was found
that the drying air temperature and sample
type both affects the sensory attributes
because score shows that with increase in
drying air temperature there was decrease in
average score. The samples dried at 50°C
earned the best scores for all sensory
attributes as compared to samples dried at
60°C and 70°C. The maximum scores for
pricked samples dried at 50°C were obtained
as 5.77, 6.00, 6.44 and 24.44 for colour,
texture, taste, appearance and overall
acceptability respectively. These scores were
highest among all three samples within 50°C
drying air temperature. Thus, the green peas
samples dried at drying temperature of 50°C
resulted in the best acceptable quality product
for different types of temperature.
Quality characteristics of dried green peas
Sensory evaluation of final product
The sensory average scores given by 10
panelists for different quality attributes of the
dried Green Peas are presented in Table 5.
From Table 5, it is seen clearly that the
blanched and pricked green peas got high
scores as compared to raw samples in terms
of colour, texture, taste, appearance and
overall acceptability at all drying air
temperatures. The dehydrated pricked
samples were found best in colour, texture,
taste, appearance and overall acceptability
Table.1Variation in moisture content (kgW/kg.dm) of green peas
for different drying air temperatures
Elapsed
Drying Time
(min)
0
15
30
45
60
75
90
120
150
180
210
240
270
300
360
420
480
510
Raw Samples
50°C
2.6
2.32
2.18
2.02
1.9
1.8
1.7
1.7
1.24
1.01
0.64
0.49
0.39
0.29
0.22
0.12
0.09
0.09
60°C
2.84
2.8
2.6
2.35
2.18
2.06
1.9
1.6
1.229
0.932
0.64
0.489
0.37
0.32
0.2
0.09
0.09
700C
2.832
2.616
2.378
2.202
2.062
1.916
1.763
1.451
1.241
1.097
0.822
0.692
0.501
0.381
0.183
0.183
Blanched Samples
50°C
2.51
2.32
2.1
2
1.67
1.47
1.25
0.93
0.709
0.53
0.401
0.39
0.3
0.16
0.13
0.13
2345
60°C
2.87
2.7
2.4
2.22
2.1
1.937
1.814
1.616
1.422
1.16
0.75
0.513
0.26
0.445
0.445
70°C
2.516
2.17
1.8
1.48
1.26
0.98
0.78
0.62
0.5
0.48
0.341
0.27
0.16
0.15
Blanched after pricking
Samples
50°C
60°C
70°C
2.26
2.4
2.25
1.9
2.1
1.62
1.54
1.435
1.17
1.12
1.1
0.7
1.04
0.83
0.605
0.81
0.52
0.47
0.69
0.38
0.37
0.49
0.331
0.318
0.32
0.29
0.3
0.3
0.27
0.27
0.232
0.209
0.215
0.212
0.19
0.199
0.16
0.122
0.124
Int.J.Curr.Microbiol.App.Sci (2019) 8(3): 2340-2354
Table.2 Variation in drying rate of raw green peas with average moisture content at different
drying air temperatures
Drying at 50°C
Average
Drying rate
moisture
kgW/kg.dm.h
content
× 10-3
kgW/kg.dm
0.900
70.891
0.752
69.225
0.708
67.700
0.617
66.408
0.583
65.248
0.590
63.540
0.545
60.942
0.521
57.464
0.514
52.907
0.547
44.593
0.518
35.700
0.482
30.111
0.453
24.936
0.389
20.015
0.347
14.343
0.308
9.337
0.290
7.886
Drying at 60°C
Average
Drying rate
moisture
kgW/kg.dm.h
content
× 10-3
kgW/kg.dm
73.658
279.73
72.406
262.66
70.884
243.69
69.323
226.19
67.917
211.80
66.356
197.46
63.493
174.66
58.357
141.58
51.685
108.03
43.768
78.96
35.969
56.59
29.596
42.30
25.674
34.56
20.761
26.52
12.523
14.57
8.326
9.08
Drying at 70°C
Average
Drying rate
moisture
kgW/kg.dm.h
content
× 10–3
kgW/kg.dm
73.120
0.866
71.368
0.908
69.584
0.840
68.062
0.769
66.529
0.733
64.759
0.712
61.509
0.690
57.296
0.636
53.853
0.578
48.726
0.574
43.028
0.535
37.171
0.518
30.521
0.490
21.554
0.441
15.484
0.378
Table.3 Variation in drying rate of blanched green peas with average moisture content at
different drying air temperatures
Drying at 50°C
Average
Drying rate
moisture
kgW/kg.dm.h
content
× 10-3
kgW/kg.dm
241.354
70.689
220.917
68.806
200.437
66.679
178.646
64.047
156.681
60.980
135.721
57.487
109.170
51.920
82.140
44.885
61.921
38.054
46.594
31.653
39.432
28.279
34.061
25.318
22.489
18.097
14.323
12.519
13.100
11.583
Drying at 60°C
Average
Drying rate
moisture
kgW/kg.dm.h
content
× 10-3
kgW/kg.dm
73.33
275.40
71.53
251.77
69.73
230.69
68.31
215.70
66.82
201.63
65.20
187.56
63.12
171.56
60.25
151.96
56.12
128.72
48.19
95.10
38.40
63.20
27.14
38.47
16.50
20.02
12.66
14.50
2346
Drying at 70°C
Average
Drying rate
moisture
kgW/kg.dmkh
content
× 10–3
kgW/kg.dm
70.003
1.381
66.340
1.440
61.913
1.387
57.593
1.264
52.497
1.231
46.554
1.159
41.071
0.945
35.935
0.805
32.763
0.681
28.759
0.621
23.115
0.563
17.254
0.524
13.274
0.474
Int.J.Curr.Microbiol.App.Sci (2019) 8(3): 2340-2354
Table.4 Variation on drying rate after pricking green peas with average moisture content at
different drying air temperatures
Drying at 50°C
Average
Drying rate
moisture
kgW/kg.dm.h
content
× 10-3
kgW/kg.dm
204.494
67.009
169.109
62.727
137.004
57.582
111.781
52.714
92.794
47.961
74.980
42.764
58.300
36.582
40.283
28.475
30.729
23.497
26.275
20.762
22.267
18.207
18.259
15.384
13.846
12.149
Drying at 60°C
Average
Drying rate
moisture
kgW/kg.dm.h
content
× 10-3
kgW/kg.dm
68.197
216.214
62.378
168.039
55.720
127.037
49.044
97.156
39.908
67.912
30.823
44.907
26.145
35.441
23.558
30.857
21.724
27.759
19.269
23.939
16.505
19.779
13.285
15.407
Drying at 70°C
Average
Drying rate
moisture
kgW/kg.dm.h
content
× 10–3
kgW/kg.dm
65.585
2.490
57.838
2.177
49.033
1.938
41.022
1.644
34.862
1.423
29.316
1.258
25.357
0.966
23.449
0.782
21.815
0.662
19.290
0.581
17.172
0.513
Table.5 Average scores for different sensory attributes of dried Green Pea samples
Quality
Colour
Texture
Taste
Appearance
Overall Acceptability
Type
of Sample
Raw
Blanched
Pricked
Raw
Blanched
Pricked
Raw
Blanched
Pricked
Raw
Blanched
Pricked
Raw
Blanched
Pricked
50°C
5.33
6.22
5.66
4.55
5.44
5.77
5.22
6.00
6.00
5.44
6.33
6.44
5.00
6.75
7.00
2347
Drying Air Temperature
60°C
4.11
5.33
4.66
4.55
4.66
4.88
4.88
5.00
5.33
4.55
4.88
4.66
4.00
4.25
4.50
70°C
3.77
5.00
4.55
4.66
5.11
4.77
4.55
5.44
5.33
4.22
5.00
4.66
3.75
3.50
4.00
Int.J.Curr.Microbiol.App.Sci (2019) 8(3): 2340-2354
Table.6 Moisture content in final dried green peas at different drying air temperatures
Drying Air
Temperature, 0C
50°
60°
70°
Sample Type
Raw
Blanched
Pricked
Raw
Blanched
Pricked
Raw
Blanched
Pricked
Moisture content in final product
% w.b.
% d.b.
kgw/kg.dm
10.27
8.43
0.084
9.05
10.06
0.100
7.52
11.57
0.116
8.76
10.41
0.104
7.55
12.24
0.122
6.95
13.38
0.133
7.32
12.66
0.126
6.69
13.84
0.138
5.72
16.48
0.164
Table.7 Rehydration characteristics of dried green peas at different drying air temperatures
Sample Type
Raw
Blanched
Pricked
Raw
Blanched
Pricked
Raw
Blanched
Pricked
Drying Air
Temperature
(0C)
50°
60°
70°
Moisture in
Rehydrated
Sample (% w.b.)
49.357
56.985
62.458
44.653
52.450
56.127
39.280
48.347
56.289
Rehydration
Ratio
Coefficient of
Rehydration
1.998
2.097
2.652
1.968
2.345
2.629
2.124
2.278
2.598
0.594
0.571
0.728
0.617
0.638
0.708
0.688
0.707
0.681
Fig.1 Raw green pea pods
2348
Int.J.Curr.Microbiol.App.Sci (2019) 8(3): 2340-2354
Fig.2 Fresh green peas
Fig.3 Blanched green peas
Fig.4 Pricked green peas with needle
2349
Int.J.Curr.Microbiol.App.Sci (2019) 8(3): 2340-2354
Fig.5 Flow diagram showing the studies on drying of green peas
Survey of Traditional Methods
Procurement of Row Green Peas
Cleaning
Sorting
Raw
Blanched samples
Blanched after
Samples
1 min for 85°C
Pricking
Drying at
50°, 60° and 70°C
Quality evaluation
Fig.6 Rehydration of dried green peas
2350
Int.J.Curr.Microbiol.App.Sci (2019) 8(3): 2340-2354
Fig.7 Variation in moisture content of raw green peas with elapsed drying time at different
drying air temperatures
Fig.8 Variation in moisture content of blanched green peas with elapsed drying time at different
drying air temperatures
Fig.9 Variation in moisture content of blanched after pricking green peas with elapsed drying
time at different drying air temperatures
2351
Int.J.Curr.Microbiol.App.Sci (2019) 8(3): 2340-2354
Fig.10 Variation in moisture content of raw, blanched and blanched after pricking green peas with average moisture content at
different drying air temperatures
Raw Green Peas
Blanched Green Peas
2352
Blanched after pricking Green Peas
Int.J.Curr.Microbiol.App.Sci (2019) 8(3): 2340-2354
Moisture content in final product
Moisture content in the final dehydrated
products was determined by hot air oven
method. Observed values are presented in
Table 6.
Rehydration
product
characteristics
of
final
The
rehydration
characteristics
i.e.
rehydration ratio, coefficient of rehydration,
and moisture in rehydrated samples of dried
Green Peas are shown in Table 7.
Table 7 reveals that the values of rehydration
ratio (RR) and coefficient of rehydration
(COR) were higher in case of dried Pricked
Green Peas sample at all drying air
temperatures. The maximum values of RR
and COR were found as 2.652and 0.728.
Green Peas dried at 50oC drying air
temperature. One important thing observed
that was sample type and drying air
temperature both played important role in
rehydration characteristics. The moisture
content of rehydrated green peas samples also
followed the same trend. The highest value
for moisture in rehydrated sample (% w.b.)
for the Pricked Green Peas dried at
50°Cdrying air temperature, which depict that
the rehydrated product could very well be
utilized for substituting the fresh product in
off-season.
Based on all the above quality characteristics,
the pricked green peas samples dried at 50°C
emerged as the best sample having desirable
quality.
In conclusion, blanched green peas had
slightly higher moisture content than raw and
pricked green peas. The drying rate was
higher at 70°C when compared to 50°C and
60°C drying air temperature. The value of
Rehydration Ratio (RR) and coefficient of
Rehydration (COR) where higher in case of
dried Pricked Green Peas samples at all
drying air temperature. The maximum value
of RR and COR where found as 1.968 and
0.617 for pricked green peas at 500C drying
air temperature. The above dried green peas
show best rehydration characteristics to yield
good quality rehydrated green peas which
could be preserved and used during offseason. The sensory evaluation shows that
dried pricked green peas samples were found
best in colour, texture, taste, appearance and
overall acceptability followed by blanched
and raw dried green peas samples. The dried
green peas with final moisture content 7.5%
on wet basis showed best rehydration
characteristics to yield good quality
rehydrated peas which could be preserved and
used during off-season.
References
Argyropoulos, D., Heindl, A. and Muller, J.,
2008, October. Evaluation of processing
parameters for hot-air drying to obtain
high quality dried mushrooms in the
Mediterranean region. In Conference on
International Research on Food
Security,
Natural
Resource
Management and Rural Development,
University of Hohenheim, Stuttgart,
Germany, 7-9.
Anastasia, M.S., and Schepers, R. D., 2007.
Study of Green Peas: Protein, Fiber &
more. International Journal of Drying
Technology.
Anonymous,1990.AOAC“Official method of
analysis”, 15th Edition. Association of
Official Analytical Washington D. C.
Anonymous, 2007. Model bankable scheme
for
organic
cultivation
of
ginger.(National Bank for Agricultural
and Rural Development).
Central Food Technological Research
Institute, Mysore. Study of dehydration
of Green peas.
2353
Int.J.Curr.Microbiol.App.Sci (2019) 8(3): 2340-2354
Chen G. and Mujumdar, A. S., 2003. Study
on drying technology. International
Journal of Drying Technology, 6:110114.
Chhidda Singh, Prem Singh and Rajbir Singh,
1983. Modern Techniques of Rising
Fields Crops Oxford and IBH
Publishing Co. Pvt. Ltd, New Delhi.
Diwaker, M. K. and Singh, N. K., 2010.
Study on Process Technology for Carrot
Cubes. Unpublished B. Tech. Thesis,
C.A.E., Pusa.
Doymaz and Kocayigit, (2011). Drying
Technology, 29:73.
Kar, A. and Gupta, D. K., (2003), Central
Food Technological Research Institute,
Mysore.
Krokida, M. K. and Marinos-Kouris, D.,
(2003). Rehydration kinetics of
dehydrated product. Journal of Food
Engineering 57: 1-7.
Lyderson, A. L., (1983). Mass transfer in
engineering practice. John Wiley and
Sons publishing company, New York.
Mujumdar, A. S. Drying Technology in
Agriculture and Food Sciences; Oxford
and IBH Publishing Co. Pvt. Ltd.: New
Delhi, 2000.
Mudgal, V. D and Pandey, V. K., (2008).
Effect of pre-treatment on dehydration
of cauliflower. Journal of Food Science
and Technology, 45(5): 426-429.
Patil, A. S. and Kubde, A. B., (2011). Tray
drying of button mushroom (Agricus
bisporus). International Journal of
Agricultural Engineering, 4(1): 24-27.
Pedreschi, F., Moyano, P., Santis, N. and
Pedreschi,
R.
(2006).
Physical
properties of pretreated potato chips.
Journal of Food Engineering, 22(5): 4549.
Ranganna, S., (1986). Hand book of analysis
and quality controller fruit and
vegetable products. Tata McGraw Hill
Publication Co, New Delhi.
Sahay and Singh, (1994). Unit operation of
Agricultural
processing.
Second
Revised and Enlarged Edition.
Sahu R., Verma A., Patel S. and Mishra, N.
K., (2008). Study of drying technology.
International Research Journal of
agricultural Sciences.
Saputra, D., (2001). Drying and Dehydration
of Pineapple, 19(2): 415-425.
Shrivastava, (1998). Studies on mushroom
dehydration
(Pleurotus
florida).
Unpublished Ph.D. Thesis, IIT,
Kharagpur.
Singh, B., Kumar, A. and Gupta, A.K., 2007.
Study of mass transfer kinetics and
effective diffusivity during osmotic
dehydration of carrot cubes. Journal of
food Engineering, 79(2): 471-480.
Waddle, S. G., Math, R. G., Chakkaravarthi,
A. and Rao, D. E., (1992). Preservation
of carrots (Daucus carrota L) by
dehydration techniques A review.
Indian Food Packer, Pp. 36-43.
How to cite this article:
Madhuri More and Datta Tayade. 2019. Effect of Drying, Blanching and Rehydration Behavior
on the Quality of Green Peas. Int.J.Curr.Microbiol.App.Sci. 8(03): 2340-2354.
doi: />
2354