Phiên bản tiếng Anh của bản báo cáo năng lực cạnh tranh 2010.pdf
Bạn đang xem bản rút gọn của tài liệu. Xem và tải ngay bản đầy đủ của tài liệu tại đây (3.11 MB, 68 trang )
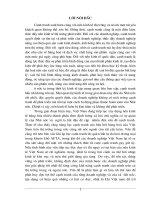
The 2010 Vietnam Competitiveness Report
1
Copyright 2010 @ Professor Michael E. Porter
Vietnam Competitiveness 20101130 – v8 Mon Nov 22 10AM
Professor Michael E. Porter
Harvard Business School
Vietnam Competitiveness Report Launch
Hanoi, Vietnam
November 30, 2010
The Vietnam Competitiveness Report
Objectives
• Provide policy makers and external observers with a data-rich
assessment of Vietnam’s competitiveness, using a comprehensive
internationally-accepted methodology
• Develop an integrated set of policy recommendations, supported by a
transparent logic and data
• Engage decision makers from different constituencies in a dialogue on
the future of Vietnam’s competitiveness
Partners
2
Copyright 2010 @ Professor Michael E. Porter
Vietnam Competitiveness 20101130 – v8 Mon Nov 22 10AM
Objectives
• Provide policy makers and external observers with a data-rich
assessment of Vietnam’s competitiveness, using a comprehensive
internationally-accepted methodology
• Develop an integrated set of policy recommendations, supported by a
transparent logic and data
• Engage decision makers from different constituencies in a dialogue on
the future of Vietnam’s competitiveness
Partners
The 2010 Vietnam Competitiveness Report
• Vietnam’s Economic Position and Development Model
• Assessing Vietnam’s Competitiveness
• A Competitiveness Strategy for Vietnam
3
Copyright 2010 @ Professor Michael E. Porter
Vietnam Competitiveness 20101130 – v8 Mon Nov 22 10AM
• Vietnam’s Economic Position and Development Model
• Assessing Vietnam’s Competitiveness
• A Competitiveness Strategy for Vietnam
Vietnam’s Position in 2010
• Significant growth over the last two decades
• Widespread reduction in poverty
• Resilience in the face of the global economic crisis
4
Copyright 2010 @ Professor Michael E. Porter
Vietnam Competitiveness 20101130 – v8 Mon Nov 22 10AM
$2,000
$2,500
$3,000
$3,500
Vietnam’s Long-Term Prosperity Growth
1975 - 2009
GDP per
Capita,
PPP adjusted
in 1990 US$
CAGR:
+6.15%
CAGR:
+6.15%
CAGR:
+5.00%
CAGR:
+5.00%
CAGR:
+2.47%
CAGR:
+2.47%
5
Copyright 2010 @ Professor Michael E. Porter
Vietnam Competitiveness 20101130 – v8 Mon Nov 22 10AM
$0
$500
$1,000
$1,500
$2,000
1975
1976
1977
1978
1979
1980
1981
1982
1983
1984
1985
1986
1987
1988
1989
1990
1991
1992
1993
1994
1995
1996
1997
1998
1999
2000
2001
2002
2003
2004
2005
2006
2007
2008
2009
1997:
Asian Crisis
Global
Financial
Crisis
1986:
Doi Moi Reform
Source: Groningen Growth and Development Centre and The Conference Board (2010)
Vietnam’s Position in 2010
• Significant growth over the last two decades
• Widespread reduction in poverty
• Resilience in the face of the global economic crisis
BUT
• Still low level of prosperity and productivity
• Growing concerns about the economic sustainability of Vietnam’s
current development model
6
Copyright 2010 @ Professor Michael E. Porter
Vietnam Competitiveness 20101130 – v8 Mon Nov 22 10AM
• Significant growth over the last two decades
• Widespread reduction in poverty
• Resilience in the face of the global economic crisis
BUT
• Still low level of prosperity and productivity
• Growing concerns about the economic sustainability of Vietnam’s
current development model
United States
Hong Kong
Australia
Singapore
Taiwan
Japan
South Korea
New Zealand
$30,000
$35,000
$40,000
$45,000
$50,000
Prosperity Performance
Selected Countries, 1999 to 2009
PPP-adjusted GDP per
Capita, 2009 ($USD)
7
Copyright 2010 @ Professor Michael E. Porter
Vietnam Competitiveness 20101130 – v8 Mon Nov 22 10AM
New Zealand
Malaysia
Thailand
China
Indonesia
Philippines
India
Vietnam
Laos
Cambodia
Bangladesh
$0
$5,000
$10,000
$15,000
$20,000
$25,000
2.0% 4.0% 6.0% 8.0% 10.0% 12.0% 14.0%
Source: EIU (2010), authors calculations
Growth of Real GDP per Capita (PPP-adjusted), CAGR, 2000 to 2009
Vietnam’s Labor Productivity
$25,000
$30,000
$35,000
$40,000
$45,000
South Korea
PPP-adjusted GDP per
Employee, 1990-$USD
8
Copyright 2010 @ Professor Michael E. Porter
Vietnam Competitiveness 20101130 – v8 Mon Nov 22 10AM
Source: Groningen Growth and Development Centre and The Conference Board (2010)
$0
$5,000
$10,000
$15,000
$20,000
1975 1977 1979 1981 1983 1985 1987 1989 1991 1993 1995 1997 1999 2001 2003 2005 2007 2009
Vietnam
China
Thailand
Indonesia
Vietnam’s Current Development Model
• Structural change, fuelled by Vietnam’s integration into the global
economy, has been the key driver of Vietnam’s growth
• Foreign investors have combined capital with Vietnamese labor and imported
inputs to serve global markets, increasingly also domestic demand
9
Copyright 2010 @ Professor Michael E. Porter
Vietnam Competitiveness 20101130 – v8 Mon Nov 22 10AM
Structural Change and Vietnamese Growth
Decomposing Vietnamese Labor Productivity Growth, 2000 - 2008
10
Copyright 2010 @ Professor Michael E. Porter
Vietnam Competitiveness 20101130 – v8 Mon Nov 22 10AM
Source: General Statistics Office, Vietnam; ACI calculations
Drivers of Structural Change: Economic Openness
Thailand
Vietnam
30%
40%
50%
Change in Exports as % of GDP (1989
-
2009)
Openness to Trade
Vietnam
4%
6%
8%
10%
Change in net flows of inward FDI
as % of GDP (1989
-
2009)
Openness to Investment
11
Copyright 2010 @ Professor Michael E. Porter
Vietnam Competitiveness 20101130 – v8 Mon Nov 22 10AM
Source: EIU (2010)
China
India
Indonesia
Malaysia
Myanmar
Philippines
-10%
0%
10%
20%
0% 20% 40% 60% 80% 100%
Change in Exports as % of GDP (1989
-
2009)
Total Exports as % of GDP, 2009
China
India
Indonesia
Malaysia
Philippines
Singapore
Thailand
-6%
-4%
-2%
0%
2%
0% 5% 10%
Change in net flows of inward FDI
as % of GDP (1989
-
2009)
Net flows of inward FDI as % of GDP, 2009
The Growth of the FDI Sector
0%
5%
10%
15%
20%
25%
30%
0
50
100
150
200
250
300
350
400
450
2000 2001 2002 2003 2004 2005 2006 2007
Growth (2000 = 100)
Profits (return on
fixed capital)
Profits
12
Copyright 2010 @ Professor Michael E. Porter
Vietnam Competitiveness 20101130 – v8 Mon Nov 22 10AM
Source: Data from General Statistics Office, Vietnam.
0%
5%
10%
15%
20%
25%
30%
0
50
100
150
200
250
300
350
400
450
2000 2001 2002 2003 2004 2005 2006 2007
# Firms
Workers
Fixed Capital
• Structural change, fuelled by Vietnam’s integration into the global
economy, has been the key driver of Vietnam’s growth
• Foreign investors have combined capital with Vietnamese labor and imported
inputs to serve global markets, increasingly also domestic demand
• Value added and productivity in Vietnam remains low , especially in
manufacturing
• FDI and exports create jobs, but have not raised prosperity levels beyond the
low wages in manufacturing
• There is little evidence of positive spill-overs from FDI to the rest of the
Vietnamese economy in terms of improving productivity and technology
• Vietnam’s attractiveness to investors is almost solely the result of the low
prevailing wages
• In a changing global market environment, this is unlikely to be sufficient for
sustained growth
Vietnam’s Current Development Model
13
Copyright 2010 @ Professor Michael E. Porter
Vietnam Competitiveness 20101130 – v8 Mon Nov 22 10AM
• Structural change, fuelled by Vietnam’s integration into the global
economy, has been the key driver of Vietnam’s growth
• Foreign investors have combined capital with Vietnamese labor and imported
inputs to serve global markets, increasingly also domestic demand
• Value added and productivity in Vietnam remains low , especially in
manufacturing
• FDI and exports create jobs, but have not raised prosperity levels beyond the
low wages in manufacturing
• There is little evidence of positive spill-overs from FDI to the rest of the
Vietnamese economy in terms of improving productivity and technology
• Vietnam’s attractiveness to investors is almost solely the result of the low
prevailing wages
• In a changing global market environment, this is unlikely to be sufficient for
sustained growth
Relative Wages: Selected Countries
$1,810$1,146$830$540$336$167$156$117$82$49$47
0
2000
J
Ave. Monthly Wage (US$)
Ave. Monthly Wage
(January 2010)
$47.36
$48.72
$82.29
$117.15
$156.19
$166.95
$336.04
$540.45
$829.71
$1,146.47
$1,809.91
0
200
400
600
800
1000
1200
1400
1600
1800
2000
Japan
Sinapore
South Korea
Taiwan
Malaysia
Philippines/Metro Manila
Thailand/Bangkok
China/Shenzhen
Indonesia/Jakarta
Vietnam
Cambodia
Avg. monthly wage
(US$)
14
Copyright 2010 @ Professor Michael E. Porter
Vietnam Competitiveness 20101130 – v8 Mon Nov 22 10AM
Source: Philippines Department of Labor and Employment (2010)
$1,810$1,146$830$540$336$167$156$117$82$49$47
0
2000
J
Ave. Monthly Wage (US$)
Ave. Monthly Wage
(January 2010)
$47.36
$48.72
$82.29
$117.15
$156.19
$166.95
$336.04
$540.45
$829.71
$1,146.47
$1,809.91
0
200
400
600
800
1000
1200
1400
1600
1800
2000
Japan
Sinapore
South Korea
Taiwan
Malaysia
Philippines/Metro Manila
Thailand/Bangkok
China/Shenzhen
Indonesia/Jakarta
Vietnam
Cambodia
Vietnam’s Exports By Type of Industry
0.0%
0.1%
0.2%
0.3%
0.4%
0.5%
0.6%
0.7%
0.8%
1997 1998 1999 2000 2001 2002 2003 2004 2005 2006 2007 2008 2009
Processed Goods
Semi-processed Goods
Unprocessed Goods
Services
TOTAL
World Export Market
Share (current USD)
15
Copyright 2010 @ Professor Michael E. Porter
Vietnam Competitiveness 20101130 – v8 Mon Nov 22 10AM
0.0%
0.1%
0.2%
0.3%
0.4%
0.5%
0.6%
0.7%
0.8%
1997 1998 1999 2000 2001 2002 2003 2004 2005 2006 2007 2008 2009
Processed Goods
Semi-processed Goods
Unprocessed Goods
Services
TOTAL
Source: UNComTrade, WTO (2010)
Vietnam’s Cluster Export Portfolio
1997 - 2009
Apparel
Footwear (4.67%, 8.21% )
Fishing and Fishing Products
Coal and Briquettes
2.5%
3.0%
3.5%
4.0%
4.5%
5.0%
Vietnam’s world export market share, 2009
Change In Vietnam’s average
world export share: 0.275%
16
Copyright 2010 @ Professor Michael E. Porter
Vietnam Competitiveness 20101130 – v8 Mon Nov 22 10AM
Exports of US $2 Billion =
Oil and
Gas
Agricultural Products
Furniture
Communications Equipment
Entertainment and
Reproduction Equipment
Jewelry, Precious Metals and
Collectibles
Textiles
Plastics
Building Fixtures
and Equipment
Motor Driven Products
Leather and Related Products
Metals and Mining
Information Technology
Construction Materials
Lighting and
Electrical
0.0%
0.5%
1.0%
1.5%
2.0%
2.5%
0.0% 0.5% 1.0% 1.5% 2.0% 2.5% 3.0%
Source: Prof. Michael E. Porter, International Cluster Competitiveness Project, Institute for Strategy and Competitiveness, Harvard Business
School; Richard Bryden, Project Director. Underlying data drawn from the UN Commodity Trade Statistics Database and the IMF BOP statistics.
Change in Vietnam’s world export market share, 1997 – 2009
Vietnam’s world export market share, 2009
Vietnam’s average world
export share: 0.416%
Furniture
Building
Fixtures,
Equipment &
Services
Fishing &
Fishing
Products
Hospitality
& Tourism
Agricultural
Products
Transportation
& Logistics
Share of World Exports by Cluster
Vietnam, 2008
Power
Generation
Aerospace
Vehicles &
Defense
Lightning &
Electrical
Equipment
Information
Tech.
Business
Services
Distribution
Services
Forest
Products
Heavy
Construction
Services
Construction
Materials
Prefabricated
Enclosures
Jewelry &
Precious
Metals
Textiles
Processed
Food
Medical
Devices
Analytical
Instruments
Education &
Knowledge
Creation
0.5% - 1.5%
1.5% - 5%
5% - 10%
Enter-
tainment
World Market Share
17
Copyright 2010 @ Professor Michael E. Porter
Vietnam Competitiveness 20101130 – v8 Mon Nov 22 10AM
Plastics
Oil &
Gas
Chemical
Products
Biopharma-
ceuticals
Power
Generation
Financial
Services
Publishing
& Printing
Communi-
cations
Equipment
Business
Services
Forest
Products
Apparel
Leather &
Related
Products
Footwear
Tobacco
Medical
Devices
Education &
Knowledge
Creation
Note: Clusters with overlapping borders have at least 20% overlap (by number of industries) in both directions.
Marine
Equipment
Aerospace
Engines
Heavy
Machinery
Sporting
& Recreation
Goods
Automotive
Production
Technology
Motor Driven
Products
Mining & Metal
Manufacturing
• Disruptions that could limit
demand
– Rising protectionism
– Overheating in China; sluggish
growth elsewhere
– Climate change
• Competition that could reduce
Vietnams attractiveness
– From other low-wage locations
– From within the increasingly
open ASEAN region
• New opportunities as a means to
serve new demand
– Emergence of Asia
– Increasing market of
consumers with similar needs
as in Vietnam
• New opportunities as a supply
base
– Cost pressure on global
companies
– China + 1 strategy of MNCs
The External Environment in 2010
Opportunities Threats
18
Copyright 2010 @ Professor Michael E. Porter
Vietnam Competitiveness 20101130 – v8 Mon Nov 22 10AM
• Disruptions that could limit
demand
– Rising protectionism
– Overheating in China; sluggish
growth elsewhere
– Climate change
• Competition that could reduce
Vietnams attractiveness
– From other low-wage locations
– From within the increasingly
open ASEAN region
• New opportunities as a means to
serve new demand
– Emergence of Asia
– Increasing market of
consumers with similar needs
as in Vietnam
• New opportunities as a supply
base
– Cost pressure on global
companies
– China + 1 strategy of MNCs
Vietnam’s Current Development Model
Emerging Weaknesses
• Low sophistication in the export sector coupled with strong domestic demand
drive growing trade deficit
19
Copyright 2010 @ Professor Michael E. Porter
Vietnam Competitiveness 20101130 – v8 Mon Nov 22 10AM
-50
0
50
2
% change in CPI
Vietnam’s Balance of Trade
1995 – 2008
-20,000
-10,000
0
10,000
20,000
30,000
40,000
50,000
60,000
70,000
80,000
1995 1996 1997 1998 1999 2000 2001 2002 2003 2004 2005 2006 2007 Prel.
2008
US$M
20
Copyright 2010 @ Professor Michael E. Porter
Vietnam Competitiveness 20101130 – v8 Mon Nov 22 10AM
-50
0
50
2
% change in CPI
-20,000
-10,000
0
10,000
20,000
30,000
40,000
50,000
60,000
70,000
80,000
1995 1996 1997 1998 1999 2000 2001 2002 2003 2004 2005 2006 2007 Prel.
2008
Source: Data from General Statistics Office, Vietnam.
Vietnam’s Current Development Model
Emerging Weaknesses
• Low sophistication in the export sector coupled with strong domestic demand
drive growing trade deficit
• Real appreciation of the Dong further contributes to the deficit
21
Copyright 2010 @ Professor Michael E. Porter
Vietnam Competitiveness 20101130 – v8 Mon Nov 22 10AM
Vietnam’s Currency Valuation
80
90
100
110
120
130
140
150
160
2000 2001 2002 2003 2004 2005 2006 2007 2008 2009
Index (2000 = 100)
CPI VN/CPI USA
Exchange
Rate Index
VN
22
Copyright 2010 @ Professor Michael E. Porter
Vietnam Competitiveness 20101130 – v8 Mon Nov 22 10AM
Source: 2000-2008 data – WDI; 2009 data – EIU
80
90
100
110
120
130
140
150
160
2000 2001 2002 2003 2004 2005 2006 2007 2008 2009
Vietnam’s Current Development Model
Emerging Weaknesses
• Low sophistication in the export sector coupled with strong domestic demand
drive growing trade deficit
• Real appreciation of the Dong further contributes to the deficit
• Significant capital inflows fuel domestic demand growth and inflation
• Expansionary fiscal and monetary policies worsen inflation, rather than
control it
23
Copyright 2010 @ Professor Michael E. Porter
Vietnam Competitiveness 20101130 – v8 Mon Nov 22 10AM
• Low sophistication in the export sector coupled with strong domestic demand
drive growing trade deficit
• Real appreciation of the Dong further contributes to the deficit
• Significant capital inflows fuel domestic demand growth and inflation
• Expansionary fiscal and monetary policies worsen inflation, rather than
control it
Rate of Inflation
Selected Countries, 2000 - 2009
-50
0
50
2
% change in CPI
-5%
0%
5%
10%
15%
20%
25%
2000 2001 2002 2003 2004 2005 2006 2007 2008 2009
Vietnam
Indonesia
Malaysia
China
Thailand
% change in CPI
24
Copyright 2010 @ Professor Michael E. Porter
Vietnam Competitiveness 20101130 – v8 Mon Nov 22 10AM
Source: EIU 2010
-50
0
50
2
% change in CPI
-5%
0%
5%
10%
15%
20%
25%
2000 2001 2002 2003 2004 2005 2006 2007 2008 2009
Vietnam
Indonesia
Malaysia
China
Thailand
Vietnam’s Current Development Model
Emerging Weaknesses
• Low sophistication in the export sector coupled with strong domestic demand
drive growing trade deficit
• Real appreciation of the Dong further contributes to the deficit
• Significant capital inflows fuel domestic demand growth and inflation
• Expansionary fiscal and monetary policies worsen inflation, rather than
control it
• Falling ratio of GDP growth to investment increases the need for capital
inflows to maintain the growth rate
• Demand growth is outstripping the existing microeconomic capacity in terms of
skills and infrastructure
25
Copyright 2010 @ Professor Michael E. Porter
Vietnam Competitiveness 20101130 – v8 Mon Nov 22 10AM
• Low sophistication in the export sector coupled with strong domestic demand
drive growing trade deficit
• Real appreciation of the Dong further contributes to the deficit
• Significant capital inflows fuel domestic demand growth and inflation
• Expansionary fiscal and monetary policies worsen inflation, rather than
control it
• Falling ratio of GDP growth to investment increases the need for capital
inflows to maintain the growth rate
• Demand growth is outstripping the existing microeconomic capacity in terms of
skills and infrastructure