Summary of PhD thesis: Investors’ reaction to the stock trading announcement of internal shareholders, stakeholders and major foreign holders evidence from Vietnam stock market
Bạn đang xem bản rút gọn của tài liệu. Xem và tải ngay bản đầy đủ của tài liệu tại đây (560.16 KB, 35 trang )
3
CHAPTER 1 INTRODUCTION
1.1. Reason for the topic selection
Two in the objects with special advantages in information are internal shareholders and
stakeholders. Thus, in order to create the equity and limit the asymmetric information between
internal shareholders, stakeholders and other shareholders in trading stocks, according to
regulations of current laws, all stock trading of the majority shareholders, internal shareholders and
stakeholders must announce information before trading1.
In addition to the internal shareholders, the stakeholders are considered to have advantage in
information no less than the internal shareholders. In the context of incomplete law system and
specific cultural factors as in Vietnam, it is possible to exclude that the information on businesses is
transmitted by the internal shareholders to the stakeholders. Therefore, the transaction of the
internal shareholders and stakeholders can cause the extraordinary changes in price and trading
volume.
However, through researching the previous studies, there have not been the study on the
internal shareholders’ impacts on price and trading volume in Vietnam stock market. This is a blank
not only in the practical demand but also in the academy to be considered.
Other object that the thesis aims is transaction of the foreign investors. There are many studies
on the foreign investors in Vietnam as the studies of Vo Xuan Vinh (2014), Batten & Vo (2015), Vo
Xuan Vinh (2016) , Vo Xuan Vinh & Dang Buu Kiem (2016d), etc. However, there have not been
the study which analyzes the impacts of information that the foreign investors become majority
shareholders or no longer majority shareholders.
1.2. Thesis’s targets
Specifically, the thesis studies the following contents:
Firstly, the thesis analyzes the Investors’ reaction based on stock price and trading volume to
the stock trading announcement of internal shareholders.
Secondly, the thesis analyzes the Investors’ reaction based on stock price and trading
volume to the stock trading announcement of stakeholders.
Thirdly, the thesis analyzes the Investors’ reaction based on stock price and trading volume
to the impact of information that the foreign investors become majority shareholders or no longer
majority shareholders.
1.3. Questions
• How does the stock price fluctuate to the stock trading announcement of internal
shareholders?
• How does the trading volume fluctuate to the stock trading announcement of internal
shareholders?
• How does the stock price fluctuate to the stock trading announcement of stakeholders?
• How does the trading volume fluctuate to the stock trading announcement of stakeholders?
1According to Circular No. 155/2015/TTBTC on 06 October 2015 guiding to announce information in the
stock market, the internal people are the internal shareholders.
4
• How does the stock price fluctuate when information that the foreign investors become
majority shareholders or no longer majority shareholders is announced?
• How does the trading volume fluctuate when information that the foreign investors become
majority shareholders or no longer majority shareholders is announced?
1.4. Object
The thesis examines the Investors’ reaction to the stock trading announcement of internal
shareholders, stakeholders and major shareholders being foreign investors.
1.5. Study’s scope
The study includes the announcements of stock transaction registration of internal
shareholders, stakeholders; and foreign investors from companies listed on Ho Chi Minh City Stock
Exchange over the period from 2008 to 2015.
1.6. Implementation order
In order to implement this study, the thesis is executed according to the following order:
Firstly:
Examine summarily the previous studies to find out slits in the studies applied for
Vietnam’s context.
Secondly Identify the topic, object, targets and study’s scope.
:
Thirdly: Examine summarily the theories, systematize and summarize the previous studies
related to the topic.
Fourthly: From the previous studies, select the suitable estimation method for the topic.
Fifth:
Collect the essential data for the study.
Sixth:
Implement the necessary tests to analyze and discuss the results achieved of the
thesis.
Seventh: Conclude the results achieved and propose some policy implications for the related
objects.
1.7. Thesis’s structure
The thesis includes 7 chapters
5
CHAPTER 2 THEORETICAL BASIS AND STUDY OVERVIEW
2.1. Some terms in the thesis
The terms of internal shareholder and stakeholder in this these are defined according to
Circular No. 155/2015/TTBTC on 06 October 2015, specifically, the contents are quoted as
follows: Internal shareholders, stakeholders, majority shareholders, date of information
announcement, information of stock transaction registration, internal information, abnormal return,
abnormal volume.
2.2. Introduction to the stock market in Vietnam
The stock market is not only a channel of medium and long term capital mobilization but
also an import channel in managing the macroeconomic policies in many countries around the
world. In Vietnam, the stock market was officially formed on 11 July 1998 according to Decree No.
48/CP on Stock and Stock market, on the same day, the Prime Minister signed Decision No.
127/1998/QĐTTg to establish Ho Chi Minh City Securities Trading Center.
2.3. Legal regulations on information announcement
2.3.1. Legal documents stipulating information announcement
The information announcement is institutionalized by legal documents, when taking part in
listing on the stock exchanges, the companies must comply with information announcement.
The information announcement is stipulated specifically in Stock laws and specificized by
Circulars as Circular No. 38/2007/TTBTC on 18/4/2007, Circular No. 09/2010/TTBTC on
15/01/2010, Circular No. 52/2012/TTBTC on 05/04/2012, and most recently, Circular No.
155/2015/TTBTC on 06/10/2015. The related information announcement is stipulated specifically
as follows (2):
2.3.2. Information announcement
The objects are announced according to Circular No. 155/2015/TTBTC on 06/10/2015
2.3.3. Means of information announcement
As according to Circular No.155/2015/TTBTC on 06/10/2015
2.3.4. Time of information announcement with internal shareholders and stakeholders
According to Circular No.155/2015/TTBTC on 06/10/2015.
2.4. Investors’ reaction based on stock price and trading volume to the announced
information
2.4.1. Investors’ reaction based on stock price to the announced information
The semistrong efficient market hypothesis is applied in this thesis to explain the investors’
reaction to the stock trading announcement of shareholders and investors, with implication that the
stock price will automatically be adjusted to update the announced information. The Abnormal
Return is defined by Brown & Warner (1980) as the difference between actual return and expected
return of this stock. Definition of abnormal return turns around the date of information
announcement to make basis for concluding the efficiency of the market.
2According to Circular No. 155/2015/TTBTC on 06 October 2015 guiding to announce information in the stock
market, the internal people are internal shareholders.
6
2.4.2. Investors’ reaction based on trading volume to the announced information
In the market, there are always other transactions created by the buyers and the sellers. The
basis for the investors’ behaviors leading to transactions which create the different positions is
explained by Karpoff (1986) through theory of trading volume. This theory mentions 2 main factors
creating all transactions: Firstly, Karpoff (1986) thinks that before one problem or event, the
investors have the most suitable way to analyze and explain for themselves and have difference
between investors. Thus, they create the different transactions. Secondly, in spite of explaining the
same problem, each investors have the different expectation and desire, thus, they have different
transaction behaviors. Simultaneously, if the both factors exist, the transactions in the market
become more ebullient.
2.5. Theoretical basis of Investors’ reaction based on stock price and trading volume to the
stock trading information of the internal shareholders, stakeholders, and foreign
investors.
2.5.1. Theory of asymmetric information
The theory used in this thesis is theory of asymmetric information, this theory is developed by
Akerlof (1970) with the famous article on asymmetric information between related parties in the old
automobile market, which is posted in The quarterly journal of economics.
In this thesis, the asymmetric information is applied to explain the investors’ behaviors as
follows: i) It is possible that the investors are the internal shareholders or stakeholders trading stock
based on information that they hold; ii) The outside investors do not have much information, they
think that the contents of transaction registration of the internal shareholders and stakeholders have
information and the outside investors imitate.
Based on the theory of asymmetric information, that the stock trading of the internal
shareholders, stakeholders and transactions of the foreign investors to become or no longer majority
shareholders, makes the investors in the market doubt of these transactions having unannounced
information. Therefore, the investors in the market can implement the transactions similar to the
ones of the internal shareholders, stakeholders and foreign investors to reduce risks and look for
return. This is the reason for creating changes in stock price and trading volume.
2.5.2. Signaling theory
The Signaling theory believes that the behaviors and decisions of the internal shareholders,
stakeholders and foreign investors being majority shareholders can contain the sign for other
shareholders and implies the information that others do not have. The Signaling theory shows that
when the internal shareholders or stakeholders register stock transaction, that can lead to the
changes in stock price and trading volume in the market.
For the transactions of the foreign investors, every transaction contains the signs about the
different expectations on the company. On the contrary, when the foreign investors want to reduce
the stock holding rate to be no longer majority shareholders, the management policies as well as
transparency can change, thus, the company’s performance decreases.
2.5.3. Efficient market hypothesis
The investors’ reaction when the company announces information is explained by the
Efficient market hypothesis of Farma (1970). This hypothesis believes that a market is considered to
7
be efficient if the stock price reflects all information about this stock. Therefore, an investors can’t
earn the abnormal return (Pindyck & Rubinfeld 2009) from stock transaction in the market.
Although the Efficient market hypothesis is applied widely in the financial theories, some
studies state that the market is nonefficient. (Aharony & Swary 1980; Asquith & Mullins Jr 1983;
Bajaj & Vijh 1995; Bernheim & Wantz 1992; Charest 1978; Dyl & Weigand 1998; Grinblatt et al.
1984; Lie 2005; Woolridge 1982). These studies prove the existence of the abnormal return before
and after the date of information announcement.
2.6. Overview of previous studies
According to statistic data of (Kothari & Warner 2005) from 1974 to 2000, there were 565
studies posted in the prestigious magazines in the world. Some typical studies:
2.6.1. The studies related to information of dividend payment
Studies of Pettit (1972), Charest (1978), Aharony & Swary (1980), Woolridge (1982), Asquith &
Mullins Jr (1983), Grinblatt et al. (1984), Wansley et al. (1991), Gurgul et al. (2003), Fuller (2003),
Lee & Yan (2003), McCluskey et al. (2006), Dasilas & Leventis (2011), Chen et al. (2014), Vo
Xuan Vinh & Doan Thi Minh Thai (2015), Nguyen Thi Minh Hue (2015)…
2.6.2. Some previous studies related to stock dividend announcement
Some typical studies: (Copeland 1979; Han 1995; Ball & Brown 1968; Chen et al. 2011; Chou
et al. 2005; Desai & Jain 1997; Doran 1994; Dyckman et al. 1984; Elfakhani & Lung 2003;
Grinblatt et al. 1984; Kunz & Rosa‐Majhensek 2008; Lamoureux & Poon 1987, Vo Xuan Vinh &
Phan Thi Anh Thu 2014).
2.6.3. Some previous studies related to information of buying stocks back
Some typical studies: Chua (2010); Yook (2010), Wu (2012), Reddy et al. (2013), Hillert et al.
(2016), Vo Xuan Vinh & Trinh Tan Luc (2015).
2.6.4. Information of releasing the Financial statements of the Enterprise
Ball & Brown (1968), Hew et al. (1996), Liu et al. (2003), Schadewitz et al. (2005), Vo Xuan
Vinh & Le Thi Kim Phuong (2014), many studies examined the investors’ reaction based on stock
price when the Adjusted Auditing Report is publicized, example, some first studies implemented in
United Kingdom, the United States and Australia: (Baskin 1972; Dodd et al. 1984; Dopuch et al.
1986; Firth 1978; Herbohn et al. 2007; Hsu et al. 2011; Ianniello & Galloppo 2015; Pei & Hamill
2013); in Vietnam, there was study of Tran Thi Giang Tan & Lam Vu Phi (2017).
2.6.5. Besides, some other studies turn around the events related to stock market
Vo Xuan Vinh & Le Thi Kim Phuong (2014), Vo Xuan Vinh & Trinh Tan Luc (2015), Vo
Xuan Vinh & Dang Buu Kiem (2016d).
8
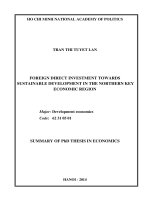
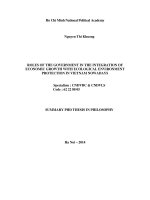
2.7. Study slits
Dividend payment
(Bajaj & Vijh 1995;
Chen et al. 2014; Lee &
Yan 2003; Võ Xuân
Vinh & Đặng Bửu Kiếm
2016a; Võ Xuân Vinh &
Đoàn Thị Minh Thái
2015)
MARKET’S
REACTION
Additional stock issue
(Hồ Viết Tiến & Đinh
Thị Thu Hà 2012, 2014;
Lerskullawat
2011;
Marisetty et al. 2008;
Salamudin et al. 1999;
Tan et al. 2002; Xia et al.
2010)
Rebuying stocks
(Chua 2010b; Hillert et
al. 2016; Reddy et al.
2013; Võ Xuân Vinh &
Trịnh Tấn Lực 2015a,
2015b; Wu 2012; Yook
2010)
TO
–
FINANCIAL
EVENTS
Release the Adjusted
Financial statements
(Dopuch et al. 1986; Herbohn et
al. 2007; Hsu et al. 2011;
Ianniello & Galloppo 2015; Pei
& Hamill 2013; Tr ần Thị Giang
Tân & Lâm Vũ Phi 2017b; Võ
Xuân Vinh & Đặng Bửu Kiếm
2016c)
ECONOMIC
Events related to market
(Võ Xuân Vinh & Đặng Bửu
Kiếm 2014, 2016b, 2016d; Võ
Xuân Vinh & Lê Thị Kim
Phượng 2014)
Academic slits needs studying
Internal shareholders’
transaction
Dividend distribution
(Ball & Brown 1968; Chen et al.
2011; Chou et al. 2005; Desai &
Jain 1997; Elfakhani & Lung
2003; Kunz & Rosa‐Majhensek
2008; Lamoureux & Poon 1987)
Stakeholder’
transaction
Figure 2.4 Document map
Major foreign holders
(become majority shareholders
or no longer majority
shareholders)
9
2.8. Thesis’s Study Hypothesis
Firstly, the study hypothesis relates to the impacts of stock transaction registration of the
internal shareholders on price and trading volume:
Hypothesis 1a: The stock price increases due to buying transaction registration of the internal
shareholders.
Hypothesis 1b: The stock price decreases due to selling transaction registration of the internal
shareholders.
Hypothesis 2a: The trading volume increases due to the stock buying registration announcement
of the internal shareholders.
Hypothesis 2b: The trading volume increases due to stock selling registration announcement of
the internal shareholders.
Secondly, the study hypothesis relates to the impacts of stock transaction registration of the
stakeholders.
Hypothesis 3a: The stock price increases due to stock buying registration of the stakeholders.
Hypothesis 3b: The stock price decreases due to stock selling registration of the stakeholders
Hypothesis 4a: The trading volume increases due to the stock buying registration announcement
of the stakeholders.
Hypothesis 4b: The trading volume increases due to the stock selling registration announcement
of the stakeholders.
Thirdly, the study hypothesis relates to transactions of the majority shareholders being foreign
investors.
Hypothesis 5a: The stock price increases when the information that the foreign investors become
the majority shareholders is announced.
Hypothesis 5b: The stock price decreases when the information that the foreign investors are no
longer majority shareholders is announced.
Hypothesis 6a: The trading volume increases when the foreign investors become the majority
shareholders.
Hypothesis 6b: The stock price increases when the foreign investors are no longer majority
shareholders.
10
CHAPTER 3 STUDY METHODOLOGY AND STUDY DATA
3.1. Study Methodology
3.1.1. Introduction to Event Study
According to MacKinlay (1997), the Event study is implemented through the following steps:
Select the event to study;
Select the company sample;
Select time for event window, estimate window and window after event;
Measurement of investors’ reaction is shown through price (through abnormal return) and/or
stock volume (through Abnormal trading volume);
Test.
3.1.2. Describe in detail the steps according to event study in the thesis.
3.1.2.1. The events are studied in the thesis
The events selected to implement in the thesis include:
The announcement of stock buying registration of the internal shareholders;
The announcement of stock selling registration of the internal shareholders;
The announcement of stock buying registration of the stakeholders;
The announcement of stock selling registration of the stakeholders;
The announcement that foreign investors become majority shareholders;
The announcement that foreign investors become no longer majority shareholders;
3.1.2.2. Event day, event window, estimate window and window after event
Event day
Equivalent to each event selected to study, the event day is the date the information on
events is announced on website of Ho Chi Minh City Stock Exchange.
Event window, estimate window and window after event
Three windows in the event framework used to study include: i) Event window is selected
to be 31 days, from 15th date (before the date of announcement 15 days) to +15th date (after the
date of announcement 15 days) including 0 date (the event day), ii) Estimate window is 120 days
from 16th date to 135th date, iii) Window after event is from +16th date to +30 date, 15 days in
total.
3.1.2.3. Measurement of investors’ reaction is shown through the stock price
Measurement of investors’ reaction is shown through the stock price and considered through
the existence of cumulative normal return and abnormal return.
Abnormal return (ARi,t)
According to Brown & Warner (1980), the abnormal return is the difference between actual
return and expected return of the stock. In this study, AR is calculated as follows:
AR i,t = R i,t – E (Ri,t)
Method 1
The expected return is adjusted by the market’s return(Rm,t)
E (Ri,t) = Rm,t
Method 2
E (Ri,t) = α i,t + β i,t R m,t
Average Abnormal Return (AARt)
11
Cumulative Average Abnormal Return CAAR (t1, t2)
3.1.2.4. Measurement of investors’ reaction is shown through the trading volume
AVi,t = log () – E [log ()|Xi]
3.1.2.5.Test methods
Parametric tests
Test abnormal return:
ttest on date t is calculated as follows:
Test cumulative average abnormal return
Nonparametric test
3.2. Data serving the study
Data in this thesis is selected from companies listed on Ho Chi Minh City Stock Exchange
over the period from 2008 to 2015.
Table 3.1. Event description statistics are studied in the thesis
Year
Stakeh
olders
being
organi
zations
buying
2008
2009
2010
2011
2012
2013
2014
2015
Tota
l
24
30
38
23
23
37
50
24
249
Stakeh
Intern Foreig
olders
al
n
being
shareh investo
individ
olders
rs
uals
sellin
buying
selling
g
32
11
25
56
27
82
54
36
131
27
34
81
21
32
110
56
29
119
80
40
185
33
22
37
359
231
(Source: Summary of PhD student)
770
Total
buying
selling
buying
selling
14
50
84
189
169
134
135
78
25
147
187
121
139
196
250
71
1
4
7
11
16
35
34
28
3
5
28
29
10
1
2
4
135
401
565
515
520
607
776
297
853
1,136
136
82
3,816
12
CHAPTER 4: INVESTORS’ REACTION TO THE STOCK TRANSACTION
REGISTRATION ANNOUNCEMENT OF INTERNAL SHAREHOLDERS
4.1. The Investors’ reaction based on stock price and trading volume to the stock buying
registration announcement of internal shareholders
The left results in Table 4.1 prove the existence of the abnormal return on the date of
information announcement and two days later. Thus, the information implicated in the stock buying
registration announcement of internal shareholders is good for the market, shown through that the
market has positive response with this information, the stock price ends the downtrend and starts to
increase since the date of stock buying registration announcement of internal shareholders. The
stock price constantly decreases before the date of information announcement, that shows the
internal shareholders’ behavior of buying stocks is an important strategy to stop the down impetus
of stocks in the market. Additionally, the market does not react to all information implicated on the
date of announcement but continues to react on the following days, which shows that the stock
market in Vietnam is not efficient in the semistrong form of the Efficient market hypothesis.
The investors’ reaction based on the abnormal trading volume to the stock buying
registration announcement of the internal shareholders is shown at the right of Table 4.1. The results
show that the trading volume increases on the date of announcement and the reaction of the stock
price on the date of announcement, they indicate that the market has position reaction to the
information of buying stocks of the internal shareholders through the increase in liquidity along
with increase in stock price.
Table 4.1: Test results of abnormal return and abnormal trading volume to the stock buying
registration announcement of the internal shareholders
T
Abnorm
al
return
AAR1
0,20%
0,22%
0,01%
0,17%
0,08%
0,61%
0,38%
0,19%
0,07%
0,01%
0,16%
Abnormal trading volume
T stat
2.12**
2.41**
0.06
1.86*
0.89
6.53***
4.12***
2.08**
0.79
0.11
1.69*
Zvalue
1.25
2.35**
0.40
0.91
0.40
5.41***
3.97***
2.25**
1.63
0.15
1.43
AAV
0.00
0.03
0.04
0.06
0.11
0.24
0.15
0.13
0.20
0.18
0.08
5
4
3
2
1
0
1
2
3
4
5
Framewor
CAAR
T stat
Zvalue
MAAV
k
[15;1]
1,39%
3.57***
2.97***
0.00
[0;15]
1,57%
4.51***
3.63***
0.15
[0;30]
1,61%
3.5***
2.73***
0.08
[15;15]
0,17%
0.33
0.81
0.08
***; **; * with the respective meaning level at 1%; 5%; 10%.
(Source: The PhD student calculates and summarizes).
T stat
0.10
0.69
0.72
1.23
2.13**
4.83***
2.95***
2.68***
4.05***
3.54***
1.52
T stat
0.07
4.04***
2.11**
2.57**
13
4.2. The Investors’ reaction based on stock price and trading volume to the stock selling
registration announcement of the internal shareholders with the different selling rate
Results in Table 4.2 implicate that the information of stock buying of the internal
shareholders, even low, prevents the decline in stock price and brings positive sign to the market.
The trading volume and stock liquidity are improved significantly before, on and after the event
day.
Table 4.2: Test results of abnormal return and abnormal trading volume to the stock selling
registration announcement of the internal shareholders with small sale ratio.
Abnorma
l return
AAR1
T
Abnormal trading volume
T stat
Zvalue
AAV
T stat
5
0,23%
2**
2.03**
0.07
1.18
4
0,20%
1.75*
1.15
0.02
0.34
3
0,04%
0.35
0.18
0.00
0.01
2
0,30%
2.6***
1.06
0.09
1.59
1
0,21%
1.83*
0.77
0.12
2.08**
0
0,12%
1.08
1.27
0.11
2.01**
1
0,31%
2.72***
2.63***
0.08
1.33
2
0,03%
0.22
0.18
0.16
2.8***
3
0,02%
0.18
1.66*
0.13
2.34**
4
0,16%
1.35
0.88
0.04
0.64
5
0,25%
2.15**
1.08
0.05
0.79
Framewor
k
CAAR
T stat
Zvalue
MAAV
T stat
[15;1]
1,86% 4.03***
4.86***
0.03
0.75
[0;15]
1,38%
3.08***
1.25
0.07
1.46
[0;30]
1,33%
2.23**
0.67
0.00
0.10
[15;15]
0,49%
0.80
1.95*
0.02
0.52
***; **; * with the respective meaning level at 1%; 5%; 10%.
(Source: The PhD student calculates and summarizes).
Table 4.3 indicates the test result of the market’s reaction to the stock buying registration
announcement of the internal shareholders in case of big sale ratio. The result shows that the event
of big sale ratio of the internal shareholders have significant and positive impacts on price and
trading volume. This result further supports the theory of the asymmetric information and the
signaling theory,
Table 4.3: Test results of abnormal return and abnormal trading volume to the stock buying
registration announcement of the internal shareholders with big sale ratio.
T
5
4
3
Abnorma
l return
AAR1
0,15%
0,21%
0,02%
Abnormal trading volume
T stat
1.10
1.54
0.13
Zvalue
0.07
1.77*
0.36
AAV
0.08
0.03
0.06
T stat
1.16
0.45
0.93
14
T
Abnorma
l return
AAR1
0,05%
0,02%
1,07%
0,47%
0,36%
0,15%
0,22%
0,09%
Abnormal trading volume
T stat
0.38
0.12
7.92***
3.48***
2.67***
1.14
1.60
0.65
Zvalue
0.12
1.04
6.09***
3.08***
3.37***
0.65
0.90
1.14
AAV
0.02
0.09
0.37
0.21
0.11
0.27
0.33
0.08
T stat
0.25
1.32
5.32***
3.1***
1.55
3.96***
4.72***
1.15
2
1
0
1
2
3
4
5
Framewor
k
CAAR
T stat
Zvalue
MAAV
T stat
[15;1]
1,02%
1.65*
2.01**
0.03
0.71
[0;15]
1,77%
3.35***
1.58
0.23
4.01***
[0;30]
1,89%
2.67***
0.70
0.18
3.02***
[15;15]
0,75%
0.88
0.41
0.14
2.88**
***; **; * with the respective meaning level at 1%; 5%; 10%.
(Source: The PhD student calculates and summarizes).
Thus, the above results show that the market has reaction to the information of buying
stocks of the internal shareholders, even small and big sale ratio. However, the market has stronger
and clearer reaction in case of big sale ratio. These results further support the theory of the
asymmetric information and the signaling theory.
4.3. The market’s reaction based on stock price and trading volume to the stock selling
registration announcement of the internal shareholders
The results in Table 4.4 indicate that the stock price constantly increases before the internal
shareholders register to sell stocks. This implicates that the internal shareholders choose the time
when the stock price in the market increase to register to sell. The above identification is
strengthened when the cumulative abnormal return before the announcement is positive with high
rate and has statistic meaning at 1% (CAAR [15;1]:4.47%).
On the date of information announcement, the abnormal return is negative and continues to
maintain on the following days. This leads to the fact that the cumulative abnormal return after the
announcement has negative values (CAAR [0;15]: 1.1%; CAAR [0;30]: 1,73%) and has statistic
meaning at 1%.
From above results, the information implicated in the stock selling registration
announcement of the internal shareholders is a bad sign.
Table 4.4: Test results of abnormal return and abnormal trading volume to the stock selling
registration announcement of the internal shareholders
t
5
4
Abnor
mal
return
AAR1
0,42%
0,44%
Abnormal trading volume
T stat
5.45***
5.68***
Zvalue
2.98***
2.8***
AAV
0.22
0.22
T stat
3.43***
3.4***
15
t
Abnor
mal
return
AAR1
0,57%
0,56%
0,38%
0,04%
0,15%
0,08%
0,12%
0,07%
0,07%
Abnormal trading volume
T stat
7.36***
7.31***
4.9***
0.57
2**
1.07
1.54
0.84
0.96
Zvalue
4.88***
2.39**
3.46***
0.58
1.71*
2**
1.35
2.24**
2.6***
AAV
0.26
0.33
0.31
0.25
0.26
0.25
0.32
0.30
0.30
T stat
4.16***
5.24***
4.91***
4***
4.05***
3.89***
4.97***
4.74***
4.72***
3
2
1
0
1
2
3
4
5
Framewor
k
CAAR
T stat
Zvalue
MAAV
T stat
[15;1]
4,47%
11.16***
7.29***
0.16
5.90***
[0;15]
1,10%
3.41***
4.82***
0.21
6.73***
[0;30]
1,73%
3.88***
4.94***
0.15
4.92***
[15;15]
3,37%
6.52***
4.5***
0.19
6.85***
***; **; * with the respective meaning level at 1%; 5%; 10%.
(Source: The PhD student calculates and summarizes).
The right of Table 4.4 shows the market’s reaction based on the trading volume. The results
show that the trading volume constantly increase before the date of announcement, the abnormal
trading volume is positive with statistic meaning at 1% from [5] date to [1] date. On the date of
announcement, the trading volume increase sharply, after the announcement, the trading volume
decreases but continues to increase significantly on the following days, especially on [3], [4] and [5]
dates, the abnormal trading volume is so great (AAV [3]: 0.32; AAV [4]: 0.30 and AAV [5]: 0.30
with the respective meaning level at 1%). The results show that a large number of stocks transacted
before, on and after the stock selling registration announcement of the internal shareholders is
announced.
It is possible to conclude that the information implicated in the stock selling registration
announcement of the internal shareholders is bad information. Simultaneously, there is phenomena
that the investors in the market imitate the internal shareholders to implement transactions. Because
of the asymmetric information, the selling registration of the internal shareholders creates the sign
for the remaining investors in the market that the stock price is higher than the true value or the
company has bad information about expectations of the company.
4.4. The Investors’ reaction based on stock price and trading volume to the stock selling
registration announcement of the internal shareholders with the different sale ratio.
The results in Table 4.5 and Table 4.6 show that the investors’ reaction to the registration
announcement of small and big sale ratio of the internal shareholders have the same. The stock
price increases and exits the positive abnormal return before the date of information announcement;
the stock price decreases right on this day.
Table 4.5: Test results of abnormal return and abnormal trading volume to the stock selling
registration announcement of the internal shareholders with less selling rate.
16
Abnorm
al
Abnormal trading volume
t
return
AAR1
T stat
Zvalue
AAV
T stat
5
0,44%
4.26***
1.76*
0.14
2.54**
4
0,51%
4.97***
2.1**
0.19
3.4***
3
0,64%
6.22***
4.29***
0.18
3.23***
2
0,71%
6.84***
2.77***
0.27
4.74***
1
0,47%
4.59***
3.62***
0.24
4.24***
0
0,06%
0.58
0.16
0.14
2.55**
1
0,02%
0.20
0.60
0.19
3.35***
2
0,00%
0.03
0.43
0.20
3.48***
3
0,05%
0.48
0.25
0.18
3.24***
4
0,04%
0.39
1.02
0.24
4.34***
5
0,02%
0.19
1.10
0.20
3.58***
Framewor
k
CAAR
T stat
Zvalue
MAAV
T stat
[15;1]
5,35%
10.41***
7.66***
0.10
2.69***
[0;15]
0,29%
0.68
0.77
0.14
3.14***
[0;30]
1,03%
1.64
1.02
0.08
1.83*
[15;15]
5,06%
7.55***
5.89***
0.12
3.17***
***; **; * with the respective meaning level at 1%; 5%; 10%.
(Source: The PhD student calculates and summarizes).
Table 4.6: Test results of abnormal return and abnormal trading volume to the stock selling
registration announcement of the internal shareholders with big sale ratio.
t
Abnormal
return
AAR1
0,39%
0,36%
0,49%
0,41%
0,26%
0,07%
0,28%
0,18%
0,29%
0,11%
0,14%
Abnormal trading volume
T stat
3.16***
2.97***
3.99***
3.3***
2.15**
0.58
2.29**
1.45
2.38**
0.86
1.12
Zvalue
2.48**
2.06**
2.73***
0.54
1.13
0.80
1.98**
2.4**
2.31**
2.06**
2.56**
AAV
0.25
0.27
0.27
0.32
0.35
0.38
0.27
0.24
0.41
0.39
0.32
5
4
3
2
1
0
1
2
3
4
5
Framewor
k
CAAR
T stat
Zvalue
MAAV
[15;1]
3,51%
5.69***
3.66***
0.19
[0;15]
1,97%
4.11***
4.91***
0.27
[0;30]
2,50% 3.95***
4.83***
0.20
[15;15]
1,54%
1.96**
1.47
0.23
***; **; * with the respective meaning level at 1%; 5%; 10%.
(Source: The PhD student calculates and summarizes).
T stat
3.18***
3.38***
3.42***
4.08***
4.44***
4.81***
3.42***
3.02***
5.17***
4.91***
4.02***
T stat
4.12***
5.03***
3.96***
4.90***
17
CONCLUSION OF CHAPTER 4
The results indicate that the information implicated in the stock buying registration
announcement of the internal shareholders is considered to be the good information for the market
and the internal shareholders buy stocks as an important strategy to stop the downtrend of stocks in
the market. On the contrary, the information implicated in the stock selling registration
announcement of the internal shareholders is considered as bad information for the market. The
stock price decreases and forms the downtrend on the date of announcement of stock selling
registration of the internal shareholders, the trading volume increases suddenly on the days around
the event day. Besides, the study’s results show there is phenomena that the investors in the market
imitate the internal shareholders to implement transactions. The results further support the theory of
the asymmetric and the signaling theory.
18
CHAPTER 5: INVESTORS’ REACTION TO THE STOCK TRANSACTION
REGISTRATION ANNOUNCEMENT OF STAKEHOLDERS
5.1. The Investors’ reaction based on stock price and trading volume to the stock transaction
registration announcement of the stakeholders being the individuals.
5.1.1. The Investors’ reaction based on stock price and trading volume to the stock buying
registration announcement of the stakeholders being the individuals.
Table 5.1 shows that before the date of information announcement, the stock price in the
market declines, however, after the event day, the stock price increases, the abnormal return
AAR[1]:0.38% with the meaning of 5% and maintains on the following days.
The results in Table 5.1 (the right) show that the trading volume increases right on the date of
stock buying registration and maintains to the end of the 13th date. They are evidences for that the
trading volume is significantly improved since the date of information announcement.
From above results, we can see that the stock buying registration announcement of the
stakeholders being the individuals is considered as a good sign. There is phenomena that the other
investors imitate the stakeholders to implement or increase transactions.
Table 5.1: Test results of abnormal return and abnormal trading volume to the stock buying
registration announcement of the stakeholders being individuals
T
Abnor
mal
return
AAR1
0,24%
0,09%
0,13%
0,11%
0,32%
0,44%
0,38%
0,22%
0,16%
0,10%
0,09%
Abnormal trading volume
T stat
1.41
0.53
0.75
0.64
1.87*
2.55**
2.24**
1.28
0.94
0.61
0.52
Zvalue
1.69*
1.9*
0.23
0.63
0.23
2.56**
2.29**
1.10
0.70
1.36
0.50
AAV
0.02
0.04
0.16
0.15
0.13
0.24
0.32
0.21
0.23
0.27
0.25
5
4
3
2
1
0
1
2
3
4
5
Framewor
k
CAAR
T stat
Zvalue
MAAV
[15;1]
0,14%
0.20
1.03
0.06
[0;15]
1,56%
1.97**
1.76*
0.22
[0;30]
2,45%
2.31**
1.36
0.14
[15;15]
1,42%
1.28
1.76*
0.14
***; **; * with the respective meaning level at 1%; 5%; 10%.
(Source: Summary of calculation results of the PhD student).
T stat
0.18
0.41
1.54
1.49
1.26
2.38**
3.11***
2.1**
2.29**
2.64***
2.46**
T stat
0.94
3.14***
2.03**
2.35**
19
5.1.2. The Investors’ reaction based on stock price and trading volume to the stock buying
registration announcement of the stakeholders being the individuals with the different
sale ratio
Table 5.2 and Table 5.3 respectively show the test results for the existence of the abnormal
return to the stock buying registration announcement with small and big sale ratio of the
stakeholders being individuals.
With the registration announcement of small sale ratio, the results in Table 5.2 do not give
the evidence about the investors’ reaction based on the stock price when the stock purchase
information is announced, this shows that the abnormal return on the date of information
announcement has not statistic meaning (Table 5.2).
Table 5.2: Test results of abnormal return and Abnormal trading volume to the stock buying
registration announcement of the stakeholders being individuals with small sale ratio
T
Abnorma
l return
AAR1
0,22%
0,11%
0,01%
0,28%
0,75%
0,23%
0,32%
0,25%
0,31%
0,08%
0,25%
Abnormal trading volume
T stat
1.05
0.52
0.03
1.32
3.52***
1.08
1.48
1.15
1.46
0.37
1.16
Zvalue
1.05
1.94*
0.07
0.82
1.98**
1.57
1.94*
1.20
0.45
0.11
0.30
AAV
T stat
0.68
0.52
1.09
1.58
0.39
1.77*
1.35
1.15
0.77
1.94*
1.56
5
0.10
4
0.08
3
0.17
2
0.24
1
0.06
0
0.27
1
0.21
2
0.18
3
0.12
4
0.30
5
0.24
Framewor
CAAR
T stat
Zvalue
MAAV
T stat
k
[15;1]
0,78%
0.92
2.32**
0.06
0.62
[0;15]
0,88%
0.89
0.26
0.21
1.92*
[0;30]
1,78%
1.31
0.45
0.09
0.83
[15;15]
0,10%
0.07
0.07
0.14
1.42
*;**;*** with the respective meaning level at 10%;5%;1%.
(Source: Summary of calculation results of the PhD student)
With the registration announcement of big sale ratio, the results in Table 5.3 show the
abnormal trading volume on [0] and [1] date and the cumulative average abnormal return at window
after event has positive values. Additionally, the stock liquidity is improved since the event day,
that the existence of the positive abnormal trading volume from [0] date to [15] date mostly has
statistic meaning when testing.
From above results, we can see the big sale ratio of the stakeholder individuals, the market
has clear reaction to the information and the information implicated in the buying registration
announcement is good. Besides, after comparison, we can find out the investors’ reaction to the
registration announcement of big sale ratio of stakeholder individuals has the similar results with
the ones the internal shareholders.
20
Table 5.3: Test results of abnormal return and abnormal trading volume to the stock
buying registration announcement of the stakeholders being individuals with big sale ratio
T
Abnorm
al return
AAR1
0,27%
0,08%
0,19%
0,07%
0,07%
0,65%
0,50%
0,18%
0,04%
0,36%
0,06%
Abnormal trading volume
T stat
1.08
0.30
0.77
0.28
0.30
2.63***
2.03**
0.73
0.14
1.46
0.24
Zvalue
1.39
0.28
0.65
1.02
1.21
2.14**
1.77*
0.28
0.84
0.65
0.83
AAV
0.02
0.04
0.11
0.02
0.15
0.21
0.46
0.24
0.40
0.27
0.23
T stat
0.20
0.35
0.98
0.19
1.39
1.97**
4.27***
2.25**
3.7***
2.53**
2.11**
5
4
3
2
1
0
1
2
3
4
5
Framewor
k
CAAR
T stat
Zvalue
MAAV
T stat
[15;1]
0,45%
0.40
0.65
0.03
0.39
[0;15]
2,35%
1.94*
0.09
0.25
2.71***
[0;30]
3,44%
2.15**
0.09
0.24
2.44**
[15;15]
2,80%
1.61
0.09
0.14
1.92*
***; **; * with the respective meaning level at 1%; 5%; 10%.
(Source: The PhD student calculates and summarizes).
5.1.3. The Investors’ reaction based on stock price and trading volume to the stock selling
registration announcement of the stakeholders being the individuals.
Table 5.4 shows that the stock price in the market increases sharply and has the continuous
uptrend through the existence of the positive abnormal return from [14] date to [1] date and mostly
has high meaning level. On the date of the announcement of stock selling registration of the
stakeholder individuals, the stock price immediately declines and continues on the following days,
this shows the existence of negative abnormal return on the days after the date of information
announcement. On the other hands, the cumulative abnormal return after the date of information
announcement is negative (CAAR [0;30]: 0,96% and has statistic meaning at 5%).
In term of transaction, the stock liquidity is improved significantly, the trading volume has the
great changes before, on and after the event day.
The above results show that the market considers the stock selling registration information
of the stakeholders being individuals is a bad sign. There is phenomena that the other investors
imitate the stakeholders to implement or increase transactions.
Table 5.4: Test results of abnormal return and abnormal trading volume to the stock selling
registration announcement of the stakeholders being individuals
t
Abnor
mal
return
Abnormal trading volume
AAR1
T stat
Zvalue
AAV
T stat
21
t
Abnor
mal
return
Abnormal trading volume
AAR1
0,67%
0,48%
0,54%
0,33%
0,09%
0,09%
0,07%
0,07%
0,12%
0,05%
T stat
6.91***
4.94***
5.63***
3.37***
0.90
0.88
0.70
0.73
1.21
0.54
Zvalue
4.3***
1.99**
3.65***
2.64***
1.99**
1.83*
0.60
1.13
0.84
0.05
AAV
0.27
0.23
0.28
0.27
0.33
0.28
0.16
0.26
0.22
0.15
T stat
5.23***
4.44***
5.46***
5.27***
6.56***
5.53***
3.13***
5.14***
4.4***
2.89***
4
3
2
1
0
1
2
3
4
5
Framewor
k
CAAR
T stat
Zvalue
MAAV
T stat
[15;1]
4,43% 10.08***
7.39***
0.16
5.25***
[0;15]
0,26%
0.67
3.72***
0.18
4.79***
[0;30]
0,96%
1.8*
4.45***
0.12
3.34***
[15;15]
4,17%
7.07***
4.57***
0.17
5.44***
***; **; * with the respective meaning level at 1%; 5%; 10%.
(Source: The PhD student calculates and summarizes).
5.1.4. Investors’ reaction is expressed through stock price and stock trading volume to the
announcement of stock sell registration of personal stakeholders with different sale ratios
Tables of 5.5 and 5.6 shows inspection results of abnormal return existence to the
announcement of stock sell registration with big and small sell registration ratios of personal
stakeholders respectively. The results indicate that investors’ reaction to the announcement of little,
much sell registration of personal stakeholders has commonality.
Table 5.5: Abnormal return and abnormal trading volume inspection results to the
announcement of stock sell registration of individual stakeholders with small sale ratio.
T
5
4
3
2
1
0
1
2
3
4
5
Frame
Abnormal
return
AAR1
0.28%
0.51%
0.43%
0.71%
0.38%
0.00%
0.23%
0.08%
0.21%
0.01%
0.12%
CAAR
Abnormal trading volume
T stat
2.28**
4.12***
3.47***
5.69***
3.04***
0.01
1.84*
0.67
1.69*
0.06
0.94
T stat
Zvalue
0.95
1.36
0.95
3.39***
1.56
0.48
2.41**
0.13
1.66*
0.27
1.60
Zvalue
AAV
0.15
0.22
0.22
0.27
0.25
0.30
0.30
0.21
0.27
0.15
0.11
MAAV
T stat
2.81***
4.02***
3.99***
4.9***
4.64***
5.46***
5.57***
3.83***
5***
2.75***
2.07**
T stat
22
T
[15;1]
[0;15]
[0;30]
[15;15]
Abnormal
Abnormal trading volume
return
AAR1
T stat
Zvalue
AAV
5.17%
9.11***
6.28***
0.13
0.26%
0.53
3.9***
0.16
1.27%
1.82*
4.21***
0.10
4.91%
6.42***
3.84***
0.15
***; **; * means 1%; 5%; 10% respectively.
(Source: Calculated and summarized by the Research Student).
T stat
3.40***
3.43***
2.19**
3.70***
Table 5.6: Abnormal return and abnormal trading volume inspection results with the
announcement of stock sell registration of individual stakeholders with big sale ratio.
Abnormal
Abnormal trading volume
return
t
AAR1
T stat
Zvalue
AAV
T stat
5
0.24%
1.69*
0.35
0.33
4.56***
4
0.81% 5.77***
4.66***
0.32
4.5***
3
0.51% 3.64***
1.99**
0.23
3.24***
2
0.37% 2.65***
1.79*
0.29
4.11***
1
0.31%
2.23**
2.5**
0.30
4.14***
0
0.16%
1.13
1.91*
0.37
5.14***
1
0.06%
0.46
0.17
0.26
3.65***
2
0.26%
1.85*
1.09
0.11
1.57
3
0.06%
0.42
0.04
0.27
3.74***
4
0.24%
1.69*
1.68*
0.30
4.2***
5
0.03%
0.23
1.79*
0.17
2.35**
Frame
CAAR
T stat
Zvalue
MAAV
T stat
[15;1]
3.79% 5.62***
4.97***
0.18
3.88***
[0;15]
0.10%
0.17
0.37
0.21
3.39***
[0;30]
0.37%
0.47
1.09
0.15
2.49**
[15;15]
3.69% 4.09***
3.53***
0.20
3.95***
***; **; * means 1%; 5%; 10% respectively.
(Source: Calculated and summarized by the Research Student).
5.2. Investors’ reaction is expressed through stock price and stock trading volume to the
announcement of stock transaction registration of organizational stakeholders.
5.2.1. Investors’ reaction is expressed through stock price and stock trading volume to the
announcement of stock purchase registration of organizational stakeholders.
Results (table 5.7) indicate that at the announcement date, price reacted to information (AAR [0]:
0.84% to the meaning level of 1%). After disclosure date of information, stock price continued to
increase, average accumulated abnormal return was also positive. Thus, the market positively
reacted to the announcement of stock purchase registration of organizational stakeholders. Trading
volume had unclear changes.
Based on results of investors’ reaction expressed through stock price and trading volume,
information contained in the announcement of stock purchase registration of organizational
23
stakeholders is considered good information, stock price increased and stock liquidity was
improved but not obviously.
Table 5.7: Abnormal return and abnormal trading volume inspection results to the
announcement of stock purchase registration of organizational stakeholders
T
Abnor
mal
return
Abnormal trading volume
AAR1
T stat
Zvalue
AAV
T stat
5
0.01%
0.06
0.35
0.04
0.47
4
0.35%
2.34**
0.53
0.04
0.53
3
0.20%
1.31
0.41
0.10
1.24
2
0.01%
0.06
1.11
0.12
1.43
1
0.03%
0.19
0.73
0.03
0.35
0
0.84%
5.56***
2.94***
0.13
1.53
1
0.78%
5.18***
3.83***
0.13
1.56
2
0.42%
2.83***
2.06**
0.25
2.98***
3
0.13%
0.88
1.04
0.14
1.63
4
0.22%
1.43
0.86
0.03
0.33
5
0.07%
0.50
0.48
0.02
0.29
Frame
CAAR
T stat
Zvalue
MAAV
T stat
[15;1]
0.33%
0.54
1.67*
0.14
2.45**
[0;15]
1.79%
2.85***
2**
0.03
0.45
[0;30]
1.36%
1.65*
1.50
0.02
0.35
[15;15]
2.11%
2.5**
1.37
0.05
0.90
***; **; * means 1%; 5%; 10% respectively.
(Source: Calculated and summarized by the Research Student).
5.2.2. Investors’ reaction is expressed through stock price and stock trading volume to the
announcement of stock purchase registration of organizational stakeholders with different
purchase ratios.
With announcement of small purchase registration (Table 5.8) of organizational
stakeholders, stock prices’ reaction to the disclosed information with evidence of positive abnormal
return value existence with meaning level of 5% at the event date and existed to the 3rd day. On the
other hand, accumulated abnormal return is positive at time frame after disclosure date of
information with meaning level of 1% for non parameters inspection. Trading volume’s fluctuation
is not significant and obvious, however, stock liquidity is generally improved. Thus, event of
announcement of small purchase registration of organizational stakeholders has short term positive
impact on stock price and no obvious impact on trading volume.
Table 5.8: Abnormal return and abnormal trading volume inspection results to the
announcement of stock purchase registration of organizational stakeholders with small
purchase ratios.
t
Abnorm
al return
AAR1
Abnormal trading volume
T stat
Zvalue
AAV
T stat
24
5
0.20%
0.91
0.34
0.08
0.75
4
0.30%
1.41
0.70
0.02
0.18
3
0.01%
0.07
0.20
0.01
0.09
2
0.00%
0.02
0.92
0.12
1.12
1
0.28%
1.30
0.52
0.11
1.06
0
0.52%
2.41**
1.41
0.08
0.75
1
0.33%
1.54
1.59
0.06
0.55
2
0.54%
2.5**
2.49**
0.14
1.37
3
0.10%
0.45
0.02
0.09
0.86
4
0.56% 2.58***
1.63
0.02
0.20
5
0.19%
0.90
0.16
0.04
0.39
Frame
CAAR
T stat
Zvalue
MAAV
T stat
[15;1]
0.02%
0.03
0.74
0.09
1.29
[0;15]
1.06%
1.27
2.84***
0.06
0.74
[0;30]
0.93%
0.86
1.77*
0.06
0.86
[15;15]
1.04%
0.90
0.87
0.07
1.10
***; **; * means 1%; 5%; 10% respectively.
(Source: Calculated and summarized by the Research Student).
With announcement of big purchase registration (table 5.9) of organizational stakeholders,
mean positive abnormal return exits at the disclosure date of information and maintains until the
fourth day together and mean accumulated abnormal return at time frame after the disclosure date
of information also has very high positive value. Stock volume also has positive fluctuations
(increase in liquidity) but inconsiderable. Similar to case of small purchase registration, event of
announcement of big purchase registration of organizational stakeholders has short term positive
impact on stock price and no obvious impact on trading volume.
Table 5.9: Abnormal return and abnormal trading volume inspection results to the
announcement of stock purchase registration of organizational stakeholders with big
purchase ratios.
t
5
4
3
2
1
0
1
2
3
4
5
Frame
[15;1]
[0;15]
[0;30]
Abnorma
l return
AAR1
0.22%
0.40%
0.38%
0.01%
0.23%
1.15%
1.23%
0.31%
0.17%
0.13%
0.04%
CAAR
0.68%
2.52%
1.80%
Abnormal trading volume
T stat
1.02
1.89*
1.81*
0.06
1.07
5.45***
5.8***
1.46
0.79
0.62
0.21
T stat
0.77
2.68***
1.43
Zvalue
0.76
0.14
0.68
0.58
1.66*
2.83***
3.55***
0.32
1.40
0.32
0.76
Zvalue
0.86
0.76
1.12
AAV
0.21
0.09
0.17
0.11
0.05
0.17
0.17
0.34
0.19
0.08
0.06
MAAV
0.20
0.09
0.02
T stat
1.43
0.60
1.11
0.70
0.31
1.12
1.13
2.28**
1.29
0.53
0.37
T stat
2.23**
0.81
0.20
25
[15;15]
3.19%
2.57**
1.84*
0.05
0.54
***; **; * means 1%; 5%; 10% respectively.
(Source: Calculated and summarized by the Research Student).
5.2.3. Investors’ reaction is expressed through stock price and stock trading volume to the
announcement of stock sell registration of organizational stakeholders.
Results of Table 5.10 prove that before the event of continuous increase in stock price is
expressed through positive abnormal return existence and accumulated abnormal return at time
frame before announcement. However, at the announcement date, stock price decreases and this
lasts to the second day after disclosure date of information and days after that.
Investors’ reaction, in perspective of volume, to abnormal trading volume is positive from
day [5] to day [15]. In addition, average daily indicator for abnormal trading volume for period
before ad after the event, MAAV[15;1]: 0.10 has statistical meaning at level of 5%; MAAV[0;15]:
0.22 has statistical meaning at level of 1% and MAAV[0;30]: 0.17 with meaning level of 1%.
We can see the information contained in announcement of stock sell registration of
organizational stakeholders is bad information. Stock price immediately decreases and forms a
trend of decrease in stock price from the announcement date.
Table 5.10: abnormal return and abnormal trading volume inspection results to the
announcement of stock sell registration oforganizational stakeholders
Abnor
mal
t
return
Abnormal trading volume
AAR1
T stat
Zvalue
AAV
5
0.24%
1.99**
0.61
0.18
4
0.34% 2.83***
0.92
0.17
3
0.31% 2.64***
1.56
0.20
2
0.32% 2.69***
2.19**
0.19
1
0.12%
1.02
0.61
0.15
0
0.15%
1.22
2.45**
0.35
1
0.15%
1.30
0.98
0.23
2
0.26% 2.23**
3.19***
0.21
3
0.15%
1.26
0.24
0.21
4
0.10%
0.81
0.03
0.24
5
0.05%
0.45
0.66
0.19
Frame
CAAR
T stat
Zvalue
MAAV
[15;1]
2.01% 3.61***
1.50
0.10
[0;15]
1.03%
1.73*
2.93***
0.22
[0;30]
1.42%
1.91*
3.67***
0.17
[15;15]
0.97%
1.21
0.34
0.16
***; **; * means 1%; 5%; 10% respectively.
(Source: Calculated and summarized by the Research Student).
T stat
2.93***
2.77***
3.29***
3.07***
2.55**
5.81***
3.79***
3.46***
3.44***
4***
3.11***
T stat
2.33**
3.91***
3.23***
3.49***