Probabilistic analysis of PWR Reactor Pressure Vessel under Pressurized Thermal Shock
Bạn đang xem bản rút gọn của tài liệu. Xem và tải ngay bản đầy đủ của tài liệu tại đây (635.51 KB, 9 trang )
Nuclear Science and Technology, Vol.8, No. 1 (2018), pp. 01-09
Probabilistic analysis of PWR Reactor Pressure Vessel under
Pressurized Thermal Shock
Kuen Ting1, Anh Tuan Nguyen2, Kuen Tsann Chen2
and Li Hwa Wang3, Yuan Chih Li3, Tai Liang Kuo3
1
Lunghwa Univesity of Sci. and Tech., Graduate School of Engineering Technology,
No.300, Sec.1, Wanshou Rd., Guishan Shiang, Taoyuan County 33306,Taiwan, R.O.C.
2
National Chung Hsing University, Department of Applied Mathematics,
No. 250 Kuo Kuang Rd., Taichung 402, Taiwan, R.O.C.
3
Industrial Technology Research Institute, Material and Chemical Research Laboratories, RM 824, Bldg.52,
No.195, Sec.4, Chung Hsing Rd., Chutung, Hsinchu, 31040, Taiwan, R.O.C.
Email:
(Received 11 January 2018, accepted 02 April 2018)
Abstract: The beltline region is the most important part of the reactor pressure vessel, become
embrittlement due to neutron irradiation at high temperature after long-term operation. Pressurized
thermal shock is one of the potential threats to the integrity of beltline region also the reactor pressure
vessel structural integrity. Hence, to maintain the integrity of RPV, this paper describes the benchmark
study for deterministic and probabilistic fracture mechanics analyzing the beltline region under PTS
by using FAVOR code developed by Oak Ridge National Laboratory. The Monte Carlo method was
employed in FAVOR code to calculate the conditional probability of crack initiation. Three problems
from Probabilistic Structural Integrity of a PWR Reactor Pressure Vessel (PROSIR) round-robin
analysis were selected to analyze, the present results showed a good agreement with the Korean
participants’ results on the conditional probability of crack initiation.
Keywords: Probabilistic Fracture Mechanics, Beltline Region, Reactor Pressure Vessel, Pressurized
Thermal Shock.
I. INTRODUCTION
The Reactor Pressure Vessel is the most
important component of the Pressure Water
Reactor (PWR) as it contains the core and
control mechanisms. Pressurized Thermal
Shock (PTS), one of many potential threats to
the structural integrity of Reactor Pressure
Vessel (RPV), has been studied for more than
30 years [1]. PTS is caused by several reasons
such as break of the main steam pipeline,
inadvertent open valve etc., then the
emergency core cooling water injects into the
RPV, including with the high pressure inside
the RPV and flaws in the wall thickness make
the appearance of PTS. There are two
approaches in analyzing the RPV under the
PTS, the first is deterministic analysis, and the
second is probabilistic analysis. The
deterministic analysis includes thermal, stress
and fracture mechanics analysis. Many
researchers, for example, Elisabeth K. et al.
[2], Myung J.J. et al. [3], IAEA TECDOC [4],
Guian Q. et al. [5], performed calculation the
distribution of thermal, stress and stress
intensity with wall thickness and time. The
deterministic results combining with main
uncertainty parameters (initial reference
temperature, crack density, size, aspect ratio,
neutron fluence, Cu, Ni content of RPV
material) are used as the input of the second
approach to work out the probabilistic of
©2018 Vietnam Atomic Energy Society and Vietnam Atomic Energy Institute
PROBABILISTIC ANALYSIS OF PWR REACTOR PRESSURE VESSEL …
crack initiation. There were many studies
conducted to perform probabilistic analysis
such as probabilistic structural integrity of
PWR RPV under PTS, Myung J.J. et al. [3];
comparison of pressure vessel integrity
analyses and approaches for VVER 1000 and
PWR vessels for PTS conditions Oya O.G. [6];
and probabilistic assessment of VVER RPV
under pressurized thermal shock, Vladislav P.
et al. [7].
Additionally, the geometry, thermo-mechanical
of RPV wall thickness is utilized to calculate
thermal, stress and stress intensity factor (SIF)
distribution with wall thickness during the
transient. In FAVOR, the 1-D model with
finite element method is used to perform
estimation for distribution of temperature and
stress through the wall thickness during the
transient time. Meanwhile, the influence
function method is used to estimate stress
intensity factor of the postulated cracks. The
fracture toughness KIC of RPV wall thickness
is expressed as the Eq. 1.
In this study, so as to get more
experience in PFM analysis and make a
benchmark for sequent studies, a PTS transient
of round-robin program named Probabilistic
Structural Integrity of a PWR Reactor Pressure
Vessel (PROSIR) [9] with a PWR is analyzed
using FAVOR 12.1. The deterministic and
probabilistic fracture mechanics results are
compared with participant results and showed
good agreement.
Cladding
K Ic 23.65 29.56 exp[(0.02(T RTNDT )]
In probabilistic fracture mechanics
analysis, the probability of crack initiation and
vessel failure is calculated based on Monte
Carlo method. The reference temperature
RTNDT in FAVOR is estimated based on
Regulatory Guide 1.99 ver.2 [10].
Base Metal
RTNDT Initial RTNDT RTNDT Margin
Emergency Core
Cooling Water
(2)
ΔRTNDT: the mean value of the
adjustment in reference temperature caused by
irradiation.
Tensile
Stress
Reactor Core
(1)
Distance from
Inner Surface
ΔRTNDT = (CF)f(0.28-0.10logf)
Reactor Pressure Vessel
(3)
CF (oF): the chemistry factor, a function
of copper and nickel content.
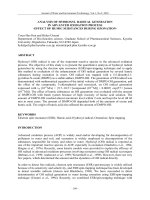
Fig. 1 Beltline region of PWR Reactor Pressure Vessel
f(1019 n/cm2, E> 1 MeV): the neutron
fluence at any depth in the vessel wall.
A. FAVOR Model
FAVOR code has been developed by
ORNL to perform deterministic and
probabilistic fracture mechanics analysis of a
RPV subjected to PTS events since the 1980s
[4]. The beltline region of RPV is the
interested object to analysis. Fig. 1 shows the
beltline region with the base metal and
cladding thickness. In a deterministic analysis,
the history of the coolant temperature, pressure,
and heat transfer coefficient is the basic input.
f = fsurf(e-0.24x)
(4)
fsurf (1019 n/cm2, E> 1 MeV): the neutron
fluence at the inner surface of the vessel.
x (inches): the depth into the vessel wall
measured from the vessel inner surface.
Margin (oF): the quantity
Margin = 2
2
(5)
NGUYEN ANH TUAN et al.
σI: the standard deviation for the initial
RTNDT.
P, Cu, Ni: % of phosphorus, copper and
nickel
σΔ: the standard deviation for ΔRTNDT.
φ: fluence in n/m2 divided by 1023
The conditional probability of crack
initiation of certain KI implemented in FAVOR
is expressed as:
Irradiation decrease through the RPV
wall:
φ = φ0e-0.125x for 0
0;
K I aK
P( K Ic K I )
K I aK 4
1
exp
[
]
;
K I aK
bK
The fracture toughness KIC of RPV wall
thickness
(6)
aK 19.35 8.335 exp[0.02254(T RTNDT )]
(7)
K Ic 36.5 3.1exp[0.036(T RTNDT 55)]
(12)
bK 15.61 50.132 exp[0.008(T RTNDT )]
II. PROBLEM DEFINITION
(8)
A. Reactor Vessel
B. PROSIR Model
A typical 3-loop PWR is selected by the
round-robin to study the probabilistic risk
evaluation, with the inner radius of 1994mm,
a base metal thickness of 200mm and a
cladding thickness of 7.5mm. Six participants
from Korea joined the project, the computer
codes and participants are shown in Table I.
Each participant performed deterministic and
probabilistic fracture mechanics analysis with
different models, and computer codes. The
participant P1 used influence coefficient from
VISA to express K I. The participants P2, P3
both used influence coefficient from PROSIR
to assume KI. The participant P4 also used
calculated KI directly from the finite element
analysis. The participant 5 used PROBie-Rx
computer code to estimate K I. The
participants P6 used influence coefficient
from FAVOR 2.4 to calculate K I. The thermomechanical properties of wall thickness
including base metal and weld are shown as in
Table II. Table III shows the chemical
compositions and initial RTNDT of the base
metal and weld.
PROSIR is a round-robin exercise with
the objective to issue some recommendation of
best practice in probabilistic analysis of RPV
and to understand the key parameters of this
type of probabilistic analysis methods, such as
transient description and frequency, material
properties, defect type and distribution [11].
There are 3 round-robin problems (RR) to
consider the effect of different parameters on
the conditional probability of crack initiation
such as reference temperature, transients, crack
shape, crack depth distribution etc. There are
16 participants from 9 countries joined the
round robin. In this study, the present study is
compared with the results from Korean
participants.
Shift formula equations are separated to
express for base metal and weld. Base metal:
ΔRTNDT=[17.3+1537*(P-0.008)+238*(Cu0.08) +191*Ni2Cu]*φ0.35
(9)
Weld:
ΔRTNDT= [18+823*(P-0.008)
+148*(Cu-0.08) +157*Ni2Cu]*φ0.45
(10)
3
PROBABILISTIC ANALYSIS OF PWR REACTOR PRESSURE VESSEL …
B. Analyzed Transient
C. Major round-robin problems
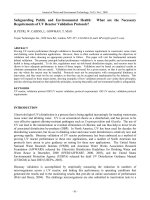
One transient analyzed in this study is a
typical PTS-transient (TR3), Fig. 2a shows the
pressure and temperature histories for this transient.
Total time of the transient is 15000 seconds. The
transient is cold re-pressurization with pressure
and temperature decrease simultaneously right
after the transient begin. Then the typical PTS
shows slowly increase of temperature, quickly
increase and maintenance of pressure from the
7000th second after the starting of the transient.
1. Round-robin 1 (RR1)
The toughness property distribution
versus aging is investigated in this round-robin.
The random parameters are initial RTNDT,
copper, phosphorus and nickel contents, RTNDT
shift. The results are mean values of RTNDT
distribution for the different level of the
fluence.
Table I. Participants and Computer Codes
Participant
Organization
Deterministic Analysis
Probabilistic Analysis
P1
Korea Power Engineering Company
(KOPEC)
PREVIAS
PREVIAS
P2
Korea Power Engineering Company
ABAQUS V. 5.8 &
(KOPEC)
Influence Function
Method
Korea Atomic Energy Research
Institute (KAERI)
ABAQUS V. 6.3
P3
P4
P5
Fortran
PFAP Version 1.0
Influence Function
Method
Korea Atomic Energy Research
Institute (KAERI)
FEM 3D Method
Korea Institute of Nuclear Safety
PROBie-Rx
ABAQUS V. 6.3
Excel
PROBie-Rx
(KINS)
P6
Korea Institute of Nuclear Safety
FAVOR V. 02.4
Origin
(KINS)
P7
Present Study
FAVOR V. 12.1
FAVOR V. 12.1
Table II. Thermal and mechanical material properties of base metal, welds and cladding of the RPV
Initial RTNDT
% Copper (Cu)
% Phosphorus (P)
% Nickel (Ni)
Mean
1SD
Mean
2SD
Mean
2SD
Mean
2SD
Base metal
-20°C
9°C
0.086
0.02
0.0137
0.002
0.72
0.1
Weld
-30°C
16°C
0.120
0.02
0.0180
0.002
0.17
0.1
4
NGUYEN ANH TUAN et al.
a.
b.
Fig. 2 a. Transient histories of PTS (TR3), b. Surface breaking crack, a’ = 19.5mm, 2l = 117mm
2. Round-robin 2 (RR2)
conditions are elastic K I computation for a
surface with no plasticity correction, crack
initiation only at the deepest point B and no
residual stress, except the free stress
temperature of 300 o C.
This round-robin problem investigates
the conditional probability of crack
initiation (CPI) for PTS transient with
surface breaking crack (RR2) in weld and
base metal. The postulated surface breaking
crack as shown in Fig. 2b consist of crack
depth a’ of 19.5mm, crack length 2l of
117mm. The random parameters are
toughness distribution from RR1, chemical
composition. The non-random parameters
are vessel geometry, transient 3, the neutron
fluence decreases through the thickness,
thermal and mechanical material properties.
For the fracture mechanics model, the
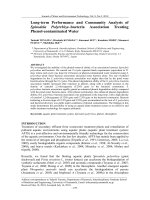
3. Round-robin 3 (RR3)
In this round-robin problem, the random
and non-random parameters are almost the
same with the RR2 problem, the only
difference is the flaw size distribution of
Pacific Northwest National Laboratory [9] with
defect aspect ratio a/2l=1/6 analyzed to express
CPI versus time. The PNNL and Marshall flaw
size distribution is shown in Fig. 3.
Fig. 3 Flaw distribution and size
5
PROBABILISTIC ANALYSIS OF PWR REACTOR PRESSURE VESSEL …
to different thermal expansion coefficient of
the base metal and the cladding. This study
hoop stress is also equivalent to participant’s
results.
III. RESULTS AND DISCUSSION
A. Deterministic Fracture Mechanics Results
In this study, the postulated flaw was
given for PWR with a specific size and shape
to verify whether it was initiated or not
during the PTS transients. To ensure a
perfect fitting at pre-requisite for all
interesting
participants,
deterministic
analysis including thermal, stress and
comparison of temperature and hoop stress
with wall thickness at 7200th second are
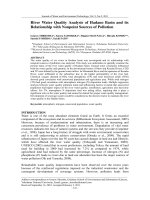
presented in Fig. 4. In Fig. 4a, a good
agreement was reached among temperature
distribution results of the participants and the
present result, only one participant is an
outlier, possibly due to using too simplified
analytical method [4]. The outer wall is
hotter than the inner because of the inner
coolant temperature. As the different thermal
conductivity between cladding and base
metal, the temperature gradient in the
cladding is decliner than the temperature of
the base metal. Fig. 4b shows the hoop stress
distribution results of the participants and
this study results. The stress at cladding is
much higher than at the base metal, it is due
Besides the temperature and hoop
stress distribution with RPV wall thickness,
the history of the temperature and stress
intensity factor at crack tip (the deepest point)
are estimated and shown as in Fig. 5. The
histories of temperatures at crack tip are very
consistent in Fig. 5a. However, the stress
intensity factors (K I) histories of participants
at crack tip show in Fig. 5b are not exactly
coincident although those results are
acceptable. To estimate K I, participant P4
used direct FEM 3D to determinate J-integral,
participant P1, P2, P3, P6 and this study used
influence function method with influence
coefficients from different sources, those are
VISA, PROSIR, FAVOR 12.1, respectively.
Moreover, participant P5 carried out K I
calculation using influence method with
independently
developed
influence
coefficient. So the different models and
influence
coefficients
used
by
the
participants are the main reason of the
difference among K I results.
a.
b.
Fig. 4 Variation of a. Temperature and b. Hoop stress along with wall thickness at 7200th second.
6
NGUYEN ANH TUAN et al.
a.
b.
Fig. 5 History of a. Temperature and b. Stress intensity factor at crack tip
Fig. 6, all the participants use Reg. 1.99
rev.2 to calculate RTNDT. But there are big
differences in the results because of the
participant 2 to 6, they also use Eq. 10, 11 to
express shift RTNDT, the participant 1 beside
equation 1 also used depth as a random
variable for RT NDT. This study uses Reg. 1.99
rev.2 to calculate RTNDT.
B. Probabilistic Fracture Mechanics Results
The probability of crack is initiation is
estimated based on flaw data (flaw density,
size,
and
location),
RPV
beltline
embrittlement (neutron fluence, Cu, Ni, P
content), and the results obtained in the
deterministic analysis (the distribution of
hoop stress, stress factor intensity with wall
crack). The mean RTNDT results are shown in
a.
b.
Fig. 6 Variation of mean RTNDT with fluence
As for the RR2, RR3 problems, the
conditional probabilities of crack initiation
(CPI) calculated for the weld and the plate of
RPV are shown as in Fig. 7, 8. Fig.7a, 7b
show the CPIs in case of an inner surface
breaking crack. The participant P1 results are
higher than the results of other participants, it
is due to over-estimation of RTNDT [3]. There
are slight differences among other participant
results because of the different methods used in
estimating stress intensity and performing PFM
analysis. However, it can be see that this study
results almost converge with those of
participants P2, P3, P4, P5 at higher neutron
7
PROBABILISTIC ANALYSIS OF PWR REACTOR PRESSURE VESSEL …
fluence. Fig. 8a, 8b shows the CPIs in case of
PNNL crack distribution, the results are lower
than those of Fig. 7a, 7b proving that the crack
distribution decreases the CPIs. The reasons of
the difference among participant results are the
same with those in Fig 7a, 7b. In summary,
although the CPIs are not very coincident but
this study results are in the same trend and in
the middle of other results, showing a fairly
good agreement with the results of participants.
a.
b.
Fig. 7 Surface breaking flaw
a.
b.
Fig. 8 PNNL flaw size distribution
experience and knowledge about probabilistic
fracture mechanics analysis significantly
improved. Through the benchmark study, it
reveals some weakness of the FAVOR 12.1
such as the limited aspect ratio between length
and depth of the postulated cracks, it is unable
to perform DFM and PFM analysis for semielliptical under clad crack. Based on the
benchmark test, a succeeding study will be
conducted to modify FAVOR 12.1 source code
and calculating procedure so as to improve its
capabilities to increases the type of crack and
the crack aspect ratio FAVOR 12.1 be able to
IV. CONCLUSIONS
The transient in the round-robin proposal
of the RPV PROSIR with postulated flaws is
performed deterministic and probabilistic
analyses using FAVOR 12.1. The results are
compared with other results from PROSIR and
the conclusions are inferred. The deterministic
results are in very good agreement with the
other results. As for the probabilistic fracture
mechanics, this study results are the same trend
and in good agreement with the Korean results.
By practicing three cases from PROSIR, the
8
NGUYEN ANH TUAN et al.
analyze.
Additionally, deterministic and
probabilistic fracture mechanics of VVER
reactor pressure vessel will be analyzed by this
computer code.
5.
Guian Q, Markus N. “Procedures, methods and
computer codes for the probabilistic assessment
of reactor pressure vessels subjected to
pressurized
thermal
shocks”,
Nuclear
Engineering and Design, p. 35-50, 2013.
REFERENCE
6.
Oya OG, Uner C. “Comparision of pressure
vessel integrity analyses and approaches for
VVER 1000 and PWR vessels for PTS
conditions”, Nuclear Engineering and Design,
p. 231-241, 2003.
7.
Vladislav P, Miroslav P, Dana L.
“Probabilistic assessment of pressurized
thermal shocks”, Nuclear Engineering and
Design, 269, p. 165-170, 2014.
8.
William PT, Dickson TL, Yin S, Fracture
Analysis of Vessels-Oak Ridge FAVOR,
v12.1, Computer Code: Theory and
Implementation of Algorithms, Methods, and
Correlations,
Oak
Ridge
National
Laboratory, United States, 2012.
9.
Claude F, PROSIR Probabilistic Structural
Integrity of a PWR Reactor Pressure Vessel,
Electricite De France, France, 2003.
1.
2.
3.
4.
Myung JJ, Young HC, Yoon SC, Jong MK,
Jong WK., “PFM Round-robin Analysis on
RPV Integrity during PTS by Korean
Participants”, The 8th International Workshop
on the Integrity of Nuclear Components,
Japan, 2009.
Elisabeth K, Cornelia S, Albert S, Roland H.
“Life management of reactor pressure vessels
under pressurized thermal shock loading:
deterministic procedure and application to
Western and Eastern type of reactors”,
International Journal of Pressure Vessels and
Piping, 78, p.85-98, 2001.
Myung JJ, Chang HJ, Seok HK, Young HC,
Hho JK, Sung GJ, Jong MK, Gap HS, Tae EJ,
Taek SC, Ji HK, Jong WK, Keun BP. “Roundrobin Analysis for Probabilistic Structural
Integrity Reactor Pressure Vessel under
Pressurized Thermal Shock”, Journal of
Mechanical Science and Technology, 19,
p.634-648, 2005.
10. Nuclear Regulatory Commision Regulatory
Guide 1.99 Rev. 2, Radiation Embrittlement of
Reactor Pressure Vessel, United States, 1988.
11. OECD, Probabilistic Structural Integrity of
a Pressurised Water Reactor Pressure
Vessel, Final Report, Nuclear Safety,
NEA/CSNI, 2016.
IAEA TECDOC 1627, “Pressurized Thermal
Shock in Nuclear Power Plants: Good
Practices for Assessment”, International
Atomic Energy Agency, Austria, 2010.
9