A structural characterization of MoO3 material prepared using three different methods
Bạn đang xem bản rút gọn của tài liệu. Xem và tải ngay bản đầy đủ của tài liệu tại đây (297.22 KB, 9 trang )
HNUE JOURNAL OF SCIENCE
DOI: 10.18173/2354-1059.2019-0035
Natural Science, 2019, Volume 64, Issue 6, pp. 93-101
This paper is available online at
A STRUCTURAL CHARACTERIZATION OF MoO3 MATERIAL PREPARED
USING THREE DIFFERENT METHODS
Pham Van Hai and Nguyen Hong Minh Chau
Faculty of Physics, Hanoi National University of Education
Abstract. In this work, we study a semiconductor-based photocatalyst MoO3
synthesized using three simple techniques, including as-prepared, hydrothermal
and microwave-assisted methods. The obtained samples were characterized using
X-ray diffraction (XRD), and Raman spectroscopy. We found a better crystallinity
in the nanoparticles synthesized by the microwave-assisted method in comparison
to those synthesized by the other methods. From this starting result, we chose
the microwave-assisted method as a favored one to further investigate the effect of
annealed temperatures on the phase formation. In addition, by using the correlation
method, we predicted the Raman active modes of α-MoO3 . The results are in good
agreement with those obtained by experiments for the same system.
Keywords: Porous MoO3 , microwave-assisted method, hydrothermal method.
1.
Introduction
Molybdenum trioxide (MoO3 ) is one of the chemical molybdenum compound
produced on the large scale due to various applications, including oxidation catalysts,
metal-resistant alloys and photocatalysts. MoO3 crystals are known to exist in three
polymorphs, depending on temperature: orthorhombic (α-MoO3 ), monoclinic (β-MoO3 )
and hexagonal (h-MoO3 ) [1-3]. Amongst known phases, α-MoO3 with an anisotropic
layered structure [4] has been widely used as a potential photocatalyst material. Here
highly asymmetrical [MoO6 ] octahedrons arrange into a bilayer along the (010) direction
so that octahedrons with the same corners build up a plane. Compared to the bulk
phase, the layered structure MoO3 gives rise to a significantly larger surface area [5],
and consequently is expected to possess a better photocatalytic efficiency.
Until now, a number of experiments have been reported to prepared MoO3 ,
such as physical vapor deposition (PVD) [6], hydrothermal technique [7], magnetron
Received May 30, 2019. Revised June 20, 2019. Accepted June 27, 2019.
Contact Pham Van Hai, e-mail:
93
Pham Van Hai and Nguyen Hong Minh Chau
sputtering [8], electrocatalytic oxidation [9], chemical precipitation [10] and liquid
exfoliation [11]. Yang and coworkers [12] have recently prepared two-dimensional
(2D) MoO3 nanosheets by freeze-drying method, that enables to produce novel porous
materials. A great advantage of this technique is that it requires only water as an solvent
and use green and sustainable ice crystals. In addition, a variety of pore morphologies and
nanostructures of materials can be controlled by simply tuning experimental conditions
during freezing. However, to our best knowledge, there is no report in the literature on the
preparation MoO3 materials using the microwave-assisted method, which is an effective
route to synthesis the photocatalytic materials [13-17].
In the current work, we prepared porous MoO3 through a combination of
freeze-drying method and thermal annealing. The samples obtained were investigated
as a function of experimental conditions and annealed temperatures.
2.
Content
2.1. Experiments
* Materials
The chemical reagents were analytical grade and were used without further
purification.
* Synthesis of porous MoO3
2.5 g Polyvinyl Alcohol (PVA) was dissolved in 50.0 mL of distilled water. Then
5.0 g ammonium molybdate (AHM) was dissolved in 10.0 mL of PVA solution under
heating at 80◦ C in water bath. When the AHM completely dissolved, the resulting
solution was poured into mould and kept for 24h at 0◦ C. Differently from a complicated,
high-pressure synthesis reported by Yang et. al. [12], we skipped the stage at which
freeze-drying solution carried out at 80Pa and 0◦ C. The freeze-dried samples were divided
into three parts that were later used to investigate the effect of experimental setups on the
structural property. First part was used without further treatment, called ’as-prepared’,
the second one was transferred to a 150 mL bottle and heated by a microwave oven at
a power of 750 W for 20 min. After microwave processing, the solution was naturally
cooled down to room temperature. The third part was inserted into a thermo flask to used
for hydrothermal synthesis at 160◦ C for 8 hours [18]. Finally, all the powers obtained
from three parts were annealed for 5 h at different temperatures from 300◦ C to 600◦ C
with a heating rate of 10◦C/min−1 in air.
* Characterization
The obtained samples were characterized by powder X-ray diffraction (XRD) on a
Siemens D5005 X-ray diffractometer. The Raman spectroscopy analysis was performed
with a Horiba LabRAM HR Evolution spectrometer at an excitation wavelength of
532 nm.
94
A structural characterization of MoO3 prepared using three different methods
2.2. Results and discussion
2.2.1. Prediction to Raman active modes
There are many different approaches to predict the Raman active modes: a purely
mathematical one, using the correlation method, a classical one based on GF Wilson’s
method and a quantum one based on the ab initio calculations. The first one is accurate
because it is purely symmetric but does not allow to determine the vibrational frequency
and intensity of Raman modes. The second one uses the extended to crystals GF Wilson’s
method, but it’s emprical. The third one has several approximations (Born–Openheimer,
correlation, basis for quantum states). A large number of programs calculates the
vibrational frequencies from the first principles by using DFT which is quite reliable,
such as DMol, Quantum Expresso, Siesta, VASP.
Here, for sake of simplicity, based on the group theory and Halfords site symmetry
correlation method, we calculate the Raman active modes of MoO3 . The details are given
as follows:
First, it is known that the number of molecules in crystallographic unit cell (Z) and
the number of lattice points (LP) of the MoO3 crystal are 4 and 1, respectively. Therefore,
Z
the number of molecules in the Bravais space cell is ZB =
= 4. The equilibrium
LP
position of each atoms lies on a site that has its own symmetry. This site symmetry, a
subgroup of the full symmetry of the Bravais unit cell, must be ascertained correctly for
16
each atom. The space group of the MoO3 is Pnma D2h
with site symmetries 2Ci (4);
Cs (4); C1 (6). Note that Ci (4) indicates that there are four equivalent atoms occupying
sites of symmetry Ci . The coefficient 2 shows the presence of two different and distinct
kinds of C1 site in this unit cell. Each can accommodate four equivalent atoms.
Using the correlation methods with a data combination of Tables 1-4, we predict
active IR and Raman modes, given as follows:
Γ = 8Ag + 8B1g + 4B2g + 4B3g + 4Au + 3B1u + 7B2u + 7B3u
(2.1)
where Ag ; B1g ; B2g ; B3g represents Raman-active modes, Au is an inactive mode for both
Raman and IR, B1u ; B2u ; B3u are infrared-active modes. Therefore, there are 24 Raman
active modes for orthogonal crystals MoO3 .
Table 1. Wyckoff site for atoms in MoO3
Symmetric position
No.
Wyckoff site
2Ci (4)
Ci (4)
a
Ci (4)
b
Cs (4)
c
Cs (4)
C1 (6)
C1 (6)
d
Atoms
Mo;O
95
Pham Van Hai and Nguyen Hong Minh Chau
Table 2. Symmetric group of MoO3
Symmetric position
Translation
′
Cs
A
Tx , Ty
A′′
Tz
′
Cs
A
Tx , Ty
′′
A
Tz
Atoms
Mo
O
f
ξ
8
4
f
ξ
24
12
tξ
2
1
2
1
Table 3. The correlations of atom Mo in MoO3 material
tξ
Ci
D2h
Cξ
Ag
1
2
A′
B1g
1
B2u
1
B3u
1
B2g
1
′′
1
A
B3g
1
Au
1
B1u
1
Table 4. The correlations of atom O in MoO3 material
t
Ci
D2h
Cξ
aξ
aA′
Ag
1
6
6
2
A′
B1g
1
6
6
B2u
1
6
6
B3u
1
6
6
B2g
1
3
0
′′
1
A
B3g
1
3
0
Au
1
3
0
B1u
1
3
0
ξ
f ξ = ntξ
8
4
24
12
aξ
2
2
2
2
1
1
1
1
aA′′
0
0
0
0
3
3
3
3
2.2.2. Experimental results
* Raman spectrum for MoO3
To compare with the theoretical calculation, we choose a MoO3 sample synthesized
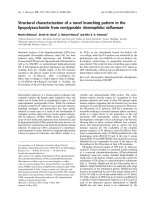
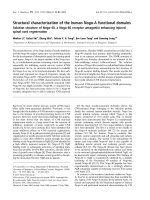
by the microwave-assisted method at 400◦ C as a reference sample. Figure 1 shows the
Raman spectrum of the MoO3 in the range from 80-1100 cm−1 . The spectrum shows
the peaks in mult- bands at around 82 cm−1 , 97 cm−1 , 116 cm−1 , 128 cm−1 , 157 cm−1 ,
197 cm−1 , 217 cm−1 , 244 cm−1 , 286 cm−1 , 336 cm−1 , 365 cm−1 , 378 cm−1 , 471 cm−1 ,
665 cm−1 , 817 cm−1 and 994 cm−1 , in good agreement with the characteristic peaks of
α-orthogonal MoO3 [16, 17]. Specifically, in the bands 600-1000 cm−1 , the strongest
96
A structural characterization of MoO3 prepared using three different methods
intensity peak is located at around 817 cm−1 , attributed to the stretching vibration of
Mo–O bonds (Ag mode) along the b axis of the MoO3 orthorhombic crystal structure
and symmetrical elasticity of oxygen atoms (B1g mode). The peak at 994 cm−1 position
(Ag , B1g ) corresponds to the asymmetric oscillation of the atomic oxygen atomic terminal,
which can be recognized as the stretching vibration of Mo–O bonds (Ag ) along the a
axis of the MoO3 orthorhombic crystal structure. The peak 665cm−1 (B2g , B3g ) is the
asymmetric elastic stretching modes of the demand Mo–O–Mo along the c-axis. In the
range of 400 - 600 cm−1 , the peak 471 cm−1 (Ag ) presents O–M–O stretching and bending.
At wavenumbers below 200 cm−1 , the peaks around 116 cm−1 , 128 cm−1 and 157 cm−1
originate from the translational (Tc ) rigid MoO4 chain mode (B2g ), the translational (Tc )
rigid MoO4 chain mode (B3g ) and the translational (Tb ) rigid MoO4 chain mode (Ag , B1g ).
The Raman peaks 197 cm−1 (B2g) contribute from O=Mo=O twisting modes. The peaks
at 378 cm−1 (B1g ) and 365cm−1 (Ag ) correspond to the O2=Mo=O2 scissor oscillation,
the peak at 336 cm−1 (Ag , B1g ) belongs to the O3MO3 bending. The peak at 286 cm−1 is
the oscillation of the double bond O=Mo= O corresponding to the O1=Mo=O1 wagging
B2g and B3g , respectively. The peaks at 244, 217 cm−1 correspond to the B3g , Ag modes,
respectively, due to the O2–Mo–O2 scissor.
Figure 1. The Raman spectrum of MoO3 and its mode assignment
Compared to a number of 24 possible Raman-active modes from the theoretical
calculation, we observed 20 Raman modes from our experimental data. This may result
97
Pham Van Hai and Nguyen Hong Minh Chau
from the fact that the remaining four modes have so low intensity that they cannot be
detected in the experimental setups. It should be noted that the Raman intensity is affected
by various factors. Given a certain condition of the laser wavelength, power and sample
concentration, the intensity of the Raman peak is still a complicated function of many
parameters [19],
Ik =
N(vk − v0 )4 Sk Q2k P
k
1 − exp −hcv
kT
where N is a proportionality constant, v0 is the exciting laser wavenumber, vk is the
wavenumber of the vibrational mode, c is the speed of light, h and k are Plancks and
Boltzmanns constants, T is the temperature, P is the exciting laser irradiance, and Q2k
is an amplitude factor. In principle, in order to detect the weak Raman intensity, we
can employ a higher laser power, increase the integration time or use different exciting
wavelengths to suppress the photolumninescence bands of the sample.
* The effect of preparation conditions on the structural characterization
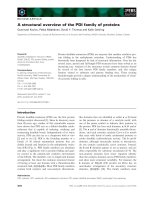
Figure 2a shows Raman scattering spectra of MoO3 at different experimental
conditions, including the sample using the as-prepared, hydrothermal and microwave
methods prepared at 400◦ C. As can be seen, all of three samples exhibit the
characteristic peaks of α-MoO3 , indicating that the nano-crystal MoO3 nano-materials
have successfully synthesized. However, at the same experimental conditions, the
intensity and FWHM of various peaks (at around 82cm−1, 217cm−1 and 471cm−1) in the
samples prepared by the hydrothermal method is relatively low compared to those in the
samples prepared by the as-prepared and microwave-assisted method. This result suggests
that the crystalline quality of MoO3 is improved in the two latter cases. In addition,
our result also indicates the microwave-assisted method provides the highest crystalline
quality. Figure 2b shows XRD of MoO3 samples corresponding to three methods as
mentioned above. It can be observed that all the MoO3 samples have the characteristic
peaks at 12.7◦ ; 23.4◦ ; 25.7◦ ; 27.4◦ ; 29.8◦ ; 33.7◦ ; 35.5◦ corresponding to the Miller plane,
such as (020), (110), (040), (021), (130), (111), (041), indicating a high crystallize quality
and a relatively large nanoparticle sizes of MoO3 [20].
We determine the approximate particle size of MoO3 from X-ray diffraction
diagram based on the full width the half maximum (FWMH) according to the Scherrer
0.89λ
˚ is the X-ray wavelength, β is the
formula with D =
, where λ (1.54 A)
β cos θ
line broadening at FWHM, and θ is the Bragg angle. In Table 5, we show the
average particle sizes for three different methods. Apparently, the hydrothermal method
produces the largest particles size, in contrast to the particle sizes prepared using the
microwave-assisted method. Our results show a good agreement with those obtained
from the analysis of Raman spectra.
98
A structural characterization of MoO3 prepared using three different methods
(a)
(b)
Figure 2. a) XRD pattern and (b) Raman spectrum of MoO3 synthesized by three
methods: as-prepared, hydrothermal and microwave methods.
Table 5. The average particle size of MoO3 prepared using different methods
Prepared by
2θ
(hkl)
β (in◦ )
β (rad)
D (nm)
As-prepared
23.4
110
0.29
0.0051
29
Hydrothermal
23.4
110
0.25
0.0043
34
23.45
110
0.47
0.0082
18
Microwave
* The effect of annealed temperature on the structural characterization
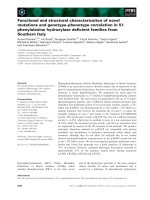
Because of the best crystallinity for the sample synthesized by the
microwave-assisted method, we choose it to further investigate the influence of
annealed temperatures on the structural properties of MoO3 .
(a)
Figure 3. a) Raman spectrum and b) XRD pattern of MoO3 synthesized by the
microwave method and calcined at several temperatures 300◦ C, 400◦ C, 500◦ C, 600◦ C
99
Pham Van Hai and Nguyen Hong Minh Chau
Figure 3 displays the Raman spectra and XRD for nanocrystal MoO3 annealed at
several distinct temperatures from 300 to 600◦ C. We observe peak intensities in the both
Raman and XRD data even at 300◦ C calcined temperature, that can be well indexed to the
α-orthorhombic structure with the lattice parameters and the unit cell volume were found
˚ b = 13.967 A,
˚ c = 3.710 A.
˚ However, the Raman and XRD peaks in
to be a = 4.00 A,
the sample calcined at 300◦ C are not clearly distinct as those in the sample calcined from
400◦ C to above. A further increase in the annealed temperatures allows the crystallite to
nucleate, develop along precise growth sites, and assemble orderly, thus, promoting high
crystalline samples.
3.
Conclusion
In this work, we have conducted research on produced MoO3 based on few distinct
approaches, including as-prepared, hydrothermal and microwave methods. We also
investigate the role of calcinated temperature on the phase formation of MoO3 . Here
is some conclusions draw: (i) the MoO3 materials have been successfully synthesized
using three simple strategies. All samples obtained show a good crystalline quality and
nanoparticles in the range 20-40 nm. (ii) The theoretical calculation according to the
group theory gives rise to 24 Raman active modes, in agreement with a majority number
of Raman modes obtained from the experimental results. Four missing modes in the
experimental data are Ag and B1g . (iii) At the same measurement parameters of Raman
and XRD, we find a better crystallinity in the sample prepared by the microwave-assisted
methods compared to those obtained from as-prepared and hydrothermal methods. (iv)
An investigation on the temperature dependence of the phase formation shows that
the MoO3 has a α-orthorhombic. At higher temperatures, there is an improvement of
crystallinity degree.
REFERENCES
[1]
[2]
[3]
[4]
[5]
[6]
[7]
[8]
[9]
[10]
100
Gaigneaux, E. M., Fukui, K. and Twasawa, Y., 2000. Thin Solid Films., 374, 49.
Lin, S. Y. et al., 2010. J. Sol-Gel Sci. Technol., 53, 51.
Manivel, A. et al., 2015. Mater. Res. Bull., 62, 184.
Xia, Y. C., Wu, C. S., Zhao, N. and Zhang, Y. H. Spongy, 2016. Mater. Lett., 171,
117.
Cheng, L., Shao, M. W., Wang, X. H. and Hu, H. B, 2009. Chem. Eur. J., 15, 2310.
Sharma, R. K. and Reddy, G. B., 2014. J. Alloy. Compound., 598, 177.
Schuh, K. et al., 2015. J. Solid State Chem., 119, 11792.
Ma, Y., Zhang, X., Yang, M. and Qi, Y. X., 2014. Mater. Lett., 136, 146.
Zhang, H. L. et al., 2015. Appl. Surf. Sci., 356, 294.
Chithambararaj, A., Sanjini, N. S., Velmathi, S. and Chandra, B. A., 2013. Phys.
Chem. Chem. Phys., 15, 14761.
A structural characterization of MoO3 prepared using three different methods
[11] Zhang, H. J., Gao, L. J. and Gong, Y. J., 2018. Electrochem. Commun., 52, 67.
[12] Yang Liu, Peizhong Feng, Zhang Wang, Xinyang Jiao and Farid Akhtar, 2017.
Scientific Reports, 7, 1845.
[13] Luc Huy Hoang et al., 2018. Materials Chemistry and Physics, 221, 197.
[14] Luc Huy Hoang, Nguyen Dang Phu, Heng Peng, Xiang-Bai Chen, 2016. Journal of
Alloys and Compounds, 744, 228.
[15] Luc Huy Hoang et al., 2016. Journal of Materials Science: Materials in Electronics,
27, 6452.
[16] Lupan, V Trofim, V Cretu, I Stamov, N N Syrbu, I Tiginyanu, Y K Mishra and R
Adelung., 2014. Journal of Physics D: Applied Physics, 47, 085302.
[17] Liu et al., 2009. Journal of Applied Physics, 105, 023513.
[18] Luc Huy Hoang et al., 2019. HNUE Journal of Science, 64, 45.
[19] Elena E. Zvereva, Artur R. Shagidullin, and Sergey A. Katsyuba, 2011. Journal of
Physical Chemistry A, 115, 63.
[20] Mauro Epifani, Patrizia Imperatori, Luciana Mirenghi, Monica Schioppa, Pietro
Siciliano, 2004. Chemistry of Materials, 16, 5495.
101