Fabrication and characterization of ag particles coated on Fe, Ni doped TiO2 used for photocatalytic application
Bạn đang xem bản rút gọn của tài liệu. Xem và tải ngay bản đầy đủ của tài liệu tại đây (405.6 KB, 11 trang )
14
Ha Noi Metroplolitan University
FABRICATION AND CHARACTERIZATION
OF AG PARTICLES COATED ON FE, NI DOPED TIO2 USED
FOR PHOTOCATALYTIC APPLICATION
Cao Khang Nguyen1, Hue Thi Tran1, Tran Chien Dang2*
1
Center for Nano Science and Technology, Hanoi national university of education
2
Hanoi University of Natural Resources and Environment
Abstract: In this paper, we fabricated Ni and Fe doped TiO2 thin film with different
doping percentages and fabricated Ag coated on Ni and Fe doped TiO2 thin film with
different doping percentages via the hydrothermal method. Characterized some physical
properties of Ni and Fe doped TiO2 thin film with different doping percentages and Ag
coated on Ni and Fe doped TiO2 thin film with different doping percentages.
Photocatalytic activity of Ni and Fe doped TiO2 and Ag coated on Ni and Fe doped TiO2
thin films was studied by photocatalytic degradation of methylene blue (MB) in aqueous
solution as a model pollutant under UV light irradiation. The result shows that 9% Fe
and Ni doped TiO2 have higher photocatalytic activity than other samples. We observed
that as the Fe and Ni dopant level increase the photocatalytic activity of the TiO2 samples
increases whereas the results of degradation of MB using the Ag particles coated on Fe
and Ni doped TiO2 samples indicate that coating Ag particles did not prove
photocatalytic activity of TiO2 thin films.
Keywords: Ag nanoparticles, phototatalytic activity, Ni and Fe doped TiO2 nanorods.
Email:
Received 15 October 2019
Accepted for publication 20 November 2019
1. INTRODUCTION
Among photocatalytic materials, titanium dioxide received a lot of interest because
titanium dioxide is a n-type semiconductor material with stable structure, large band gap
(about 3.2eV) so TiO2 does not absorb visible light. Moreover, the high recombination rate
of electron-hole pairs will also lead to its low photocatalytic efficiency [1,2]. The
improvement of light harvesting proprerties of TiO2 nanostructure material has become
significant research topics to extend the effective operating range to visible light. Doping
TiO2 nanomaterials with trasition metals such as Fe, Cr and Ni [1,3,4] could extend
Scientific Journal No35/2019
15
titanium dioxide’s light absorption to the visible spectrum and improve the separation
efficiency of photo-induced electrons and holes.
Up to now, lots of studies about transition metal and nobel metals applied in
decomposing organic substances have been reported [5-8]. Moreover, it should be noticed
that TiO2 doped with Fe prove higher photocatalytic activity in the experiments than that of
other 3d transition metals doping [8,9]. And it shows that Fe is a good dopant for
enhancing the photocatalytic activity of TiO2 that has been indicated in the references
through theoretical calculation.
Over the last few years, a lots of research were focused on using Ag to adjust TiO2
which is applied to many kinds of photocatalytic field [8], which due to the high efficiency
of electrone-hole separation by forming a Schottky barrier at the Ag-TiO2, thus improving
its photocatalytic activity [10]. Qui et al have proven that Ag/TiO2 displayed the highest
photocatalytic efficiency of degradating methylene blue (MB) under visible light
irradiation in ten types of doped catalysts.
In this work, we synthesized Fe, Ni-doped titanium dioxide thin film coated Ag
particle and characterized these catalytic properties by various measurements and method,
and estimate the photoactivity of the samples.
2. EXPERIMENTAL SETUP
The synthesis of pure TiO2 thin film: Firstly, 1ml TTIP was mixed with 20ml IPA then
this mixture was covered by food cover film plastic and stirred at ambient air and room
temperature for 60 minutes. The resultant sol after stirring should be transparent. Dropped
about 7 drops of solution at the center of the FTO substrates then it was rotated at high
speed in order to spread the coating materials by centrifugal force. The spin coater’s
parameters during the fabrication of thin films were set as: speed at 3000 rpm, acceleration
is 300 rpm/s and spin time is 30 s. After spin coating, the samples were put on a hot glass
plate at 80˚C for 10 mimutes (soft baking process) in order to eliminate residual solvent.
Subsequent annealing was done in a mufle furnace at 400 with a heating rate of
10˚C/minute and soak time of 2 hours, followed by natural cooling. Secondly, 0.6ml TTIP
was mixed with 25 ml distilled water and 25 ml hydrochloric acid HCl 36,56% to
approximately reach a total volume of 50 ml in a Teflon-lined stainless steel autoclauve
(50ml volume). The mixture was stirred for 45 minutes at ambient conditions (room
temperature, ambient air). Two pieces of FTO which was already covered by TiO2 thin
fims were placed at an angle against the wall of the Teflon-liner with the thin fim side
facing down. The hyrothermal synthesis was conducted at 20˚C - 165˚C for 12 hours in an
electric oven. At first, the temperature was increased from 20˚C - 165˚C for 75 minutes
16
Ha Noi Metroplolitan University
(2˚C/m), then the temperature was kept at 165˚C during 12 hours. After synthesis, the
autoclave was cooled to room temperature naturally which took approximately 4 hours.
The FTO substrate was taken out and rinsed extensively with distilled water and dried in
ambient air by a hair dryer. The synthesis of Fe doping on TiO2 films was conducted as
following: First, similar to synthesis TiO2 thin films, solution precursors were prepared
using TTIP and Iron (III) nitrate: Fe(NO3)3.9H2O dissolved in IPA. The Fe dopant
concentration was varied to 3, 6, 9 wt% Fe by adding Fe(NO3)3.9H2O. The solution was
mixed by stirring by magnetic stirrer for 60 minutes. Then Fe doping on TiO2 films were
fabricated by spin coating method by in the same way with pure TiO2 films. Subsequent
annealing was done in a mufle furnace at 400 with a heating rate of 10˚C/minute and soak
time of 2 hours, followed by natural cooling. After that, 25 ml deionized water was mixed
with 25 ml of concentrated hydrochloric acid (36.5% by weight). Fe also was added in this
solution by adding Fe(NO3)3.9H2O. The mixture was stirred at ambient conditions for 5
min before adding 0.6 ml of TTIP 97% then it was stirred for 45 minutes at ambient
conditions (room temperature, ambient air). Two pieces of FTO which were already
covered by TiO2 thin films were placed at an angle against the wall of the Teflon-liner with
the thin film side facing down. The hydrothermal synthesis was conducted at 20˚C - 165˚C
for 12 hours in an electric oven. At first, the temperature was increased from 20˚C - 165˚C
for 75 minutes (2˚C/m), then the temperature was kept at 165˚C during 12 hours. After
synthesis, the autoclave was cooled to room temperature naturally which took
approximately 4 hours. The FTO substrate was taken out and rinsed extensively with
distilled water and dried in ambient air by hair dryer. The next heating process is carried
out similarly to the heating process of synthesis of pure TiO2 nanorods. The synthesis Ni
doped TiO2 was conducted similarly to the procedure to synthesis Fe doped TiO2 with the
main chemical used for sol preparation were TTIP, Nickel (II) nitrate Ni(NO3)2.6H2O,
China as a precursor of TiO2 and nickel respectively and IPA as solvent. Initially, a
transparent sol was prepared by mixing TTIP and IPA and then stirring Ni(NO3)2.6H2O for
60 minutes. The Ni dopant concentration was varied to 3, 6, 9 wt% Ni by adding different
amount of Ni(NO3)2.6H2O. Then Ni doped on TiO2 films were fabricated by spin coating
method by the same way with pure TiO2 films. Subsequent annealing was done in a mufle
furnace at 400 with a heating rate of 10˚C/minute and soak time of 2 hours, followed by
natural cooling. The next step was growing the Ni doped TiO2 nanorods. This step
consisted of those steps which was conducted similiar to the steps which was used to
grown the Fe doped TiO2 nanorods. The synthesis of Ag particles coated Fe and Ni doped
TiO2 was made as following: Firstly, 0.12 g AgNO3 was added to 1ml distilled water. This
mixture was stirred for 10 minutes, then 5ml IPA was adding to it and stirred by magnetic
stirrer for 45 minutes. Coating 3 layers on the FTO substrate which was cover with Fe and
Ni doped TiO2 nanorods. After every layer, the samples were put on a hot glass plate at
Scientific Journal No35/2019
17
C for 10 mimutes (soft baking process) in order to eliminate residual solvent.
Subsequent annealing was done in a muffle furnace at 300 oC with a heating rate of
C/minute and soak time of 2 hours, followed by natural cooling.
3. RESULTS AND DISCUSSION
3.1. Morphological survey of TiO2 nanorods
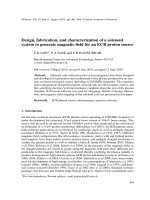
Figure 1a: Top-view SEM of TiO2 grown on FTO substrate (at 165 ˚C for 8hrs);
1b: Cross sectional view SEM image of TiO2 thin film (nanorods).
Figure 1a shows the SEM images of TiO2 nanorods when setting hydrothermal period
time for 8 hours. It can be seen that after 8 hours, the FTO surface was coated with shaped
tent-like grains which may be originated due to the mismatches of Titanium dioxide crystal
with FTO to minimize its surface energy [11]. M.Jithin et al also got the same result when
they studied about TiO2 nanorods and nanopillars [11].
Figure 1b shows the cross-sectional SEM image of TiO2 nanorod thin film. It is clear
that the nanorods are preferentially oriented normal to the substrate surface with the length
of approximately 3.86 µm. Beside, the thickness of TiO2 seed layers are about 1.1 μm
which is quite large.
3.2. X-ray diffraction pattern
To study the lattice constants of the samples, we used X-ray diffraction method to
analysis the structure of Fe/Ni doped TiO2 thin films (nanorods) with various doping
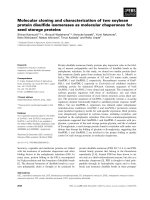
concentration 0%, 3%, 6%, 9%. Figure 2 illustrates the X- ray diffraction pattern of TiO2
thin films. This XRD pattern indicates that the crystalline phase of TiO2 is rutile. The rutile
phase was identified at 2θ of 36.10˚ (101), 41.26˚ (111), 56.59˚ (220), 62.92˚ (002)
respectively, corresponding to the standard XRD pattern (JCPCDS cards No.21-1276). A
anatase phase with diffraction peaks at 37.78˚ (00) appeared. It proves that the TiO2
18
Ha Noi Metroplolitan University
structure is rutile and this result also demonstrates that TiO2 nanorods after hydrothermal
process, the structure transfer from anatase phase to rutile phase. Figure 4a shows the X
ray diffraction pattern of Fe -doped TiO2 with various percentage of iron 3%, 6%, 9%
dopant level.
Figure 2: X-ray diffraction pattern of TiO2 nanorods grown on FTO substrate.
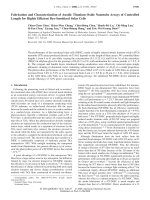
Figure 3a: X-ray diffraction pattern of Fe
doped TiO2 grown on FTO substrate with
various percentage 3%, 6%, 9% of Fe dopant
level (at 165 ˚C for 12 hrs).
Figure 3b: X-ray diffraction pattern of Ag
particles coated on Fe-doped TiO2 grown on
FTO substrate (at 165˚C for 12hrs).
It can obviously be seen that all samples exhibit the diffraction peaks of rutile phase
62.92˚ (002). Besides, for 3% Fe-doped TiO2 thin films, the peak at 62.92 ˚ (002) got
sharper and has higher intensity. For 3% Fe-doped TiO2 thin films and 6% Fe-doped TiO2
other peaks of rutile phase (R) were also observed clearly at 36.10˚ (101), 56.59˚ (220).
For 3% Fe-doped TiO2 thin films, a rutile phase with diffraction peaks at 36.10˚ (101),
54.36˚ (211) appeared, respectively, corresponding to the standard XRD pattern (JCPDS
files No.21-1276).
Scientific Journal No35/2019
19
Figure 3a shows that with increasing Fe dopant level, the rutile peaks become broader
and sharper, which suggests decreasing degree of crystallinity. Since Fe was added to TiO2
structure, it is clear that the accommodation of the former in the lattice, whether
substitutional or interstitial, results in structural distortion and the concomitant decrease in
crystallinity.
The X-ray diffraction patterns of the silver coated on Fe-doped TiO2 samples shown in
Figure 3b change slightly when comparing to that of Fe doped TiO2 samples. The patterns
show no diffraction peaks due to the silver species which might lead to the prediction that
the metal particles are well substitue on the TiO2 surface. Coating with Ag does not disturb
the crystal structure of TiO2 indicating that Silver did not covalently anchor into the
Titanium dioxide lattice Ag placed on the surface. There are no diffraction pattern
charactertics of the metals in the XRD patterns. Hence, these metal sites are predicted to be
below the limit of visibility of X-ray measurement.
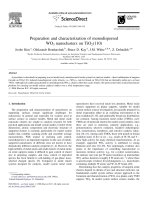
Figure 4a displays the X ray diffraction pattern of Ni-doped TiO2 with various Nikel
dopant level 3%, 6%, 9%. XRD shows that the TiO2 films with different Ni dopant level
deposited on FTO substrate are TiO2 rutile. Besides, the peak of anatase phase at 37.78˚
(004) appeared so this result is similar to samples were doped iron.
The X-ray diffraction patterns of the silver coated on Ni-doped TiO2 samples shown in
Figure 4b are similar to that of Ni doped TiO2 samples. To specific, it can be observed the
rutile phase peaks of TiO2 at 36.10˚ (101), 62.92˚ (002) and a peak at 37.78˚ (004) of
anatase phase.
Figure 4a: X-ray diffraction pattern of Nidoped TiO2 grown on FTO substrate (at 165o C
for 12h) with various Ni dopant level.
Figure 4b: X-ray diffraction pattern of Ag
particles coated on Ni-doped TiO2 grown on
FTO substrate samples (at 165˚C for 12 hrs).
20
Ha Noi Metroplolitan University
However, it can be seen that the intensity of the peak at 62.92˚ decreases corresponds
to an increase in the concentration of Ni doping. Besides, to the 9%Ni doped TiO2 samples,
a characteristic peak of silver presents which means we successful coating Ag particles on
thin films surface. Compared to the powder diffraction pattern, the (002) diffraction peaks
were significantly changed and some diffraction peaks including (110), (111), (210) and
(310) were absent, which indicates that the as-deposited film is highly oriented with
respect to the substrate surface and the TiO2 nanorods grow in the [001] direction with the
growth axis parallel to the substrate surface. The absence of diffraction peaks often found
in polycrystalline or powder samples is a strong indication that the nanorods are not only
aligned but also single crystals throughout their length and these results are similar to that
of the study of Bin Liu et al [12].
3.3. UV-VIS diffusive reflectance spectra
Figure 5a shows the corresponding UV-vis diffuse reflectance spectra of TiO2 and Ni
doped TiO2 thin films with various Ni dopant level. The 9% Ni doped TiO2 samples have
an absorption in the visible region between 400 and 600nm.
At lower Ni dopant level, the optical absorption edge of synthesized samples was only
shifted insignificantly, whereas when the Ni dopant level rose to higher 9%, a red- shift in
the optical absorption edge of samples toward the visible light region, at 600nm was
observed.
Figure 5a: UV-vis diffusive reflectance spectra
of TiO2 thin films (nanorods) and Ni doped TiO2
thin films with various level of dopant 3% (Ni3),
6% (Ni6), 9% (Ni9).
Figure 5b: UV-vis diffusive reflectance spectra
of TiO2 thin films (TiO2), 3% Ni doped TiO2
(Ni3) thin films and Ag particles coated on 3%
Ni doped TiO2 thin films (Ni3.Ag).
Figure 5b compares the UV-vis diffusive reflectance spectra of TiO2 thin films, 3% Ni
doped TiO2 thin films and Ag particles coated on 3% Ni doped TiO2 thin films. One can be
21
Scientific Journal No35/2019
seen that, there is no significant differences between the UV-vis diffusive reflectance
spectra of 3 thin films. In addition, we can conclude that at Ni dopant level 3%, the optical
absorption edge of synthesized samples Ni doped TiO2 thin films and Ni doped TiO2
coating Ag nanoparticles almost did not shift to visible region.
Figure 6a: UV-vis diffusive reflectance spectra
of TiO2 thin films (nanorods) and Fe doped TiO2
thin films with various level of dopant 3% (Fe3),
6% (Fe6), 9% (Fe9).
Figure 6b: UV-vis diffusive reflectance
spectra of 3% Fe.
At lower Fe dopant level, the optical absorption edge of synthesized sample was only
shifted insignificantly comparing to that of TiO2 thin films, whereas when the Fe dopant
level rose to higher 9%, a red- shift in the optical absorption edge of samples toward the
visible light region, at 600nm was observed. Figure 6b compares the UV-vis diffusive
reflectance spectra of 3% Fe doped TiO2 thin films and Ag particles coated on 3% Fe
doped TiO2 thin films. One can be seen that, there is no significant differences between the
UV-vis diffusive reflectance spectra of two samples.
3.4. Photocatalytic activity of synthesized ag particle coated on Fe/Ni doped
TiO2 in the degradation of methylene blue (MB)
Methylene blue (MB) was the model organic pollutant to estimate the photocatalytic
activity of the samples. Photoactivites of all synthesized samples were described as above.
Figure 7a shows that the MB degradation of 9% Fe doped TiO2 is the best. When the Fe
dopant level was increased the Fe doped TiO2 samples expressed higher photocatalytic
activity. In which, 3% Fe doped TiO2 structure showed the worst photocatalytic results.
When the Fe dopant level increased, the samples showed the better photocatalytic activity,
respectively. One of the explanation of this fact is the presence of Fe which could create
22
Ha Noi Metroplolitan University
the amount of active sites higher due to the formation of Fe-O-Ti bonds in the TiO2 crystal
lattice. The consequence of formation of defects on the catalyst morphology which play the
roles of a trap for preventing electron-hole recombination could be one of the reason of this
phenomenon.
Figure 7a: Decrease in MB concentration
irradiation time in the presence of various
photocatalysts with various Fe dopant level: 3%
Fe dopant level (Fe3), 6% Fe dopant level
(Fe6), 9% Fe dopant level (Fe9), Ag particles
coated on 3% Fe doped on TiO2 (Fe3.Ag), Ag
particles coated on 6% Fe doped on TiO2
(Fe6.Ag), Ag particles coated on 9% Fe doped
on TiO2 (Fe9.Ag).
Figure 7b: Decrease in MB concentration
irradiation time in the presence of various
photocatalyst with various Ni dopant level: 3%
Ni dopant level (Ni3), 6% Ni dopant level (Ni6),
9% Ni dopant level (Ni9), Ag particles coated
on 3% Ni doped on TiO2 (Ni3.Ag), Ag particles
coated on 6% Ni doped on TiO2 (Ni6.Ag), Ag
particles coated on 9% Ni doped on TiO2
(Ni9.Ag).
Besides, we noticed that the samples which were coated Ag particle have expressed
the worse photocatalytic activity than that of the samples without Ag nano particles.
Figure 7b shows the data of the methylene blue degradation experiment under UV
light in the presence of Ni-doped TiO2 thin films with different Ni dopant level and Ag
nano particles coated on Ni-doped TiO2 thin films. It can be clearly seen that the
degradation rate of MB decreased with the increase of Ni concentration in TiO2 thin films.
The 9% Ni doped TiO2 thin film shows the highest degradation rate values under UV light.
Similar to the samples which are doped Fe and coated Ag particles, the degradation rate
values of the Ni doped TiO2 thin films coating silver particles are low. It might prove that
the concurrency of doping Ni/Fe and coating silver particles might not improve the
photocatalytic activity of TiO2 thin films (nanorods). Photocatalytic results of the Ag
coated on Ni doped TiO2 samples was not reasonable. It could be because of the
inaccuracy of the equipment.
Scientific Journal No35/2019
23
4. CONCLUSION
We have successfully fabricated Ni and Fe doped TiO2 thin film with different doping
percentages and fabricated Ag coated on Ni and Fe doped TiO2 thin film with different
doping percentages: 3%, 6%, 9% dopant level. Characterized some physical properties of
Ni and Fe doped TiO2 thin film with different doping percentages and Ag coated on Ni and
Fe doped TiO2 thin film with different doping percentages. Photocatalytic activity of Ni
and Fe doped TiO2 and Ag coated on Ni and Fe doped TiO2 thin films had been studied by
photocatalytic degradation of methylene blue (MB) in aqueous solution as a model
pollutant under UV light irradiation. 9% Fe and Ni doped TiO2 have higher photocatalytic
activity than other samples. We observed that as the Fe and Ni dopant level increase the
photocatalytic activity of the TiO2 samples increases whereas the results of degradation of
MB using the Ag particles coated on Fe and Ni doped TiO2 samples indicate that coating
Ag particles did not prove photocatalytic activity of TiO2 thin films.
REFERENCES
1.
Dholam, R., et al., “Hydrogen Production by Photocatalytic Water-Splitting Using Cr- or FeDoped TiO2 Composite Thin Films Photocatalyst”, - International Journal of Hydrogen
Energy, 2009. 34: pp.5337-5346.
2.
Khan, A., S. Woo, and O. Yang, “Hydrothermally stabilized Fe(III) doped titania active under
visible light for water splitting reaction”, International Journal of Hydrogen Energy, 2008. 33:
pp.5345-5351.
3.
Niishiro, R., H. Kato, and A. Kudo, “Nickel and Either Tantalum or Niobium-Codoped TiO2
and SrTiO3 Photocatalysts with Visible-Light Response for H2 or O2 Evolution from
Aqueous Solutions”, - Physical chemistry chemical physics: PCCP, 2005. 7: p.2241
4.
Cong, Y., et al., Preparation, “Photocatalytic Activity, and Mechanism of Nano-TiO2 CoDoped with Nitrogen and Iron (III)”, - The Journal of Physical Chemistry C, 2007. 111(28):
pp.10618-10623.
5.
Ambrus, Z., et al., “Synthesis, Structure and Photocatalytic Properties of Fe(III)-Doped TiO2
Prepared From TiCl3”, - Applied Catalysis B: Environmental, 2008. 81: pp.27-37.
6.
Li, Z., et al., “Effect of Fe-doped TiO2 nanoparticle derived from modified hydrothermal
process on the photocatalytic degradation performance on methylene blue”, - Journal of
hazardous materials, 2008. 155: p.590-4.
7.
Sun, T., et al., “High photocatalytic activity of hydrogen production from water over Fe doped
and Ag deposited anatase TiO2 catalyst synthesized by solvothermal method”, - Chemical
Engineering Journal, 2013. 228: pp.896-906.
8.
Choi, W., A. Termin, and M.R. Hoffmann, “The Role of Metal Ion Dopants in Quantum-Sized
TiO2: Correlation between Photoreactivity and Charge Carrier Recombination Dynamics”, The Journal of Physical Chemistry, 1994. 98(51): pp.13669-13679.
24
9.
Ha Noi Metroplolitan University
Ma, J., et al., Enhanced inactivation of bacteria with silver-modified mesoporous TiO2 under
weak ultraviolet: irradiation, - Microporous and Mesoporous Materials, 2011. 144: pp.97-104.
10. Mohanan Nair, J., et al., Growth, Mechanism and Properties of TiO2 Nanorods Embedded
Nanopillar: Evidence of Lattice Orientation Effect, - Superlattices and Microstructures,
2017. 109.
11. Liu, B. and E. Aydil, “Growth of Oriented Single-Crystalline Rutile TiO2 Nanorods on
Transparent Conducting Substrates for Dye-Sensitized Solar Cells”, - Journal of the American
Chemical Society, 2009. 131: pp.3985-90.
CHẾ TẠO VÀ NGHIÊN CỨU TÍNH CHẤT CỦA VẬT LIỆU TiO2
PHA TẠP SẮT VÀ NIKEN CÓ PHỦ NANO BẠC
ỨNG DỤNG CHO QUANG XÚC TÁC
Tóm tắt: Trong bài báo này, chúng tôi chế tạo màng mỏng titan ô xít (TiO2) pha tạp
niken (Ni) và sắt (Fe) với tỷ lệ pha tạp khác nhau sau đó phủ hạt nano bạc bằng phương
pháp thủy nhiệt. Nghiên cứu một số tính chất vật lý của chúng. Hoạt tính quang xúc tác
của TiO2 pha tạp Ni và Fe có phủ Ag được nghiên cứu bằng cách phân hủy quang xúc tác
dung dịch xanh methylen (MB) dưới dạng chất ô nhiễm khi chiếu tia cực tím. Kết quả cho
thấy TiO2 pha tạp 9% Fe và Ni có hoạt tính xúc tác quang cao hơn các mẫu khác. Chúng
tôi còn nhận thấy rằng khi nồng độ Fe và Ni tăng lên thì tính chất quang xúc tác của mẫu
tăng lên trong khi kết quả phân hủy MB của các mẫu có phủ nano Ag cho thấy tính quang
xúc tác các mẫu này không tăng.
Từ khóa: Hạt nano Ag, hoạt động quang xúc tác, màng TiO2 tạp Ni và Fe.