Shallow crust structure of the Büyük Menderes graben through an analysis of gravity data
Bạn đang xem bản rút gọn của tài liệu. Xem và tải ngay bản đầy đủ của tài liệu tại đây (3.05 MB, 11 trang )
Turkish Journal of Earth Sciences
Turkish J Earth Sci
(2018) 27: 421-431
© TÜBİTAK
doi:10.3906/yer-1712-6
/>
Research Article
Shallow crust structure of the Büyük Menderes graben through an analysis of gravity data
1,
2
1
F. Figen ALTINOĞLU *, Murat SARI , Ali AYDIN
Department of Geophysical Engineering, Faculty of Engineering, Pamukkale University, Denizli, Turkey
2
Department of Mathematics, Faculty of Arts and Science, Yıldız Technical University, İstanbul, Turkey
1
Received: 07.12.2017
Accepted/Published Online: 17.07.2018
Final Version: 30.11.2018
Abstract: The Büyük Menderes is one of the most important geostructural features of highly seismically active western Anatolia, Turkey.
This article aims to analyze the geological features and the shallow crust structure of the Büyük Menderes graben. To achieve this,
six different edge detection filters and a 3D inversion method were applied to the Bouguer gravity data to detect new lineaments and
shallow crust topographies. A renewed fault map of the Büyük Menderes graben is the significant contribution of the present study. New
lineaments were detected in the western, southeastern, and northern parts of the region, where intense seismicity was observed. The
basement, the upper-lower crust undulation, and their relations were analyzed in detail. The maximum sediment thickness was defined
as 4.1 km. The subsurface depths are increasing in N-S and W-E directions. The new determined lineaments may be a topic of future
research to warrant attention.
Key words: Basement undulation, upper-lower crust undulation, Büyük Menderes, lineament, shallow basement
1. Introduction
Western Anatolia is a tectonically complex, seismically
active, lithospheric extension and thinning region.
The mainly E-W trending Büyük Menderes and Gediz
grabens are the most specific structures of the region. The
active tectonics in western Anatolia are controlled by the
synergic movement of the Eurasian, African, and Arabian
plates (Figure 1). The age and origin of this extension
mechanism are debatable and have been explained by the
following different models: (a) the tectonic escape model
(Dewey and Şengör, 1979; Şengör et al., 1985); (b) the
back-arc spreading model (McKenzie, 1972; Le Pichon
and Angelier, 1979); (c) the orogenic collapse model
(Seyitoğlu et al., 1992; Seyitoğlu and Scott, 1996); (d) the
episodic model (Koçyiğit et al., 1999; Bozkurt and Sözbilir,
2004, 2006).
Mainly the E-W and the NE-SW trending Neogene
to Quaternary continental basins occurred in the region
under a N-S directional extension regime (Şengör et al.,
1985; Yılmaz et al., 2000). The Gediz and Büyük Menderes
grabens are characterized by Miocene detachment faulting
and core-complex formation, and high angle normal
faulting controlled the Plio-Quaternary graben floor
fillings with 140 km in length and 2.5–14 km in width,
localized to the north and the south by the Menderes
Massif metamorphic complex (Yilmaz et al., 2000; Sözbilir,
2001; Bozkurt and Sözbilir, 2004, 2006; Çiftçi and Bozkurt,
2009).
Many geophysical studies carried out by various
authors (Sarı and Şalk, 2002, 2006; Göktürkler et al., 2003;
Pamukçu and Yurdakul, 2008; Işık and Şenel, 2009; Çifçi
et. al., 2011; Akay et al., 2013; Altınoğlu and Aydın, 2015;
Bayrak et al., 2017; Çubuk-Sabuncu et al., 2017) were
conducted on western Anatolia, including the Büyük
Menderes graben region. Many of them revealed the 2D
or 3D basement depths (Sarı and Şalk, 2002, 2006; Işık and
Şenel, 2009), and Göktürkler et al. (2003) revealed the 2D
crust model for a profile including important grabens of
western Anatolia, as well as the Büyük Menderes graben.
However, to the best of our knowledge, to determine
the detailed structural features, mapping in the whole
graben has not been studied in detail yet. Differently from
previous studies, we have estimated both the basement
and upper/lower crust boundaries and explored a new
lineament map of the Büyük Menderes graben area by
using gravity data. Determination of tectonic structures
of a region is of importance since it provides information
for researchers on seismicity, industrial material searches,
and geothermal potentiality of that region. In this respect,
this study aims to produce updated structural features of
the Büyük Menderes basin (Figure 1) and its shallow crust
interface topographies. Thus, some new lineaments in the
*Correspondence:
This work is licensed under a Creative Commons Attribution 4.0 International License.
421
ALTINOĞLU et al. / Turkish J Earth Sci
24
28
32
36
40
44
Eurasian
42
42
NE
AF
NAF
40
40
STUDY
FIELD
38
Anatolian Block
F
EA
38
36
36
Arabian Plate
38.00
EF
Selçuk
Lattitude (Degree)
37.90
Kuyucak
Ortaklar
Kuşadası
KSFZ
İğdecik
Hasköy
BMGDF
Nazilli
Germencik
Sultanhisar
AYDIN
37.80
KRCF
Koçarlı
BDF
Söke
37.70
Davutlar
SKF
Bozdoğan
Çine
37.60
37.50
27.00
27.20
27.40
27.60
27.80
28.00
28.20
28.40
28.60
Longitude (Degreee)
Figure 1. Simplified tectonic map of Anatolian region and study area. NAF: North Anatolian Fault, EAF: East Anatolian Fault, NEAF:
North East Anatolian Fault, BMGDF: Büyük Menderes Graben Detachment Fault, EF: Efes Fault, KSFZ: Kuşadası Fault Zone, SKF: Söke
Fault, BDF: Bozdoğan Fault, KRCF: Karacasu Fault, CF: Çine Fault.
Büyük Menderes graben were discovered by using edge
detection methods. Some of these methods were also used
by the authors to investigate the Denizli graben, located at
the westward continuation of the Büyük Menderes graben
in western Anatolia (Altınoğlu et al., 2015).
2. Gravity surveys
Gravity anomalies have been used as a powerful tool for
geological mapping (Nabighian et al., 2005; Gout et al.,
2010; Uieda and Barbosa, 2012; Guo et al., 2014; Wang et
al., 2014; Chen et al., 2015; Ali et al., 2017; Wang, 2017).
To define the linear features and the crustal structure of
the basin, the Bouguer gravity anomaly data provided by a
joint study of the General Directorate of Mineral Research
and Exploration of Turkey (MTA) and the Turkish
Petroleum Corporation (TPAO) were used. The data were
taken at station spacing of 250–500 m with accuracy of 0.1
mGal and then the data were gridded over areas of 1 km2.
422
The contour interval of the map shown in Figure 2 is 2
mGal. The gravity anomaly values range from –35 to 75
mGal with an increasing regional tendency from the east
to the west and the minimum values emerged as a result of
the crust thinning and thickening of sedimentary basins.
Sedimentary basins are generally related to low gravity
values based on the low-density sediments in them (Sarı
and Şalk, 2002). Positive gravity anomalies monitored at
the west of the graben are interpreted as a positive anomaly
belt attendance of a concave side of island arc related to the
uplifted mantle (Rabinowitz and Ryan, 1970; Özelçi 1973).
To obtain the lineament map of the study area, some
edge detection filters were applied to Bouguer gravity
anomaly data by using the computer code given by Arısoy
and Dikmen (2011). New detailed basement and upperlower crust boundaries were produced with the use of a
computer code presented by Gómez-Ortiz and Agarwal
(2005). To present the seismic activity of the faults or to
ALTINOĞLU et al. / Turkish J Earth Sci
Latitude (Degree)
38.00
37.90
37.80
mGal
75
65
55
45
35
25
15
5
-5
-15
-25
-35
-45
-55
-65
28.60
Selçuk
Kuşadası
Nazilli
Sultanhisar
Ortaklar
Aydın
Söke
37.70
Bozdoğan
37.60
37.50
27.00
27.20
27.40
27.60
28.00
27.80
Longitude (Degree)
28.20
28.40
Figure 2. Bouguer gravity anomaly map of the study area (contour interval is 10 mGal).
see if the probable detected new lineament was seismically
active, the epicentral distribution of the earthquakes that
occurred in the region was produced in terms of the data
from 2000 to 2017 ( />zeqdb/).
3. Methods
The power spectrum method developed by Spector and
Grant (1970), which also utilizes 2D Fourier transform of
potential field data, was used to detect the average depths
of the crust layers.
Many studies in the literature (Hahn et al., 1976;
Connard et al., 1983; Bosum et al., 1989; Garcia-Abdeslem
and Ness, 1994) used the power spectrum method applied
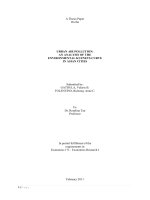
in the current study. Figure 3 clearly reveals that three
distinct layers were discovered in the study area.
The Parker–Oldenburg algorithm, based on the
relationship between the Fourier transform of the gravity
data and the sum of the interface topography’s transform
(Parker, 1972; Oldenburg, 1974), was used to enhance
the three-dimensional interface topography. The Fourier
transform given in Eq. (1) is used to calculate the gravity
anomaly of an uneven homogeneous layer.
(1)
Here, f [∆ g (x)], G, k, g, z1 (x), and z0 indicate the
Fourier transform of the gravity anomaly, gravitational
constant, wave number, density of the layer, depth to
interface, and average depth of horizontal interface,
respectively. In the equation, density interface topography
is calculated from ∆ g (x) and z0 in the iteration process. In
the iteration algorithm, either z1=0 or an appropriate value
is designated for the right part of the formula. The first
estimation of the topographical conditions was enhanced
by inverse Fourier transform. This topography parameter
is considered to determine the right-hand side of the
formula. The result obtained from the first prediction
is used to reach the second topography approach. The
iteration process continues until the convergence criterion
is reached. To investigate the features of the study region,
some edge detection techniques were also considered here
more closely.
Edge detection of a source body is a useful tool in the
interpretation of gravity anomalies, which were widely
used in exploration technologies for mineral resources
(Mickus, 2008; Chen et al., 2015), geothermal exploration
(Saibi et al., 2006; Ali et al., 2015; Nishijima and Naritomi,
2015), and mapping geological boundaries such as
faults, buried faults, and lineaments (Rapolla et al., 2002;
Ardestani, 2005; Ardestani and Motavalli, 2007; Kumar et
al., 2009; Oruç, 2010; Cheyney et al., 2011; Naouali et al.,
2011; Ma and Li, 2012; Ekinci et al., 2013; Hoseini et al.,
2013; Alvandi and Rasoul, 2014; Wang et al., 2015; Zuo
and Hu, 2015; Alvandi and Babaei, 2017; Elmas et al.,
2018).
3.1. Horizontal gradient magnitude
The horizontal gradient
magnitude (HGM) method is
a useful tool in determining the surface or buried faults
(Cordell and Grauch, 1985; Hornby et al., 1999; Phillips,
!
∂g ! et al.,
∂g 2006;
2000;
Saibi et al.,
Rapolla et al., 2002; Lyngsie
HG =
+
2006). HGM was first given by
and Grauch (1985):
∂xCordell∂y
HG =
∂g
∂x
!
+
∂g
∂y
!
(2)
𝜕𝜕𝜕𝜕
𝜕𝜕𝜕𝜕
Here, 𝜕𝜕𝑥𝑥 and 𝜕𝜕𝜕𝜕 are the first-order derivatives of the
gravity field in the orthogonal directions.
HGM is very effective in highlighting both shallow and
𝜕𝜕𝜕𝜕
deep𝜕𝜕𝜕𝜕geological bodies. The maximum values of the HGM
!
!
!
𝜕𝜕𝜕𝜕 indicate
𝜕𝜕𝜕𝜕the
are located at abrupt changes of 𝜕𝜕𝜕𝜕
density and
+
+
𝐴𝐴 𝑥𝑥, 𝑦𝑦 =
source edges (Cordell, 1979; Cordell
Grauch, 𝜕𝜕𝜕𝜕
1985,
𝜕𝜕𝜕𝜕 and 𝜕𝜕𝜕𝜕
Cooper and Cowan, 2004).
𝐴𝐴 𝑥𝑥, 𝑦𝑦 =
𝜕𝜕𝜕𝜕
𝜕𝜕𝜕𝜕
!
+
∅ = tan
𝜕𝜕𝜕𝜕
𝜕𝜕𝜕𝜕
!!
!
+
𝜕𝜕𝜕𝜕
𝜕𝜕𝜕𝜕
!
𝜕𝜕𝜕𝜕
𝜕𝜕𝜕𝜕
423
𝜕𝜕𝜕𝜕
∅ = tan!!
𝜕𝜕𝜕𝜕
𝜕𝜕𝜕𝜕
𝜕𝜕𝜕𝜕
!
𝜕𝜕𝜕𝜕
𝜕𝜕𝜕𝜕
+
𝜕𝜕𝜕𝜕
!
𝜕𝜕𝜕𝜕
Ln (E)
ALTINOĞLU et al. / Turkish
𝜕𝜕𝜕𝜕 J Earth Sci 𝜕𝜕𝜕𝜕 !
𝜕𝜕𝜕𝜕 !
𝜕𝜕𝜕𝜕 !
+
+
𝐴𝐴 𝑥𝑥, 𝑦𝑦 =
𝜕𝜕𝜕𝜕
𝜕𝜕𝜕𝜕 𝜕𝜕𝜕𝜕 𝜕𝜕𝜕𝜕
𝜕𝜕𝜕𝜕
𝜕𝜕𝜕𝜕
!!
11
∅ = tan
!
10
𝜕𝜕𝜕𝜕 ! 𝜕𝜕 𝑔𝑔
𝜕𝜕𝜕𝜕 !
+
9
!
𝜕𝜕𝑧𝑧𝜕𝜕𝜕𝜕
𝜕𝜕𝜕𝜕
h1=28 km
∅ = tan!!
!
8
𝜕𝜕𝜕𝜕
𝜕𝜕𝜕𝜕 !
𝜕𝜕𝜕𝜕 !
𝜕𝜕𝜕𝜕+ !
𝜕𝜕𝜕𝜕 !
+
𝐴𝐴 𝑥𝑥, 𝑦𝑦 =
7
+
𝜕𝜕𝜕𝜕𝜕𝜕𝜕𝜕𝜕𝜕𝜕𝜕𝜕𝜕𝜕𝜕 𝜕𝜕𝜕𝜕
𝜕𝜕𝜕𝜕𝜕𝜕𝜕𝜕𝜕𝜕𝜕𝜕
h2=9 km
6
(5)
𝜕𝜕𝜕𝜕
!!
∅ = tan
5
!
!
The tilt angle is thus
𝜕𝜕𝜕𝜕 obtained
𝜕𝜕𝜕𝜕 from the second vertical
h3=3 km
4
+ ! 𝑔𝑔
𝜕𝜕𝜕𝜕 the𝜕𝜕HGM.
𝜕𝜕𝜕𝜕 Oruç (2010) remarked
gradient (
) and
3
!
𝜕𝜕𝑧𝑧
!!
that
the
practical
utility
of
the
technique
is demonstrated to
2
∅ = tan
!
𝜕𝜕𝜕𝜕𝜕𝜕 !resolution
𝜕𝜕𝜕𝜕𝜕𝜕
𝜕𝜕𝜕𝜕
improve
the
gravity
and
emphasized
the effects
!
!
1
+
𝑇𝑇𝑇𝑇 =
𝜕𝜕𝜕𝜕
𝜕𝜕𝜕𝜕
𝜕𝜕𝜕𝜕
!! 𝜕𝜕𝜕𝜕boundaries
+
of the
geological
for
the
structural
framework.
𝜕𝜕𝜕𝜕
∅ = tan
𝜕𝜕𝜕𝜕𝜕𝜕𝜕𝜕
𝜕𝜕𝜕𝜕𝜕𝜕𝜕𝜕
0
!
0
0.01 0.02! 0.03 0.04! 0.05 0.06 0.07 0.08 0.09 0.10
3.4. Tilt derivative 𝜕𝜕𝜕𝜕 !
𝜕𝜕𝜕𝜕
∂g
∂g Wavenumber (k)
+𝜕𝜕 !calculated
First,
Verduzco
et
al.
(2004)
the HGM of the tilt
𝑔𝑔
𝜕𝜕𝜕𝜕
𝜕𝜕𝜕𝜕
HG =
+
∂x spectrum
∂y of the Bouguer gravity anomaly
!
Figure 3. The power
angle
(TA),
given
by:
𝜕𝜕𝑧𝑧
∅ = tan!!
of the study area.
!𝜕𝜕𝜕𝜕 !
!
𝜕𝜕𝜕𝜕 !
𝜕𝜕𝜕𝜕𝜕𝜕 ! 𝜕𝜕𝜕𝜕+ 𝜕𝜕𝜕𝜕𝜕𝜕+ ! 𝜕𝜕𝜕𝜕
𝜕𝜕𝜕𝜕
𝜕𝜕𝜕𝜕
𝜕𝜕𝜕𝜕𝜕𝜕𝜕𝜕
𝜕𝜕𝜕𝜕𝜕𝜕𝜕𝜕
+
𝑇𝑇𝑇𝑇 =
𝜕𝜕𝜕𝜕
cos 𝜃𝜃 = 𝜕𝜕𝜕𝜕
(6)
𝐴𝐴
3.2. Analytic signal
𝜕𝜕 !the
𝑔𝑔 total horizontal derivative
The maximum values of
!
The𝜕𝜕𝜕𝜕
analytic signal tool was first applied to potential field
𝜕𝜕𝑧𝑧
!!
of the
angle represent the source body edges (Cooper
∅ =tilttan
data𝜕𝜕𝜕𝜕by Nabighian (1972). The approach is utilized to
and Cowan, 2006). ! 𝜕𝜕𝜕𝜕 ! ! 𝜕𝜕𝜕𝜕 !
𝜕𝜕𝜕𝜕𝜕𝜕 ! 𝜕𝜕𝜕𝜕𝜕𝜕
define the magnitude of the total gradient of the magnetic
+!
𝜕𝜕𝜕𝜕
𝜕𝜕𝜕𝜕𝜕𝜕𝜕𝜕
++ 𝜕𝜕𝜕𝜕
= map 𝜕𝜕𝜕𝜕𝜕𝜕𝜕𝜕𝜕𝜕𝜕𝜕
3.5.𝑇𝑇𝑇𝑇
Theta
!
! given as:
𝜕𝜕𝜕𝜕
𝜕𝜕𝜕𝜕
𝜕𝜕𝜕𝜕
anomaly and ∂g
mathematically
!!
𝜕𝜕𝜕𝜕
𝜕𝜕𝜕𝜕
∂g
𝐻𝐻𝐻𝐻𝐻𝐻
=
tanh
The theta map is a combination of the HGM and the
HG =
+
!
cos 𝜃𝜃signal,
= described
analytic
𝜕𝜕𝜕𝜕et !al. (2005) to use for
∂x
∂y
𝐴𝐴𝜕𝜕𝜕𝜕by Wijns
+
!
!
!
𝜕𝜕𝜕𝜕
𝜕𝜕𝜕𝜕
edge detection. It is given as:
𝜕𝜕𝜕𝜕
𝜕𝜕𝜕𝜕
𝜕𝜕𝜕𝜕
+
+
𝐴𝐴 𝑥𝑥, 𝑦𝑦 =
𝜕𝜕𝜕𝜕
𝜕𝜕𝜕𝜕
𝜕𝜕𝜕𝜕
𝜕𝜕𝜕𝜕𝜕𝜕 ! ! 𝜕𝜕𝜕𝜕𝜕𝜕 !!
(3)
𝜕𝜕𝜕𝜕 +
𝜕𝜕𝜕𝜕
𝑇𝑇𝑇𝑇 =
𝜕𝜕𝜕𝜕𝜕𝜕𝜕𝜕 + 𝜕𝜕𝜕𝜕
𝜕𝜕𝜕𝜕
𝜕𝜕𝜕𝜕
Here, f is the first vertical derivative (
) of the
𝜕𝜕𝜕𝜕
!!
cos
𝜃𝜃
=
𝐻𝐻𝐻𝐻𝐻𝐻 = tanh
𝐴𝐴
gravity
𝜕𝜕𝜕𝜕 field. Similar to the horizontal gradient, it generates
(7)
!
𝜕𝜕𝜕𝜕
𝜕𝜕𝜕𝜕 !
maximum
values over source edges (Nabighian, 1972,
+
Here,
|A|
is
the
analytic
signal amplitude. The
𝜕𝜕𝜕𝜕
𝜕𝜕𝜕𝜕
𝜕𝜕𝜕𝜕
𝜕𝜕𝜕𝜕
1984; Roest et al., 1992). 𝜕𝜕𝜕𝜕
maximum
values
are
observed
within
the structure even
!
!
𝜕𝜕𝜕𝜕
𝜕𝜕𝜕𝜕
∅ = tan!!
as
minimum
values
are
seen
along
the
source body edges
+
3.3. Tilt angle
𝜕𝜕𝜕𝜕
!
!
𝜕𝜕𝜕𝜕
𝜕𝜕𝜕𝜕
𝜕𝜕𝜕𝜕
𝜕𝜕𝜕𝜕
in
the
theta
map.
𝜕𝜕𝜕𝜕
The tilt angle technique, first
+ proposed by Miller and Singh
cos 𝜃𝜃= =
𝐻𝐻𝐻𝐻𝐻𝐻
tanh!! 𝐴𝐴
𝜕𝜕𝜕𝜕!
𝜕𝜕𝜕𝜕
(1994), was applied𝜕𝜕𝜕𝜕
to the
gravity
The! following ratio
3.6.Hyperbolic tilt angle
𝜕𝜕𝜕𝜕 ! data.𝜕𝜕𝜕𝜕
𝜕𝜕𝜕𝜕 !
𝜕𝜕𝜕𝜕 !
= zero values
+ of the+tilt angle map, which
𝐴𝐴 𝑥𝑥, 𝑦𝑦 the
The hyperbolic tangent (HTA)+function was expressed by
constitutes
𝜕𝜕𝜕𝜕
𝜕𝜕𝜕𝜕
𝜕𝜕𝜕𝜕
𝜕𝜕𝜕𝜕
𝜕𝜕𝜕𝜕
Cooper and Cowan (2006) as:
show the boundary of the bodies. The equation was given
by Miller and Singh (1994) as follows:
𝜕𝜕𝜕𝜕
𝜕𝜕𝜕𝜕
!!
𝐻𝐻𝐻𝐻𝐻𝐻 = tanh
𝜕𝜕 ! 𝑔𝑔
𝜕𝜕𝑧𝑧 !
𝜕𝜕𝜕𝜕 !
𝜕𝜕𝜕𝜕 !
∅ = tan!!
+
𝜕𝜕𝜕𝜕
𝜕𝜕𝜕𝜕
𝜕𝜕𝜕𝜕
𝜕𝜕𝜕𝜕𝜕𝜕𝜕𝜕 !
𝜕𝜕𝜕𝜕 !
∅ = tan!!
(8)
+
𝜕𝜕𝜕𝜕𝜕𝜕𝜕𝜕!
𝜕𝜕𝜕𝜕𝜕𝜕𝜕𝜕
!
The
maximum
value
of
the
HTA
generates
the location
𝜕𝜕𝜕𝜕
𝜕𝜕𝜕𝜕
+
of the source body edges.
𝜕𝜕𝜕𝜕
𝜕𝜕𝜕𝜕
(4)
Here, indicates! the tilt angle
parameter.
𝜕𝜕𝜕𝜕𝜕𝜕
𝜕𝜕𝜕𝜕𝜕𝜕 !
The
tilt
angle
is
positive
over
a
source and zero values
+
𝑇𝑇𝑇𝑇 =
𝜕𝜕𝜕𝜕 edges (Miller
𝜕𝜕𝜕𝜕
reflect the source
and
Singh, 1994). This
𝜕𝜕 ! 𝑔𝑔
method is useful in enhancing
edges
of
anomalies for both
𝜕𝜕𝑧𝑧 !
!!
∅
=
tan
shallow and deep sources. The tilt angle of the first vertical
!
!
𝜕𝜕𝜕𝜕a new
gradient of the gravity𝜕𝜕𝜕𝜕
data provides
tilt angle. It was
+
!
𝜕𝜕𝜕𝜕𝜕𝜕𝜕𝜕
𝜕𝜕𝜕𝜕𝜕𝜕𝜕𝜕 as:
first used by Oruç𝜕𝜕𝜕𝜕
(2010)
and
𝜕𝜕𝜕𝜕is!given
+
𝜕𝜕𝜕𝜕
𝜕𝜕𝜕𝜕
cos
𝜃𝜃
=
424
𝐴𝐴
𝑇𝑇𝑇𝑇 =
𝜕𝜕𝜕𝜕𝜕𝜕
𝜕𝜕𝜕𝜕
!
+
𝜕𝜕𝜕𝜕𝜕𝜕
𝜕𝜕𝜕𝜕
!
4. Results
and discussion
By using the Bouguer gravity anomaly data, the linear
features and the 3D subsurface undulation of the Büyük
Menderes graben and surroundings were carefully studied
in the present work. The Büyük Menderes graben has E-W
trending
negative gravity anomalies. The gravity anomaly
values of western Anatolia get higher from the east to the
west (Sarı and Şalk 2002). It is understood, as pointed out
ALTINOĞLU et al. / Turkish J Earth Sci
by Sarı and Şalk (2002), that the decreasing of the anomaly
values from west to east is related to low density and the
crust thinning in the western Anatolian region.
Three subsurface levels have been determined as 3 km,
9 km, and 28 km by the slopes of the power spectrumwave number graph of the gravity data as clearly seen in
Figure 3, representing the sediment thickness, the upperlower crust boundary, and the Moho depth, respectively.
To analyze the shallow crust structure of graben
area, the sediment and the upper-lower crust boundary
topographies were computed using a computer code
produced in MATLAB based on the Parker–Oldenburg
algorithm (Parker, 1972; Oldenburg, 1974).
To produce the sediment topography, the initial depth
in the iteration process is taken to be 3 km. The average
density contrast is considered to be 0.3 g/cm3 between
Neogene sediments until the crystalline basement level
(~2.4 g/cm3) and metamorphic complex (~2.7 g/cm3). The
obtained sediment topography map is provided in Figure 4.
The maximum depth of the sedimentary basin is
observed to be 4.1 km between Sultanhisar and Nazilli
and the sediment thickness is seen to be decreasing from
east to west and from south to north. The maximum
sediment thickness of the Büyük graben was determined
as 1.5–2 km by Sarı and Şalk (2002), 2.5 km by Göktürkler
et al. (2003), and 3.9 km by Işık and Şenel (2009) in the
literature. The sediment thickness was determined as 1.5
km at Aydın by Cohen et al. (1995), and between Aydın
and Sultanhisar as 2.0–2.2 km by Işık (1997) and 2.0 km
by Sarı and Şalk (2006). The sediment thickness between
Sultanhisar and Nazilli was determined as 2.2–2.3 km by
Işık (1997) and 2.5 km by Şenel (1997). The differences in
thickness are believed to stem from the consideration of
different density contrast values. The graben structure in
the region deepens from north to south and from west to
east as mentioned in the work of Işık and Şenel (2009).
mGal
70
60
50
40
30
20
10
0
0
38.0
0
ee
)
37.9
r
eg
0
0
37.7
0
37.6
La
t
d
itu
e
(D
37.8
27.20
0
37.5 27.00
0
27.40
27.80
28.60
e)
BMG
BD
G
28.50
37.80
de
itu
eg
(D
re
e)
SK
G
-4
38.00
28.40
Degre
tude (
Longi
27.60
28.00
28.20
-10
-20
-30
km
30
2.5
2
1.5
1-1
0.5
0
-0.5
-1
-1.5
-2
-2
-2.5
-3
-3.5
-3
-4
-4.5
-5
-5.5
-6
-4
28.00
t
La
27.50
27.00
ree)
de (Deg
Longitu
Figure 4. The basement undulation map of the study field derived from inversion of the Bouguer gravity
anomalies of the study area by using the Parker–Oldenburg’s algorithm. BMG, SKG, BDG: Büyük Menderes
Graben, Söke Graben, Bozdoğan graben, respectively.
425
ALTINOĞLU et al. / Turkish J Earth Sci
To produce the upper-lower crust boundary topography,
the initial depth in the iteration process is taken to be 9 km.
The average density contrast is considered to be 0.4 g/cm3
between average crust density (~2.7 g/cm3) and the material
below the assumed flexed elastic plate (~3.1 g/cm3). The
obtained upper-lower crust boundary topography ranges
from 4.50 to 12.50 km and shallows from east to west, as
seen in Figure 5. These results reveal that the anomalies of
the study area are compatible with the upper-lower crust
topography. It is noticeable that the upper-lower crust
boundary takes the maximum depth of 12.50 km in Nazilli,
where the gravity anomaly values are about –35 mGal. The
upper-lower crust boundary ranges from 8.50 km to 11.50
km between Ortaklar and Sultanhisar and from 11.50 km
to 12.50 km at the Sultanhisar-Nazilli line. The depths are
seen to be 10–11 km and 7–9 km at the Bozdoğan graben
and at the Söke basin, respectively. It is important to point
out that a new basin structure was detected in the N-S
direction in the south of the Büyük Menderes graben (see
Figure 5). It can be readily seen from both Figure 4 and
Figure 5 that the basement topographies improved under
the same tectonism with the lineaments bounding the
Büyük Menderes graben. Both basement topographies are
seen to have the same behavior that shows minimum and
maximum values in the same area. Our observations are
supported by the work of Çifçi et al. (2011).
To discover the linear features of the study area, the
horizontal gradient, analytic signal, first vertical gradient,
tilt angle, tilt angle of vertical gradient, tilt derivative, theta
map, and hyperbolic tilt angle edge detection methods
mGal
70
60
50
lli
Nazi
ar
h
n is
40
Sulta
k
Selçu
0
30
IN
AYD
ğan
ozdo
0
Söke
0
La
0
37.6
0
37.5
27.00
27.20
27.40
28.20
28.00
27.80 e (Degree)
gitud
37.7
tit
e
ud
37.8
20
B
ada
Kuş
eg
(D
klar
Orta
sı
0
37.9
re
e)
38.0
28.40
28.60
10
0
27.60 Lon
km
Depth (km)
-4.5
-5.5
5
-6.5
B MG
10
-7.5
-8.5
38.00
28.20
ree
eg
(D
de
titu
La
)
27.50
37.50
Lon
g
e
itud
-10.5
-11.5
28.00
37.80
-9.5
(De
g
ree)
-12.5
-13.5
27.00
Figure 5. The upper-lower crust boundary’s topography map of the study region derived from inversion of the
Bouguer gravity anomalies using the Parker–Oldenburg’s algorithm. BMG: Büyük Menderes graben.
426
ALTINOĞLU et al. / Turkish J Earth Sci
were applied to the Bouguer gravity anomaly data. In
general, faults are expected to be situated at or near the
steepest gradient of the anomaly. As pointed out by Gout
et al. (2010), this characteristic is particularly helpful
in areas where the fault zone is concealed by younger
sedimentary deposits. The maximum value of the HGM
and analytic signal indicate the source edge, and maximum
values indicate the boundary faults of the graben mainly
on the E-W and the SW-NE trends (see Figures 6a and
6b). The first vertical gradient map is given in Figure 6c.
The zero values of the tilt angle map show the boundary
of the source edge, so in the tilt angle map zero values are
pointed out by red lines in Figure 6d. The zero values of the
tilt angle of the vertical gradient map show the boundary
of the source edge, and zero values of the tilt angle of the
vertical gradient are pointed out by red lines in Figure 6e.
37.90
37.80
37.70
37.60
27.00
27.20
27.40
28.00
28.20
28.40
37.90
37.80
37.70
37.60
37.50
27.00
27.20
27.40
27.60
27.80
28.00
28.20
28.40
Longitude (Degree)
e) 38.00
radian
1.6
1.2
0.8
0.4
0
-0.4
-0.8
-1.2
-1.6
37.80
37.70
37.60
27.00
27.20
27.40
27.60 27.80
28.00
Longitude (Degree)
28.20
28.40
g) 38.00
37.90
37.80
37.70
37.60
37.50
28.40
28.40
radian
1.6
1.4
1.2
1
0.8
0.6
0.4
0.2
0
-0.2
-0.4
-0.6
-0.8
-1
-1.2
-1.4
-1.6
28.60
37.70
37.60
37.50
27.00
mGal/km d)
38.00
11
10
98
37.90
76
54
37.80
32
10
-1
37.70
-2
-3
-4
-5
-6
37.60
-7
-8
-9
-10
37.50
28.60
27.00
37.90
37.50
Latitude (Degree)
28.60
37.80
27.20
27.40
27.60
27.80
28.00
28.20
Longitude (Degree)
Latitude (Degree)
Latitude (Degree)
27.80
Longitude (Degree)
c) 38.00
Latitude (Degree)
27.60
mGal/km
16
15
14
13
12
11
10
9
8
7
6
5
4
3
2
1
0
28.60
38.00
37.90
27.00
27.20
27.40
27.60
27.80
28.00
Longitude (Degree)
28.20
28.40
f)
27.40
27.60
27.80
28.00
28.20
radian/km
38.00
37.90
37.80
37.70
37.60
37.50
28.60
radian
2
1.8
1.6
1.4
1.2
1
0.8
0.6
0.4
0.2
0
28.60
27.20
Longitude (Degree)
Latitude (Degree)
37.50
12
11
10
9
8
7
6
5
4
3
2
1
0
Latitude (Degree)
mGal/km b)
38.00
27.00
27.20
27.40
h)
27.60 27.80
28.00 28.20
Longitude (Degree)
28.40
38.00
Latitude (Degree)
Latitude (Degree)
a)
The resolution of this map is good. The maximum values
are monitored within the source in the theta map given
in Figure 6f. Its maximum values are in agreement with
the horizontal gradient and analytic signal maximum
values, but it is more sensitive to detecting probable new
shallow faults than deep boundary faults. The tilt derivative
produces maximum values vertically above the edges of
source bodies, so it is easy to delineate vertical faults with
its maximum as seen in Figure 6g. The maximum value
of the hyperbolic tilt angle points out the location of the
source body edges. As seen in Figure 6h, the minimum
values of the hyperbolic tilt angle show the boundary of the
basin and the maximum values of the hyperbolic tilt angle
give the faults.
The enhanced maps of the lineaments based on the
edge detection methods are presented in Figures 6a–6h.
radian
5
4
3
2
1
0
-1
-2
-3
-4
37.90
37.80
37.70
37.60
37.50
27.00
1
0.9
0.8
0.7
0.6
0.5
0.4
0.3
0.2
0.1
0
28.60
27.20
27.40
27.60
27.80
28.00
28.20
28.40
28.60
Longitude (Degree)
Figure 6. a) Horizontal gradient map. b) Analytic signal map. c) First vertical derivative map. d) Tilt angle map. e) Tilt angle map of first
vertical derivative. f) Theta map. g) Tilt derivative map. h) Hyperbolic tilt angle map of the study field.
427
ALTINOĞLU et al. / Turkish J Earth Sci
38.00
Latitude (Degree)
37.90
37.8
37.70
37.60
37.50
27.00
0 to 2
2 to 3
3 to 4
4 to 5
27.20
27.40
27.60
27.80
28.00
28.20
28.40
28.60
Longitude (Degree)
Figure 7. The epicentral distribution map of the earthquakes that occurred in the study area with the new fault. Faults
in the study region are shown in black and newly detected lineaments are shown in red.
For comparison purposes, different methods were used to
reach the results. The obtained results are seen to usually
be in good agreement (see Figures 6a–6h). The lineaments
that come out in the four methods are assumed to be
lineaments in a general sense. The results show that almost
all methods distinguished the E-W and NE-SW structural
trends and all filters delineated edges of the graben
successfully. The obtained lineaments are seen to be in
agreement with the lineaments given by the MTA (Duman
et al., 2011; Emre et al., 2011). Most of the lineaments
identified are the boundary faults of the Büyük Menderes,
Karacasu, and Bozdoğan grabens. Note that many newly
discovered faults have been presented in the western,
northern, and southern parts of the considered area.
The obtained structural map is consistent with many
faults already recognized, and it highlights many new
linear features. In order to underpin the current findings
about the faults, the study region of interest was also
interpreted with the aspect of earthquake activity. As seen
from Figure 7, the region has high seismic activity; the
western part of the area is the most active part and most of
the earthquakes took place on the northern boundary of
the Büyük Menderes graben.
In the study area, except for the main faults bounding
the basins, many lineaments that were not previously
discovered in the active fault map have been determined.
High seismic activity has been observed in the areas where
these new lineaments were identified.
In the basement undulation map, lineaments have been
determined near the Selçuk, Nazilli, and Söke districts of
the study, shaping the topography and extending to the
bottom of the basement. The upper-lower crust undulation
map in the basin of the south of the study area is noticeable.
Thus, as seen in Figure 7, the newly determined lineaments
428
in the bottom topography extend to the depth of the base
between Bozdoğan and Çine.
5. Conclusions and recommendations
The present study, carried out based on edge detection
techniques and a 3D inversion approach to gravity data,
has mainly produced the following conclusions:
1) The maximum depth of the sedimentary basin of
the Büyük Menderes graben is observed to be 4 km. The
sedimentary thickness is seen to be decreasing from east
to west and from south to north. The thicknesses of the
other basins in the study area, the Karacasu and Bozdoğan
grabens, have been determined to be 2 km.
2) The obtained upper-lower crust boundary
undulation is ranging from 4.50 to 12.50 km.
3) Both topographies, presented for the first time
in the whole Büyük Menderes graben area, are seen to
be correlated with each other. The depth level increases
from east to west and from north to south in the region
of interest.
4) As is the case in the literature, it is understood
from our results that faults in the E-W direction of the
Büyük Menderes graben separate horsts and grabens. It is
concluded that the currently obtained topographies and
the faults bounding the Büyük Menderes graben have been
improved due to the same tectonic effect.
5) In terms of seismicity of the region, the newly
determined sediment and upper-lower crust boundary
topographies and the lineaments revealed that the basin
is controlled by deep faults under the joint effect of the
Cyprus Island Arc, Ölüdeniz Fault Zone, and Isparta
Angle.
With this study, layer topographies of the Büyük
Menderes were detected and the Büyük Menderes’s
ALTINOĞLU et al. / Turkish J Earth Sci
crust structure as well as basin geometry were revealed.
The results obtained from the study provide valuable
information for geologists to delineate the faults and other
tectonic features.
In future studies, the focus may be on the newly
detected faults and special interest may be given to
seismological events.
References
Akay T, Bilim F, Koşaroğlu S (2013). Investigation of the tectonic
structures of Menderes massive (Western Anatolia, Turkey) by
means of Bouguer gravity analysis. Cumhuriyet Yerbilimleri
Dergisi 30: 71-86 (in Turkish with abstract in English).
Cheyney S, Hill I, Linford N (2011). Advantages to using the
pseudogravity transformation to aid edge detection of total
field archaeomagnetic datasets. Archaeol Prosp 18: 81-93.
Ali MY, Fairhead JD, Green CM, Noufal A (2017). Basement
structure of the United Arab Emirates derived from an analysis
of regional gravity and aeromagnetic database. Tectonophysics
712-713: 503-522.
Çifçi G, Pamukçu O, Çoruh C, Çopur S, Sözbilir H (2011). Shallow
and deep structure of a supradetachment basin based on
geological, conventional deep seismic reflection sections and
gravity data in the Büyük Menderes Graben, western Anatolia.
Surv Geophys 32: 271-290.
Altınoğlu FF, Aydın A (2015). Interpretation of deep crust structure
and linear features of western Anatolia by using Bouguer
gravity data. Proceedings of Azerbaijan National Academy of
Sciences, Sciences of Earth 3: 46-53.
Çiftçi NB, Bozkurt E (2009). Structural evolution of the Gediz
Graben, SW Turkey: temporal and spatial variation of the
graben basin. Basin Res 22: 846-873.
Altınoğlu FF, Sari M, Aydın A (2015). Detection of lineaments in
Denizli basin of western Anatolia using Bouguer gravity data.
Pure Appl Geophys 172: 415-425.
Alvandi A, Babaei M (2017). Edge detection of gravity anomalies
with directional hyperbolic tilt angles: application to synthetic
and field data. J Ind Geophys Union 21: 13-16.
Alvandi A, Rasoul H (2014). Edge detection process of Qom salt dome
gravity anomalies using hyperbolic tilt angle. International
Journal of Geomatics and Geosciences 5: 209-224.
Cohen HA, Dart CJ, Akyuz HS, Barka A (1995). Syn-rift
sedimentation and structural development of the Gediz and
Büyük Menderes graben, western Turkey. J Geol Soc London
152: 629-638.
Connard G, Couch R, Gemperle M (1983). Analysis of aeromagnetic
measurements from the Cascade Range in central Oregon.
Geophysics 48: 376-390.
Cooper G, Cowan D (2004). Filtering using variable order vertical
derivatives. C R Geosci 30: 455-459.
Ardestani VE (2005). Gravity interpretation via gravity gradients and
analytic signal, J Earth Sci 12: 54.
Cooper GRJ, Cowan DR (2006). Enhancing potential field data using
filters based on the local phase. Comput Geosci 32: 1585-1591.
Ardestani VE, Motavalli H (2007). Constraints of analytic signal to
determine the depth of gravity anomalies. J Earth Space Phys
33: 77-83.
Cordell L (1979). Gravimetric expression of graben faulting in Santa
Fe country and the Espanola Basin, New Mexico. In: New
Mexico Geological Society 30th Field Conference Guidebook.
Socorro, NM, USA: New Mexico Geological Society, pp. 59-64.
Arısoy MO, Dikmen U (2011). Potensoft: MATLAB-based software
for potential field data processing, modeling and mapping.
Comput Geosci 37: 935-942.
Bayrak E, Yılmaz S, Bayrak Y (2017). Temporal and spatial variations
of Gutenberg-Richter parameter and fractal dimension in
Western Anatolia. Turkey. J Asian Earth Sci 138: 1-11.
Cordell L, Grauch VJS (1985). Mapping basement magnetization
zones from aeromagnetic data in the San Juan Basin, New
Mexico. In: Hinze, WJ, editor. The Utility of Regional Gravity
and Magnetic Anomaly Maps. Tulsa, OK, USA: Society of
Exploration Geophysicists, pp. 181-197.
Bosum W, Damaske D, Roland NW, Behrendt J, Saltus R (1989).
The Ganovex IV Victoria Land/Ross Sea aeromagnetic survey:
interpretation of anomalies. Geol Jahrb E 38: 153-230.
Çubuk-Sabuncu Y, Taymaz T, Fichtner A (2017). 3-D crustal velocity
structure of western Turkey: constraints from full-waveform
tomography. Phys Earth Planet Inter, 270: 90-112.
Bozkurt E, Sözbilir H (2004). Tectonic evolution of the Gediz
Graben: field evidence for an episodic, two-stage extension in
western Turkey. Geol Mag 141: 63-79.
Dewey JF, Şengör AMC (1979). Aegean and surrounding regions:
complex and multiple continuum tectonics in a convergent
zone. Geol Soc Am Bull 90: 84-92.
Bozkurt E, Sözbilir H (2006). Evolution of the large-scale active
Manisa Fault, Southwest Turkey: implications on fault
development and regional tectonics. Geodin Acta 19: 427-453.
Duman TY, Emre Ö (2011). 1:250,000 Scale Active Fault Map Series
of Turkey, Aydın (NJ 35-11) Quadrangle. Serial Number: 7.
Ankara, Turkey: General Directorate of Mineral Research and
Exploration.
Chen G, Liu T, Sun J, Cheng Q, Sahoo B, Zhang Z, Zhang H (2015).
Gravity method for investigating the geological structures
associated with W–Sn polymetallic deposits in the Nanling
Range. China J Appl Geophys 120: 14-25.
Elmas A, Karslı H, Kadirov FA (2018). Lineaments in the Shamakhy–
Gobustan and Absheron hydrocarbon containing areas using
gravity data. Acta Geophys 66: 39-49.
429
ALTINOĞLU et al. / Turkish J Earth Sci
Emre Ö, Duman TY, Özalp S, Elmacı H (2011). 1:250,000 Scale Active
Fault Map Series of Turkey, Denizli (NJ 35-12) Quadrangle.
Serial Number: 12. Ankara, Turkey: General Directorate of
Mineral Research and Exploration.
Garcia-Abdeslem J, Ness GE (1994). Inversion of the power spectrum
from magnetic anomalies. Geophysics 59: 391-401.
Göktürkler G, Salk M, Sari C (2003). Numerical modeling of the
conductive heat transfer in western Anatolia. J. Balkan Geophy
Soc 6:1-15.
Gómez-Ortiz D, Agarwal BNP (2005). 3DINVER.M: A MATLAB
program to invert the gravity anomaly over a 3-D horizontal
density interface by Parker-Oldenburg’s algorithm. Comput
Geosci 31: 513-520.
Gout RE, Khattach D, Houari MR, Kaufmann O, Aqil H (2010). Main
structural lineaments of north-eastern Morocco derived from
gravity and aeromagnetic data. J African Earth Sci 58: 255-271.
Guo LH, Meng XH, Zhang GL (2014). Three-dimensional
correlation imaging for total amplitude magnetic anomaly and
normalized source strength in the presence of strong remanent
magnetization. J Appl Geophys 111: 121-128.
Hahn A, Kind EG, Mishra DC (1976). Depth estimation of magnetic
sources by means of Fourier amplitude spectra. Geophys
Prospect 24: 287-308.
Hornby P, Boschetti F, Horovitz FG (1999). Analysis of potential field
data in the wavelet domain. Geophys J Int 137: 175-196.
Işık M (1997). Değişken yoğunluklu sedimanter basen anomalilerinin
ters çözümü. PhD, Kocaeli University, Kocaeli, Turkey.
Işık M, Şenel H (2009). 3D gravity modeling of Büyük Menderes
basin in western Anatolia using parabolic density function. J
Asian Earth Sci 34: 317.
Koçyiğit A, Yusufoğlu H, Bozkurt E (1999). Evidence from the Gediz
graben for episodic two-stage extension in western Turkey. J
Geol Soc London 156: 605-616.
Kumar NJ, Singh AP, Rao MRKP, Chandrasekhar DW, Singh B
(2009). Gravity signatures derived crustal structure and
tectonics of Achankovil shear zone Southern India. Gondwana
Res 16: 45-55.
Le Pichon X, Angelier J (1979). The Hellenic arc and trench system: A
key to the neotectonic evolution of the eastern Mediterranean
area. Tectonophysics 60: 1-42.
Lyngsie SB, Thybo H, Rasmussen TM (2006). Regional geological
and tectonic structures of the North Sea area from potential
field modelling. Tectonophysics 413: 147-170.
Ma G, Li L (2012). Edge detection in potential fields with the
normalized total horizontal derivative. Comput Geosci 41: 8387.
Miller HG, Singh V (1994). Potential field tilt -a new concept for
location of potential field sources. J Appl Geophys 32: 213-217.
Nabighian MN (1972). The analytic signal of two dimensional
magnetic bodies with polygonal cross section: its properties
and use for automated anomaly interpretation. Geophysics 37:
507-517.
Nabighian MN, Ander ME, Grauch VJS, Hansen RO, Lafehr TR,
Li Y, Pearson WC, Peirce JW, Phillips JD, Ruder ME (2005).
Historical development of the gravity method in exploration.
Geophysics 70: 63-89.
Naouali BS, Inoubli MH, Amiri A, Chaqui A, Hamdi I (2011).
Subsurface geology of the Ariana region (Diapir Zone,
northern Tunisia) by means of gravity analysis. Geophy Prosp
59: 983-997.
Nishijima J, Naritomi K (2015). Interpretation of gravity data to
delineate underground structure in the Beppu geothermal
field, central Kyushu, Japan. J Hydrology Reg Stud 11: 84-95.
Oldenburg DW (1974). The inversion and interpretation of gravity
anomalies. Geophysics 39: 526-536.
Oruç B (2010). Edge detection and depth estimation using a tilt
angle map from gravity gradient data of the Kozaklı-Central
Anatolia Region, Turkey. Pure Appl Geophys 168: 1769-1780.
Özelçi F (1973). Gravity anomalies of the Eastern Mediterranean.
Bulletin of the Mineral Research and Exploration 80: 54-92.
Pamukçu O, Yurdakul A (2008). Isostatic compensation in western
Anatolia with estimate of the effective elastic thickness. Turk J
Earth Sci 17: 545-557.
Parker RL (1972). The rapid calculation of potential anomalies.
Geophys J R Astr Soc 31: 447-455.
Phillips JD (2000). Locating magnetic contacts; a comparison of the
horizontal gradient, analytic signal, and local wavenumber
methods. Society of Exploration Geophysicists Abstracts with
Programs 402-405.
Rabinowitz PD, Ryan WBF (1970). Gravity anomalies and crustal
shortening in the Eastern Mediterranean. Tectonophysics 10:
285-608.
Rapolla A, Cella F, Fedi M, Florio G (2002). Improved techniques
in data analysis and interpretation of potential fields: examples
of application in volcanic and seismically active areas. Ann
Geophys 45: 6.
Roest WR, Verhoef J, Pilkington M (1992). Magnetic interpretation
using the 3D analytic signal. Geophysics 57: 116-125.
Saibi H, Nishijima J, Ehara S (2006). Processing and interpretation
of gravity data for the Shimabara Peninsula area, Southwestern
Japan. Mem Fac Eng Kyushu Uni 66: 2.
McKenzie DP (1972). Active tectonics of the Mediterranean Region.
Geophys J Roy Astron Soc 30: 109-185.
Sarı C, Şalk M (2002). Analysis of gravity anomalies with hyperbolic
density contrast: An application to the gravity data of western
Anatolia. J Balkan Geophys Soc 5: 87-96.
Mickus K (2008). Regional gravity analysis of Burkina Faso:
Implications for the location of metallic ore deposits. J African
Earth Sci 50: 55-66.
Sarı C, Şalk M (2006). Sediment thicknesses of the western Anatolia
graben structures determined by 2D and 3D analysis using
gravity data. J Asian Earth Sci 26: 39-48.
430
ALTINOĞLU et al. / Turkish J Earth Sci
Şenel H (1997). Inversion of gravity anomaly of Büyük Menderes
faults. Journal of Kocaeli University 4: 66-72 (in Turkish with
abstract in English).
Wang J, Meng X, Li F (2017). New improvements for lineaments
study of gravity data with improved Euler inversion and phase
congruency of the field data. J Appl Geophys 136: 326-334.
Şengör AMC, Görür N, Şaroğlu F (1985). Strike-slip faulting and
related basin formation in zones of tectonic escape: Turkey as
a case study. Soc Econ Paleontol Min Spec Pub 37: 227-264.
Wang J, Meng XH, Guo LH, Chen ZX, Li F (2014). A correlationbased approach for determining the threshold value of singular
value decomposition filtering for potential field data denoising.
J Geophys Eng 11: 055007-7.
Seyitoğlu G, Scott B (1996). The age of the Büyük Menderes graben
(west Turkey) and its tectonic implications. Geol Mag 129: 239242.
Seyitoğlu G, Scott B, Rundle CC (1992). Timing of Cenozoic
extensional tectonics in west Turkey. J Geol Soc London 149:
533-538.
Sözbilir H (2001). Extensional tectonics and the geometry of
related macroscopic structures: field evidence from the Gediz
Detachment, Western Turkey. Turk J Earth Sci 10: 51-67.
Spector A, Grant FS (1970). Statistical models for interpreting
aeromagnetic data. Geophysics 35: 293-302.
Uieda L, Barbosa VCF (2012). Robust 3D gravity gradient inversion
by planting anomalous densities. Geophysics 77: 55-66.
Wang J, Meng XH, Li F (2015). Improved curvature gravity gradient
tensor with principal component analysis and its application in
edge detection of gravity data. J Appl Geophys 118: 106-114.
Wijns C, Perez C, Kowalczyk P (2005). Theta map edge detection in
magnetic data. Geophysics 70: 39-43.
Yılmaz Y, Genç SC, Gurer OF, Bozcu M, Yılmaz K, Karacık Z,
Altunkaynak S, Elmas A (2000). When did the western
Anatolian grabens begin to develop? Geo Soc London Spec
Publ 173: 353-384.
Zuo BX, Hu XY (2015). Edge detection of gravity field using
eigenvalue analysis of gravity gradient tensor. J Appl Geophys
114: 263-270.
Verduzco B, Fairhead JD, Green CM, MacKenzie C (2004). New
insights into magnetic derivatives for structural mapping. Lead
Edge 23: 116-119.
431