System of environmental - economic accounting for water (SEEA-W): Case study of the Nhue - Day river basin
Bạn đang xem bản rút gọn của tài liệu. Xem và tải ngay bản đầy đủ của tài liệu tại đây (698.63 KB, 9 trang )
Environmental Sciences | Climatology
System of environmental - economic
accounting for water (SEEA-W):
case study of the Nhue - Day river basin
Van Manh Lai1*, Thanh Hung Tran1, Minh Tuan Tran1
Ngoc Anh Nguyen2, Thi Minh Tra Mac3
Institute of Strategy and Policy on Natural Resources and Environment
1
Ministry of Natural Resources and Enviroment of the Socialist Republic of Vietnam (MONRE)
2
Centre for Application and Development of Cadastral Technology, General Department of Land Administration, MONRE
Centre for Environmental Monitoring Portal, Vietnam Environmental Administration, MONRE
3
Received 19 July 2017; accepted 15 November 2017
Abstract:
The system of environmental - economic accounting for water (SEEA-W) is
one of efforts by international organizations to address the issue of the lack of
water related data; it provides a tool for policymakers to inform decisions in a
sustainable manner. In undertaking a pilot study of the Nhue - Day river basin,
this research demonstrates that the river basin approach is in accordance
with management institutions and available data, as well as being useful for
sustainable management of water, in Vietnam.
Keywords: management of water, Nhue - Day river basin, SEEA-W.
Classification number: 6.2
Introduction
Water accounting is a discipline
that seeks to provide comprehensive,
consistent and comparable policyrelevant information related to water.
Based on the experience of more than fifty
years of compiling national accounts, the
discipline that provides the elements to
calculate gross domestic product (GDP),
the United Nations Statistics Division
(UNSD) developed the System of
Environmental - Economic Accounting
for Water (SEEA-W), adopted by the
United Nations Statistical Commission
(UNSC) as a statistical standard in
2012. SEEA-W can assist policymakers
in making informed decisions on: (i)
Allocating water resources efficiently;
(ii) Improving water efficiency; (iii)
Understanding the impacts of water
management on all users; (iv) Getting
the most value for money from investing
in infrastructure; (v) Linking water
availability and use; (vi) Making
available a standardized information
system, which is capable of harmonizing
information from different sources, is
accepted by stakeholders and is used for
the derivation of indicators; (vii) Getting
stakeholders involved in decisionmaking.
Currently, over 50 countries are
developing or plan to develop SEEA-W
[1]. The application of SEEA-W will
gradually improve the quality of data
and contribute to develop sustainable
policies on water resources. However,
the applicability of the framework in
practice is much reliant on a country’s
institutional and organizational structure
*Corresponding author: Email:
80
Vietnam Journal of Science,
Technology and Engineering
December 2017 • Vol.59 Number 4
and especially the approach to relevant
SEEA-W information sources [2].
Viewed from existing conditions
and potential of the framework’s
application in Vietnam, the study has
revealed that adopting a river basin
approach to SEEA-W is fundamental
to implementation of the framework at
national level. In this study, the pilot
application on the Nhue - Day river
basin will prove the relevance and
feasibility of implementation of this
approach, while demonstrating it has
certain impacts on State management on
water resources. In addition, the gained
results of the pilot study will point out
the deficiencies and limitations that need
to be improved.
Methodologies
The methodologies adopted in this
research were:
(i) Desk study to review, collect data
and related information, and search for
published data sources.
(ii) Systems analysis to describe
the relationship between economic and
household activities and other problems
related to water resources in the Nhue Day river basin.
(iii) Consultation survey of views
of local authorities in the Nhue - Day
river basin and experts from the relevant
backgrounds such as water resources
Environmental Sciences | Climatology
planning; water pollution; remote
sensing and GIS professionals.
(iv) Statistical analysis to gather and
process Nhue - Day river basin data.
The following table describes the main
sources and methodololgies used to
collected data for Nhue - Day river basin
case study (Table 1).
Table 1. Data collection methodologies.
No
Types of data
Sources or methods to collected
1
Precipitation
Collected from the report of National Center for Water Resources
Planning and Investigation (NAWAPI) [3] in 2016 - Monre.
2
Evaporation
Download the average evaporation map from Moderate Resolution
Imaging Spectroradiometer (MORIS) and processing for the Nhue Day river basin by Geographical Information System (GIS) expert.
Results and discussions
- Wastewater data was extracted from the data system of the Centre
for Environmental Monitoring Portal of the Vietnam Environment
Administration (VEA), the website Portal managing environmental
monitoring of the Nhue - Day river basin.
- Water use was estimated according to the guide from the Decree
on drainage and wastewater treatment (article 39 - Determination of
wastewater volumes, no 80/2014/ND-CP).
- In particular, wastewater and water use for agriculture (cultivation
and livestock) was collected from data in VEA reports [4].
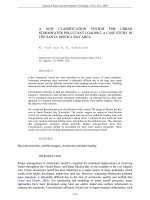
SEEA-W framework
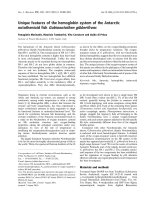
The framework of SEEA-W is
presented in simplified diagrammatic
form in Fig. 1, which shows the economy,
the system of water resources and their
interactions [9]. The economy and the
inland water resource system of a territory,
referred to as “territory of reference”,
which can be a country, an administrative
region, or a river basin. The given
“territory of reference” includes (i) The
inland water resource system of a territory
is composed of all water resources in
the territory (surface water, groundwater
and soil water) and the natural flows
between and among them (absorption,
evapotranspiration, etc.) which are
separately reflected in the form of water
assets and volume; (ii) The economy of a
territory consists of resident water users
that abstract water for production and
consumption purposes and put in place
the infrastructure to store, treat, distribute
and discharge water.
State agencies, enterprises, and
households play their particular roles in
socio-economic activities in the territory
of reference. These entities act as the
producers and consumers, and use water
resources as a “sink”. In this regard,
these entities use water in different ways
by abstracting groundwater, surface
water and rainwater, and by reusing
water, etc. In the other words, economic
entities can directly abstract water from
the environment to carry on activities
involving production and consumption
or use water without physically removing
it from the environment (recreational
uses of water). To depict the relationship
of water-related activities within the
economy, SEEA-W adopts International
Standard Industrial Classification (ISIC)
3
Water use and
wastewater
4
Pollution parameters
in wastewater
5
Socio-Economic
activities
The study only adopts COD parameters in water to compile the
emission accounts table in the Nhue - Day river basin. Due to data
restrictions, the following assumptions have been made:
(i) Wastewater after treatment meets the standards for surface water
in Vietnam at column A1; accordingly, the COD amount after
treatment remains at 0.00001 ton/m3 [5].
(ii) The ratio of treated wastewater and wastewater directly
discharged into the environment are calculated on the data of Center
for Environmental Monitoring 2017 [6]. Additionally, some ratios
are referenced by published researches [7] or the National Strategy
on environmental protection to 2020 and the orientation towards
2030 [8].
From the provincial statistical yearbooks of Hoa Binh, Ha Noi, Ha
Nam, Nam Dinh, and Ninh Binh in 2015.
(Sources: authors, 2017).
Flows from environment
to economy (dotted line)
Flows within the
economy
and
between
economy
(solid line)
Inland water resources system and other resources
Imports
Of which
ISIC – 36 – Collection, purification and
distribution of water
Industries
(ISIC)
Exports
Households
ISIC 37 - Sewerage
Flows from the economy
to environment
Inland water resources system and other resources
Fig. 1. Detailed description of physical flows within the economy.
(Sources: UN, SEEA-W, 2012).
Direct emission
Households
December 2017 • Vol.59 Number 4
Vietnam Journal of Science,
Technology and Engineering
En
( Rive
To environment
81
Environmental Sciences | Climatology
to develop relevant accounting tables
listed in Table 2 [10].
PSUT and emission accounts tables
respectively contribute to:
Inland water resources system and other resources
Table 2. Classification of socio-economic activities in SEEA-W.
International System
Industry Code (ISIC)
Flows within the
economy
1-3 and
between
economy
(solid line)
Description of Socio - economic activities
Of which
ISIC – 36 – Collection, purification and
distributionforestry
of water and fishing
Agriculture,
Imports
Exports
5-33, 41-43,
Manufacturing,
mining and quarrying and other
industry activities
Industries
Households
35
Electric power generation, transmission and distribution
36
(ISIC)
ISIC 37 - Sewerage
Water collection, treatment and supply
37
Flows from
38, the
39,economy
45-99
to environment
Sewerage, including treatment of wastewater
activities
Inland water resourcesServices
system and
other resources
No code
Households as customer
(Sources: UN, SEEA-W, 2012).
Direct emission
Households
To environment
ISIC 37 Sewerage
Reused by
economic
Waste water of
economic
activities (ISIC)
Environment
( River, lakes, sea…)
The SEEA-W accounting framework
showing interaction between the
inland water system and the economy
is divided and presented in the five
categories corresponding to these
accounting tables: (i) Physical water
supply and use table (PSUT); (ii)
Water emission accounts; (iii) Hybrid
accounts for economic activities and
water resources; and (iv) Asset accounts.
These tables reflect different aspects of
water in a given period of accounting.
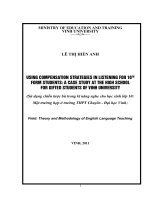
Two important parts of SEEA-W are
PSUT and emission accounts. PSUT
describes water flows in physical units
(m3, million m3, etc.) to reflect water
interaction between the environment
and the economy and among industries
within the economy. Emission accounts
seek to show the water pollutants in
the economy, the role of the entities to
reduce these pollutants though on-site
treatment, or through water treatment
facilities (ISIC 37).
Flows from environment
to economy (dotted line)
- (i) Assessment and monitoring of
Direct emission
the pressure on water quantities that is
exerted by the economy; (ii) Evaluation Fig. 2. Wastewater and associated pollution pathway.
of alternative options for reducing (Sources: SEEA-W, 2012).
Figure 2 . Wastewater and associated pollution pat hway.
the pressure on water; (iii) Reflect
Table
3. Total
at current price of provinces in Nhue - Day river basin by
the information on water collection,
(Sources:
SEEA
-W,GDP
2012)
economic
activities.
treatment, distribution, and reuse of
water by the industries; and (iv) Link
ISIC
2010
2011
2013
2014
2015
other economic information such as
value added and production yield
Total
361,877
464,685
642,032
735,801
822,582
of each industry, to calculate useful
indicators such as intensity, productivity
1-3
43,784
56,024
63,079
65,441
70,642
and efficiency of water use by industry,
5- 33, 41-43
181,285
235,740
331,451
382,602
432,358
emission situation, water footprint, and
water use in households.
- Support policy makers, water
managers measure the current situation
and control the pollutants in the water
resources (e.g. BOD, COD, nitrogen,
phosphorus, etc.) based on discharges of
water and pollutants into the environment
from households and economic activities
(Fig. 2 [9]).
82
Vietnam Journal of Science,
Technology and Engineering
35
14,537
14,104
19,811
23,658
26,914
36, 37
1,758
2,404
3,484
3,977
4,171
38, 39, 45-99
120,513
156,413
224,207
260,123
288,497
Unit: billions of VND.
(Source: extracted from the provincial statistical year books of Ha Noi [11], Ha
1
Nam [12], Nam Dinh [13], Ninh Binh [14] and
Hoa Binh [15]).
December 2017 • Vol.59 Number 4
Environmental Sciences | Climatology
Hybrid supply and use tables
juxtapose results from PSUT and
emission accounts tables with information
about related economic activities in
the system of national accounts (SNA)
such as gross output (GO), intermediate
consumption (IC), value added (VA), etc.
They contribute development indicators
to illustrate the relation between water
resources and economic, households’
activities in each country, territory [9].
In particular, such types of combination
make it possible to review the contribution
of water resources to socio-economic
development and provide indicators to
reflect the efficiency and cost of water use
and distribution within the economy, the
polluting pressures on the environment
created by water, and so on.
Precipitatio
n
Agriculture
ISIC 1-3
ISIC 37
SURFACE WATER IN NHUE – DAY RIVER BASIN
Households
(H)
Ground
water
Industrial zones
(ISIC 5 - 33, 41-43
ISIC 36
Sewerage
ISIC 37
Ground
water
Handicrafts
villages
ISIC 37
Health
(ISIC 38,
39, 45-99
Evaporation
Manufacturing outside
of Industry zone (ISIC
5 - 33, 41-43
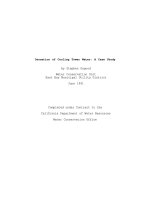
Fig. 3. The relationships between socio-economic activities and water
3. The in
relationships
socio-economic
activities and water resources in
Application of SEEA-W in the Nhue Figure
resources
the Nhue between
- Day river
basin.
the Nhue - Day river basin.
- Day river basin
(Sources:
Authors,
2017).
(Sources:
authors,
2017).
An overview of the Nhue - Day river
Table 4. Estimated wastewater from main wastewater sources in the Nhue basin:
Day river basin from 2009 to 2015.
- Natural conditions: Being a subNo
Types of wastewater sources
2010
2012
2014
2015
basin of the Red River, the Nhue - Day
river basin is located on the right bank
1
Agriculture
933.34
N/a
N/a
N/a
of Red River and accounts for a large
Cultivations
341.67
N/a
N/a
N/a
part of the southwest Red River delta.
Livestock
591.67
N/a
N/a
N/a
The basin encompasses 5 provinces and
2
Handicraft villages
26.81
128.31
14.92
32.65
central cities including: Hoa Binh, Hanoi,
3
Industrial zones
21.79
15.85
8.19
17.13
Ha Nam, Ninh Binh, and Nam Dinh with
4
Health facilities
91.67
4.21
1.37
0.51
total area of 7,388 km2 (in which the
Manufacturing outside of industrial
5
86.84
1241.78
4.90
1.27
zones
Day river basin is 6,965 km2). The basin
6
Households
223.03
N/a
N/a
N/a
has a variety of geographical structures
2
in which two thirds of the area is delta; unit: millions of m3; N/a: not available data.
the West-to-East geographical picture (Source: extracted and calculated as described in Table 1).
can be divided into three main regions:
Mountainous region, delta, and coastal/
Table 5. The volume and ratio of water use, water emission of economic
mouth region. The basin’s river network
activities, households in the Nhue - Day river basin in 2010.
has a rather high density at 0.7-1.5 km/
Industries ISIC (5-33, 41-43)
Health facilities
Indicators
Unit
H
km2 including main rivers, tributaries and
Agri (1-3)
(38, 39, 45-99)
Industrial Manufacturing outside Handicraft
distributaries such as Day river, Tich river,
zones
of Industrial zones
villages
Thanh Ha river, and Chau river [4].
223.03
1,166.68
27.23
108.55
33.52
114.59
1. Total of water use
Mil.m
3
- Socio-economic conditions: In
2010, the total population in the basin
was 8,191,739 people with average
density of 1,108 people/km2 [4]. Due
to the impact of the strong urbanization
process, the population in the basin has
increased over time along with positive
changes in economic activities. The
results of GO in the basin’s provinces
Ground water
%
33.55
45.63
42.22
5.21
71.27
Surface water
%
0
40.60
1.01
83.35
24.02
0
From ISIC 36
%
66.46
13.78
56.76
11.43
4.71
92.56
Mil.m3
223.03
933.34
21.79
86.84
26.81
91.67
2. Total of wastewater
7.44
Agriculture
%
0
14.16
0.062
2.83
4.945
To ISIC 37
%
30,00
0
4.23
2.34
15.42
50.48
%
70,00
100
81.61
97.60
81.75
44.58
To Environment (rivers,
lakes, sea…)
H: households.
(Source: extracted and calculated as described in Table 1).
December 2017 • Vol.59 Number 4
Vietnam Journal of Science,
Technology and Engineering
83
Environmental Sciences | Climatology
has constantly increased, particularly in
the sectors of industry, commerce, and
service. In 2015, the population of the
river basin reached 11,989.3 thousand
people (Table 3).
Nhue - Day river basin maintains its
many pressures on the water resources
important roles in supplying water for
in the basin such as uncontrolled
socio-economic development activities
water abstraction and use; increased
in the related provinces. Nevertheless,
environmental pollution, which lead
the rapid socio-economic development
to the severe polluted conditions of the
- Pressures on water resources: The
in the recent years has resulted in
water resources in the basin [4].
Table 6. Physical use 2010 in the Nhue - Day river basin.
Industry (by ISIC)
A. Physical water use table (millions of m3)
H
ROW
Total
8.52
8,501.44
93.52
8,594.96
6,865.60
8.52
8,019.92
93.52
8,113.45
1,005.95
1,005.95
139.85
139.85
11.77
11.77
11.77
96.14
96.14
96.14
+ Handicraft villages
31.94
31.94
31.94
- Health facilities
8.52
8.52
8.52
- Urban run-off
6,865.6
6,865.60
6,865.60
- Households
0.00
93.52
93.52
1.b. Abstraction for distribution
481.52
481.52
481.52
I.2. Abstraction sources
I.2.1. From inland water resources
1,005.95
139.85
0
481.52
0
8.52
1,635.84
93.52
1,729.36
- Surface water
532.30
98.808
0
481.52
0
0
1112.63
0
1,112.63
- Ground water
473.65
41.046
0
0
0
8.52
523.22
93.52
616.74
I.2.2. Collection of precipitation
0
0
0
0
6865.6
0
6,865.60
0
6,865.60
1.2.3. From sea
0
0
0
0
0
0
0.00
0
0.00
21.176
27.87
0
0
120.28
106.07
275.39
185.27
0
460.66
- Reused water
8.363
0
0
0
0
0
8.36
0
0
8.36
- Wastewater to sewerage
0
0
0
0
120.28
0
120.28
0
0
120.28
1,027.13
167.72
0.00
481.52
6,985.88
114.59
8,776.83
278.79
0.00
9,055.63
1-3
5-33,
41-43
35
36
37
38, 39,
45-99
Total
I.1. Sources of abstracted water
1. Total water abstraction
(= 1.a +1.b = 1.2.1 + 1.2.2 + 1.2.3)
1,005.95
139.85
0
481.52
6,865.60
1.a. Abstraction for own use
1,005.95
139.85
0
0.00
- Agriculture
1,005.95
- Industries
139.85
+ Industrial zones
+ Manufacturing outside of Industrial
zone
I. From the environment
II. Within the economy
2. Use of water received from
other economic units
3. Total use of water (= 1+2)
ROW: rest of the world (outside the Nhue - Day river basin).
(Sources: authors, 2017).
84
Vietnam Journal of Science,
Technology and Engineering
December 2017 • Vol.59 Number 4
Environmental Sciences | Climatology
Table 7. Physical supply 2010 in the Nhue - Day river basin.
Industry (by ISIC)
H
ROW
Total
543.32
66.913
610.23
4.53
8.43
0
8.43
0
46.28
53.37
66.913
120.28
0
120.28
40.86
1,218.94
156.12
1,375.06
933.34
933.34
124.45
124.45
124.45
17.78
17.78
17.78
+ Manufacturing outside industrial zones
84.75
84.75
84.75
+ Handicraft villages
21.92
21.92
21.92
- Health facilities
40.86
40.86
40.86
- Urban run-offs
0.00
0.00
- Waste water
120.28
120.28
156.12423
276.40
933.34
124.45
0
0
120.28
40.86
1,218.94
156.12
1,375.06
5.a.1. Surface water
933.34
124.45
0
0
120.28
40.86
1,218.94
156.12
1,375.06
5.a.2. Ground water
0
0
0
0
0
0
0.00
0
0.00
5.b. To other sources
0
0
0
0
0
0
0.00
0
0.00
6. Total supply of water (= 4 + 5)
933.34
135.44
0.00
481.52
120.28
91.67
1,762.25
223.04
1,985.29
7. Consumption (= 3 - 6)
93.78
32.28
0
0
6,865.60
22.92
7,014.58
55.76
7,070.34
B. Physical supply table
(millions of m3)
1-3
5-33,
41-43
35
36
37
38, 39,
45-99
Total
0
10.99
0
481.52
0
50.81
- Reused water
0
3.90
0
0
0
- Wastewater to sewerage
0
7.09
0
0
933.34
124.45
0
- Agriculture
933.34
- Industries
+ Industries zones
Within the economy
4. Supply of water to other economic units
Into the environment
5. Total returns (= 5.a + 5.b)
5.a. To inland water resources
(= 5.a.1 + 5.a.2 )
(Sources: authors, 2017).
Description of relationship between
economy activities and water resources
in Nhue - Day river basin:
villages and households, and health
Figure 3 simulates the relationships
between the socio-economic activities
and water resources in the Nhue - Day
river basin. Accordingly, all entities
involved in water abstraction and use in
the basin include agriculture production
activities (cultivations and livestock
activities), industrial activities performed
by industrial zones, traditional craft
methodologies
services.
Compiling physical supply and use
table (PSUT):
Based on these relationships and
for
collecting
and
calculating data in Table 1, wastewater
and water use was calculated in Table
4, and Table 5. After considering the
completeness of data in the Nhue - Day
The PSUT tables compiled and
edited based on the standard SEEA-W
framework of United Nations and the
characteristics of the economic entities
and households in the Nhue - Day river
river basin, the relevant data in 2010 was
basin, describe the relationships between
chosen to calculate and fill in the SEEA-
the economy and water resources within
W’s account tables.
the basin (Table 6 and Table 7).
December 2017 • Vol.59 Number 4
Vietnam Journal of Science,
Technology and Engineering
85
Environmental Sciences | Climatology
Table 8. The ratios of wastewater which are without treatment or after on site treatment by economic sectors.
Agriculture
Industry (CEM-VEA [6])
Indicators
Industrial
zones
Manufacturing
outside of industrial
zones
Handicraft
villages
Health
facilities
H [8]
Cultivation [4]
Livestock [7]
Without treatment
100
39,9
15,63
7,69
96,9
29,55
70
After on-site treatment
0
61,1
84,37
92,3
0,96
70,45
30
(Sources: authors collected and estimated, 2017).
Table 9. Estimated the average of COD parameter by socio-economic sectors in the Nhue - Day river basin1.
Socio - economic activities
Average COD per m3 (Ton/m3)
Agriculture (1-3)
Cultivations
0.000024
Livestock
0.00063
Industries, building (5-33, 41-43)
0.00342
Industrial zone
0.00099
Manufacturing outside of industrial zones
0.00584
Handicraft villages
0.00099
Water collection, treatment and supply (ISIC 36)
N/a
Sewerage, including treatment of wastewater (ISIC 37)
N/a
Services activities (38,39, 45-99)
Health facilities
0.00085
Other services
N/a
Households (non code)
0.001067323
(Sources: calculated from environmental protection planning report to 2020 [4]).
Table 10. Emission account for the Nhue - Day river basin in 2010.
Industry (ISIC)
H
ROW
Total
23,273.39
16,7304.1
0.00
930,002.99
23,273.39
23,273.39
16,6635.0
0.00
929,326.20
N/a
23,266.90
23,266.90
16,6635.0
0.00
928,221.37
N/a
N/a
6.49
6.49
0.0
0.00
1,104.83
N/a
N/a
N/a
23,273.39
23,273.39
16,6635.0
0.00
777,478.34
0
N/a
N/a
N/a
0
0
0
0
0
0
7.7
N/a
N/a
N/a
0
0
669.1
0
676.79
2. Reallocation of emissions by ISIC 37
0
7.69
N/a
N/a
N/a
0
0
0.0
0
7.69
3. Net emissions (= 1.a + 2)
161.2
357,919.9
N/a
N/a
N/a
23,273.39
23,273.39
16,6635.0
0
929,333.89
Pollutant chemical oxygen demand
(ton of COD per year)
1-3
5-33,
41-43
35
36
37
38,39,
45-99
Total
1. Gross emissions (= 1.a + 1.b)
161.24
206,069.51
N/a
N/a
N/a
23,273.39
1.a. Direct emissions to water
(= 1.a.1 + 1.a.2 = 1.a.i + 1.a.ii)
161.24
357,912.26
N/a
N/a
N/a
1.a.1. Without treatment
157.62
357,368.67
N/a
N/a
1.a.2. After on-site treatment
3.62
541.02
N/a
1.a.i. To inland water resources
161.24
206,061.83
1.a.ii. To sea
0
1.b. To sewerage (ISIC 37)
(Sources: authors, 2017).
These indicators will be more realistic when there is actual observation data from environmental statistics agencies.
1
86
Vietnam Journal of Science,
Technology and Engineering
December 2017 • Vol.59 Number 4
Environmental Sciences | Climatology
Compiling emission account table:
In this study COD, an important
determinant for water quality, was
selected to compile the emission account
table in the Nhue - Day river basin.
Tables 8, 9 and 10 illustrate the ratio
of wastewater without treatment by
economic sectors, estimated average of
COD by economic sectors and areas, and
the emission account in the Nhue - Day
river basin respectively.
The integration of economic
information with water resources and the
policy significance:
In Table 11, a hybrid account
juxtaposes information from Tables 6
and 7 with the results of socio-economic
activities in the Nhue - Day river basin
with accounting data gathered from
PSUT and emission accounts tables
to calculate descriptive indicators
illustrating the relationships between the
economy and water resources within the
basin. The following table represents the
above-mentioned relationship.
Depending on the management
purposes of each sector, policy makers
can select and calculate necessary
indicators from the above account tables
to make informed relevant decisions
and policies to develop socio-economic
conditions and sustainable use of water,
for example, by having:
- Calculated the efficiency of
water use, the contribution of water
to production results of each industry
within the river basin, each locality in
the basin and in the whole basin.
- Identified the economic agents
in water abstraction, water use and
emission.
- Assessed different options to reduce
the pressures on water resources.
- Reflected relevant information on
water collection, treatment, distribution,
and water reuse by the economic sectors
and households in the economy.
- Applied the indicators in water
demand forecast, emission trend when
develop the socio-economic planning
and water resources management
scheme, etc.
In case of the sufficient data, the
results of SEEA-W also help to calculate
the values of water resources, the
changes in asset of water resources in
the physical or monetary aspects in the
Nhue - Day river basin.
Limitations:
There are some limitations of this
case study, which include (i) the lack of
available data, with some data sources
available but incomplete and fragmented
leading to development of estimates and
assumptions; (ii) statistical data on water
Table 11. Hybrid account for the Nhue - Day river basin in 2010.
Industries (by ISIC category)
Indicators
1-3
5-33, 41-43
35
36
37
38, 39, 45-99
Total
120,512.91
542,470
Rest
of the
world
Actual final
consumption
Total
H
G
N/a
N/a
N/a
542,469.70
A. The results of Economic activities
1. Total Gross Domestic Products (billions VND)
361,877.51
43,783.66
14,537.25
1,758.38
2. Value Added (VA)
N/a
N/a
N/a
N/a
N/a
N/a
N/a
N/a
N/a
N/a
N/a
3. Total use of water (millions of m3)
1,027.13
167.72
0.00
481.52
6,985.88
114.59
8,776.83
N/a
93.521
N/a
8,870.35
3.a. Total abstraction
1,005.95
139.85
0.00
481.52
6,865.60
8.52
8,501.44
N/a
8,501.44
- Abstraction for own use
1,005.95
139.85
0.00
0.00
6,865.60
8.52
8,019.92
N/a
N/a
8,019.92
3.b. Use of water received from other economic units
21.18
27.87
0.00
0.00
120.28
106.07
275.39
N/a
185.27
N/a
460.66
4. Total supply of water (millions of m )
0.00
10.99
0.00
481.52
0.00
50.81
543.32
N/a
66.91
N/a
610.23
4.a. Supply of water to other economic units
0.00
3.90
0.00
0.00
0.00
4.53
8.43
N/a
0
N/a
8.43
- Wastewater to sewerage
0.00
7.09
0.00
0.00
0.00
46.28
53.37
N/a
66.91
N/a
120.28
4.b. Total returns
933.34
124.45
0.00
0.00
120.28
40.86
1,218.94
156.12
N/a
1,375.06
5. Total (gross) emissions of chemical oxygen demand
(tons)
161.238
357,919.9
N/a
N/a
N/a
23,273.387
381,354.57
N/a
166635
N/a
547,989.57
261.05
N/a
1,051.69
61.807
N/a
N/a
N/a
61.16
B. Water Resource Information
3
C. Water resource management and policy indicators (example)
Average annual GDP per m3 by sectors in the provinces
in the Nhue - Day river basin (billions of VND per
millions of m3)
352.32
N/a
December 2017 • Vol.59 Number 4
Vietnam Journal of Science,
Technology and Engineering
87
Environmental Sciences | Climatology
resources are incompletely reported
by economic sectors. Therefore, to
implement this toolkit, it is necessary
to develop a comprehensive statistical
reporting system in the river basin.
Conclusions
While water problems are increasing,
information useful for decision makers
within the water sector and related to
the water sector appear to be decreasing.
Therefore, it is vital that the SEEA-W
framework in water-related policies and
water resources management strategy
in Vietnam be applied. A periodical
application of SEEA-W will assist
policy makers and water resources
managers to reflect the present status
of water resources and the relationship
between economic activities and water
resources. In this way, proper decisions
will be made to ensure achievement of
water-related sustainable development
goals.
Although the pilot study of
SEEA-W in the Nhue - Day river basin
reveals many difficulties at the initial
steps in terms of data and structural
organization, it demonstrates the
feasibility and significance of the river
basin-level approach when viewed from
the perception and orientation of water
88
Vietnam Journal of Science,
Technology and Engineering
resources management in Vietnam. In
order to improve the results of this pilot
study, the following activities need to be
undertaken: (i) complete the organization
of river basins in Vietnam with special
emphasis on environmental monitoring,
water-related (water abstraction, water
use, emission) statistics and reporting
schemes at basin level; (ii) develop a
water-related information system and
system for sharing information among
line ministries, agencies in the river
basins.
REFERENCES
[1] United Nations (2012), International
Recommendations for Water Statistics,
Department of Economic and Social Affairs
of the United Nations Secretariat, United
National Publication.
[2] A. Alfieri (2016), Lessons learnt
from the implementation of the SEEA-W,
Environmental-Economic Accounts Section of
the United Nations Statistics Division.
[3] Dinh Thuan Nguyen (2016),
Application of WEAP model on forecasting the
change of water quality to support for water
environmental protection planning, Case in
Day river basin.
[4] Centre for Environmenal Monitoring
(2012), The environmental protection planning
in Nhue - Day river basin to 2020.
[5] MONRE (2015), National technical
regulation on surface water quality.
December 2017 • Vol.59 Number 4
[6] Centre for Environmenal Monitoring
(2017), Portal for environmental monitoring of
the Nhue - Day river basin.
[7] Thi Thanh Huong Vu, Quoc Chinh
Vu and Thi Ha Chau Nguyen (2013), “The
results of field research and environmental
management solutions in small household
and farm households in some Northern
provinces”, Journal of water resources science
and technology, 18, pp.1-7.
[8] MONRE (2012), The National Strategy
on Environmental Protection to 2020.
[9] Department of Economic and Social
Affairs and Statistics Division (2012), System
of Environmental-Economic Accounting for
Water.
[10] UN World Water Assessment
Programme and United Nations Statisitics
Division (2011), Monitoring Framework for
Water.
[11] Ha Noi Statistical Office (2016),
Ha Noi Statistical Yearbook 2015, Statistical
Publishing House, Ha Noi.
[12] Ha Nam Statistical Office (2016),
Ha Nam Statistical Yearbook 2015, Statistical
Publishing House, Ha Noi.
[13] Nam Dinh Statisical Office (2015),
Nam Dinh Statistical Yearbook 2014,
Statistical Publishing House, Ha Noi.
[14] Ninh Binh Statistical Office (2016),
Ninh Binh Statistical Yearbook 2015, Statistical
Publishing House, Ha Noi.
[15] Hoa Binh Statistic Office (2016),
Hoa Binh Statistical Yearbook 2015, Statistical
Publishing House, Ha Noi.