Statistical evaluation of bivariate, ternary and discriminant function tectonomagmatic discrimination diagrams
Bạn đang xem bản rút gọn của tài liệu. Xem và tải ngay bản đầy đủ của tài liệu tại đây (6.14 MB, 54 trang )
Turkish Journal of Earth Sciences (Turkish J. Earth Sci.), Vol. 19, 2010, pp. 185–238. Copyright ©TÜBİTAK
doi:10.3906/yer-0901-6
First published online 14 August 2009
Statistical Evaluation of Bivariate, Ternary and
Discriminant Function Tectonomagmatic
Discrimination Diagrams
SURENDRA P. VERMA
Departamento de Sistemas Energéticos, Centro de Investigación en Energía,
Universidad Nacional Autónoma de México, Priv. Xochicalco s/no., Col. Centro, Temixco, Mor. 62580, Mexico
(E-mail: )
Received 06 January 2009; revised typescript received 27 April 2009; accepted 30 April 2009
Abstract: This work applies a statistical methodology involving the calculation of success rates to evaluate a total of 28
tectonomagmatic discrimination diagrams: four bivariate (Ti/Y-Zr/Y; Zr-Zr/Y; Ti/1000-V; and Nb/Y-Ti/Y); six ternary
(Zr-3Y-Ti/1000; MgO-Al2O3-FeOt, Th-Ta-Hf/3; 10MnO-15P2O5-TiO2; Zr/4-Y-2Nb; and La/10-Nb/8-Y/15); and three
old (Score1-Score2; F1-F2; and F2-F3) and three sets of new discriminant function diagrams (each set consisting of five
DF1-DF2 type diagrams proposed during 2004−2008). I established and used extensive geochemical databases of
Miocene to Recent fresh rocks from island arcs, back arcs, continental rifts, ocean-islands, and mid-ocean ridges. Rock
and magma types were inferred from a SINCLAS computer program. Although some of the existing bivariate and
ternary diagrams did provide some useful information, none was found to be totally satisfactory, because success rates
for pure individual tectonic settings typically varied from very low (1.1−41.6%) to only moderately high values
(63.6−78.1%) and seldom exceeded them. Additionally, only ‘combined’ tectonic settings were discriminated, or
numerous samples plotted in overlap regions designated for two or more tectonic settings or even in areas outside any
field. Furthermore, these old diagrams are generally characterized by erroneous statistical basis of closure problems or
constant sum constraints in compositional data and by subjective boundaries drawn by eye. All such diagrams,
therefore, should be abandoned and replaced by the new sets of discriminant function diagrams proposed during
2004−2010. These diagrams, especially those of 2006−2010 based on the correct statistical methodology and the
boundaries drawn from probabilities, showed very high success rates (mostly between 83.4% and 99.2%) for basic and
ultrabasic rocks from four tectonic settings and should consequently be adopted as the best sets of tectonomagmatic
discrimination diagrams at present available for this purpose. Three case studies from Turkey (Kula, Eastern Pontides,
and Lycian-Tauride) were also provided to illustrate the use of two new sets of discriminant function diagrams
(2006−2008). For the Kula area, both sets of major- and trace-element based diagrams provided results consistent with
a rift setting. For the Pontides area, trace-element based diagrams suggested an arc setting to be more likely, according
to both basic and intermediate rocks. For the Lycian ophiolites, however, only the major-element based set of diagrams
could be applied, and because of alteration effects, the tectonic inference between an arc or a MORB setting could not
be decisive. A newer set of immobile element based, highly successful diagrams currently under preparation (2010)
should provide a complementary set to the existing diagrams (2006−2008) for a better application of this important
geochemical tool. Further work on these lines is still necessary to propose discrimination diagrams for other types of
magmas such as those of intermediate silica compositions.
Key Words: volcanic rocks, basalts, geochemistry, igneous rocks, mathematical geology
İki ve Üç Değişkenli Tektonomagmatik Ayırtman
Diyagramlarının İstatistiksel Değerlendirmesi
Özet: Bu çalışmada, dört adet iki değişkenli (Ti/Y-Zr/Y; Zr-Zr/Y; Ti/1000-V; ve Nb/Y-Ti/Y), altı adet üç değişkenli (Zr3Y-Ti/1000; MgO-Al2O3-FeOt; Th-Ta-Hf/3; 10MnO-15P2O5-TiO2; Zr/4-Y-2Nb; ve La/10-Nb/8-Y/15), üç adet eski
(Score1-Score2; F1-F2; and F2-F3) ve her biri 2004–2008 arasında önerilmiş beş DF1-DF2 tipi diyagram içeren üç adet
yeni olmak üzere toplam 28 tektonomagmatik ayırtman diyagramını değerlendirmek üzere doğruluk oranı hesaplarını
185
STATISTICAL EVALUATION OF DISCRIMINATION DIAGRAMS
içeren istatistiksel bir yöntem uygulanmıştır. Bunun için, ada yaylarından, yay-ardı ortamlarından, kıtasal riftlerden,
okyanus adalarından ve okyanus ortası sırtlarından alınan Miyosen−Güncel yaşlı altere olmamış volkanik kayalara ait
jeokimyasal veri tabanı kullanılmıştır. Kaya ve magma tipleri SINCLAS bilgisayar programı yardımıyla elde edilmiştir.
Mevcut iki ve üç bileşenli diyagramların bazıları kullanışlı bilgiler vermiş olmasına rağmen, diyagramlar tek bir
tektonik ortam için doğruluk oranları çok düşük (%1.1–41.6) ve orta-yüksek değerler (%63.6–78.1) arasında veya bu
değerleri nadiren geçtiği için tam anlamıyla yeterli değildir. Sonuçta yalnızca kombine tektonik ortamlar ayırtlanmış ve
örneklerin birçoğu ya iki veya daha fazla tektonik ortam alanlarında aşmalar yapmış ya da herhangi bir alanın dışında
kalmıştır. Ayrıca, hatalı istatistiksel kapanma problemleri veya bileşimsel verilerde sabit toplam sınırlamaları içeren bu
eski diyagramların alan sınırları genelde sübjektif olarak gözle belirlenmiştir. Bu nedenle tüm bu ve benzer
diyagramların yerine 2004−2010 yıllarında önerilmiş yeni ayırtman diyagramları kullanılmalıdır. Özellikle 2006−2010
yıllarında önerilenler olmak üzere bu diyagramlar doğru istatistiksel yöntemlere dayalıdır. Alan sınırları olasılıklara
göre çizilmiştir ve dört farklı tektonik ortamdan bazik ve ultrabazik kayalar için çok yüksek doğruluk oranları (genelde
%83.4 ve %99.2 arasında) gösterirler. Bu çalışmada ayrıca iki yeni ayırtman diyagramı setinin (2006−2008) kullanımını
göstermek amacıyla Türkiye’den üç çalışma (Kula, Doğu Pontidler ve Likya-Torid) örneklendirilmiştir. Kula bölgesi için
hem ana hem de iz element diyagramları rift ortamları ile uyumlu sonuçlar vermiştir. Pontidler için iz element
diyagramları hem bazik hem de ortaç bileşimli kayalar için yay ortamını önermiştir. Likya ofiyolitleri için yalnızca ana
element diyagramları uygulanabilir ve alterasyon etkileri nedeniyle yay ve MORB ortamları arasında tektonik seçim
kesin değildir. Bu önemli jeokimyasal aracın daha iyi uygulanabilmesi amacıyla şu an hazırlanmakta olan (2009) ve
hareketsiz (immobile) elementleri kullanıp daha başarılı sonuçlar veren yeni diyagramlar (2010), mevcut diyagramlara
(2006−2008) tamamlayıcı bir set oluşturacaktır. Ortaç silisli gibi farklı tipteki magmaların ayırtlama diyagramları için
bu yönde çalışmaların arttırılması şarttır.
Anahtar Sözcükler: volkanik kayalar, bazaltlar, jeokimya, magmatik kayalar, matematiksel jeoloji
Introduction
Discrimination diagrams have been in use now for
nearly four decades since the advent of the plate
tectonics theory. The main tectonic settings are:
island arc, continental rift, ocean-island, and midocean ridge. Pearce & Cann (1971, 1973) pioneered
the idea that the magmas from different tectonic
settings might be distinguishable in their chemistry.
Interestingly, well before them, Chayes & Velde
(1965) attempted to distinguish two basalt types
(today recognised as island arc and ocean-island)
from discriminant functions of major-elements that
necessarily involved TiO2 as one of the
discriminating elements, although these authors did
not propose any diagrams to use their findings.
Since the early seventies, a plethora of
tectonomagmatic discrimination diagrams have
been proposed (see for reviews, e.g., Wang & Golver
III 1992; Rollinson 1993; Verma 1996, 1997, 2000,
2006, 2008; Vasconcelos-F. et al. 1998, 2001; Gorton
& Schandl 2000; Agrawal et al. 2004, 2008; Verma et
al. 2006). These diagrams were mostly meant for use
with basic igneous rocks. A few diagrams for granitic
or felsic rocks were also proposed (Pearce et al.
1984). The functioning of one such diagram –Rb
186
versus Y+Nb– was evaluated by Förster et al. (1997);
these authors concluded that for felsic rocks this
discrimination diagram does not work well and
should be used in combination with radiometric
dating and geologic assessment. Discrimination
diagrams are widely used for sedimentary rocks as
well (e.g., Bhatia 1983; Roser & Korsch 1986), which
were evaluated by Armstrong-Altrin & Verma
(2005), using published data from Miocene to Recent
sand and sandstone rocks from all around the world.
These authors concluded that there exists a need for
newer discriminant function diagrams because the
existing ones did not work well.
For this work, I selected examples from three
major categories of tectonomagmatic discrimination
diagrams and performed their statistical evaluation.
The first set included four simple bivariate diagrams
(viz., element-element, element-element ratio, or
ratio-ratio): (1) Ti/Y-Zr/Y of Pearce & Gale (1977);
(2) Zr-Zr/Y of Pearce & Norry (1979); (3) Ti/1000-V
of Shervais (1982); and (4) Nb/Y-Ti/Y of Pearce
(1982). The second set consisted of ternary
diagrams. These were: (5) Zr-3Y-Ti/1000 of Pearce &
Cann (1973); (6) MgO-Al2O3-FeOt of Pearce et al.
(1977); (7) Th-Ta-Hf/3 of Wood (1980); (8) 10MnO15P2O5-TiO2 of Mullen (1983); (9) Zr/4-Y-2Nb of
S.P. VERMA
Meschede (1986); and (10) La/10-Nb/8-Y/15 of
Cabanis & Lecolle (1989). The third and final set
included several old and new discriminant function
diagrams: (11) Score1-Score2 of Butler & Woronow
(1986); (12) F1-F2 of Pearce (1976); (13) F2-F3 of
Pearce (1976); (14) set of five discriminant function
diagrams based on major-elements (Agrawal et al.
2004); (15) set of five discriminant function
diagrams based on log-transformed ratios of majorelements (Verma et al. 2006); and (16) set of five
discriminant function diagrams based on logtransformed ratios of five relatively immobile traceelements (La, Sm, Yb, Nb and Th; Agrawal et al.
2008).
Given such a diversity of diagrams available for
basic igneous rocks, it is instructive to evaluate their
discriminating power, which could provide
constraints on their use. Earlier evaluations of a total
of 14 discrimination diagrams for igneous rocks
were carried out by Wang & Golver III (1992), using
geochemical data (some of them being average
values of a larger dataset) for 196 samples of Jurassic
basalts from eastern North America. These authors
concluded that none of the evaluated diagrams
worked well for discriminating the tectonic setting of
their compiled rocks. However, this evaluation was
rather limited or even probably biased, because
samples from only one part of the world (eastern
North America) were used, which is certainly not
representative of the entire Earth. Furthermore,
these samples were old (altered) rocks and their
tectonic setting was assumed from plate tectonic
reconstructions.
For the present paper, the following methodology
was used to provide an unbiased evaluation: (a)
establish representative databases for different
tectonic settings from all around the world; (b) plot
samples in the various diagrams to be evaluated and
obtain statistical information from each diagram;
and (c) report the implications of this evaluation in
terms of the utility of the diagrams, whether or not
they should be continued to be used. In addition to
evaluating the newer (2004−2008) diagrams, I also
compared the results with the statistical evaluation
done by the original authors (Agrawal et al. 2004,
2008; Verma et al. 2006). Finally, to illustrate the
application of discrimination diagrams I applied the
newest diagrams (2006−2008) obtained from the
correct statistical methodology of log-ratio
transformation and linear discriminant analysis
(LDA), to magmas from three areas of Turkey. Still
newer highly successful, natural logarithm-ratio
based, discriminant function discrimination
diagrams (a set of five diagrams) currently (2009)
under preparation by Verma & Agrawal, were also
mentioned, which should complement the new
(2006−2008) statistically correct diagrams.
Databases
Six extensive databases (B stands for basic magmas)
were prepared: (i) island arc (IAB); (ii) island back
arc; (iii) continental rift (CRB); (iv) ocean-island
(OIB); (v) ‘normal’ mid-ocean ridge (MORB); and
(vi) ‘enriched’ mid-ocean ridge (E-MORB).
Geochemical data were compiled for Miocene to
Recent rocks from different tectonic settings from all
over the world. For each database, samples from only
those areas with a known, uncontroversial tectonic
setting were compiled. Initially, databases for basic
and ultrabasic rocks from island arcs, continental
rifts, ocean-islands, and mid-ocean ridges were
established by Verma (2000, 2002, 2006), Agrawal et
al. (2004, 2008) and Verma et al. (2006). Later, I
included data for all types of rocks available from the
papers compiled in the above references as well as
some other more recent ones. This updated version
of these databases was used for the present work
although only those rock types, for which the
diagrams were initially proposed, were considered.
Their brief description is presented below.
The compiled island arcs (and the literature
sources) were: Aegean (Zellmer et al. 2000);
Aleutian (Kay et al. 1982; Myers et al. 1985, 2002;
Brophy 1986; Nye & Reid 1986; Romick et al. 1990;
Singer et al. 1992a; Kay & Kay 1994); Barren Island
(Alam et al. 2004; Luhr & Haldar 2006); Burma
(Stephenson & Marshall 1984); Izu-Bonin (Tatsumi
et al. 1992; Taylor & Nesbitt 1998); Japan (Sakuyama
& Nesbitt 1986; Togashi et al. 1992; Tamura 1994;
Kita et al. 2001; Sano et al. 2001; Kimura et al. 2002;
Moriguti et al. 2004; Kimura & Yoshida 2006);
Kamchatka (Kepezhinskas et al. 1997; Churikova et
al. 2001); Kermadec (Gamble et al. 1993, 1995; Smith
187
STATISTICAL EVALUATION OF DISCRIMINATION DIAGRAMS
et al. 2003; Wright et al. 2006); Kermadec-Havre
(Haase et al. 2002); Kuril (Zhuravlev et al. 1987;
Nakagawa et al. 2002); Lesser Antilles (Shimizu &
Arculus 1975; Arculus 1976; Brown et al. 1977;
Thirlwall & Graham 1984; Devine 1995; Smith et al.
1996; Thirlwall et al. 1997; Defant et al. 2001;
Zellmer et al. 2003; Lindsay et al. 2005); Luzon
(Defant et al. 1991; Castillo & Newhall 2004);
Mariana (Hole et al. 1984; Woodhead 1988; Bloomer
et al. 1989; Elliott et al. 1997; Wade et al. 2005); New
Hebrides (Dupuy et al. 1982; Monzier et al. 1997);
Papua New Guinea (Hegner & Smith 1992;
Woodhead & Johnson 1993); Philippines (Defant et
al. 1989; Knittel et al. 1997); Ryukyu (Shinjo et al.
2000); South Shetland (Smellie 1983); Sua (Turner &
Foden 2001); Sunda-Banda (Whitford et al. 1979;
Foden & Varne 1980; Wheller et al. 1987; Stolz et al.
1990; Hoogewerff et al. 1997); Taupo (Cole 1981;
Gamble et al. 1993); Tonga-Kermadec (Bryan et al.
1972; Ewart & Bryan 1972; Ewart et al. 1977);
Vanuatu (Barsdell 1988; Barsdell & Berry 1990; Peate
et al. 1997; Raos & Crawford 2004); and Yap system
(Ohara et al. 2002).
Back arc magmas from island arcs were separately
compiled; these were from: Alaska Peninsula
(Hildreth et al. 2004); Izu-Bonin (Tatsumi et al. 1992;
Taylor & Nesbitt 1998; Ishizuka et al. 2006); Japan
(Sakuyama & Nesbitt 1986; Ujike & Stix 2000;
Moriguti et al. 2004; Shuto et al. 2004; Kimura &
Yoshida 2006); Java (Edwards et al. 1994);
Kamchatka (Dorendorf et al. 2000; Churikova et al.
2001; Ishikawa et al. 2001); Kermadec (Gamble et al.
1995); Kermadec-Havre (Haase et al. 2002); Kuril
(Zhuravlev et al. 1987); Luzon (Defant et al. 1991);
Mariana Trough (Gribble et al. 1998); Papua New
Guinea (Woodhead & Johnson 1993); Philippines
(Bau & Knittel 1993); Ryukyu-Okinawa Trough
(Shinjo 1998, 1999; Shinjo et al. 2000); Sangihe
(Tatsumi et al. 1991); Sunda-Banda (Wheller et al.
1987; Stolz et al. 1988; Van Bergen et al. 1992; Turner
et al. 2003); and Taupo (Gamble et al. 1993).
The continental rifts compiled were: Abu Gabra
(Davidson & Wilson 1989); Africa–North West
(Bertrand 1991; Dautria & Girod 1991); Africa-West
(Kampunzu & Mohr 1991); Antarctica (Panter et al.
2000); Basin and Range (Singer & Kudo 1986; Lum et
al. 1989; Moyer & Esperança 1989; Perry et al. 1990;
188
Fitton et al. 1991; Feuerbach et al. 1993); Central
European Volcanic Province (Haase et al. 2004);
China-East (Peng et al. 1986; Zhi et al. 1990; Basu et
al. 1991; Fan & Hooper 1991; Liu et al. 1994); ChinaNorth (Han et al. 1999); China-North East (Liu et al.
1992; Zhang et al. 1995; Hsu et al. 2000; Zou et al.
2003); China-Leiqiong area (Ho et al. 2000); ChinaSouth East (Zou et al. 2000); Colorado Plateau
Transition to Basin and Range (Smith et al. 1999);
Columbia River Basalt (Maldonado et al. 2006); East
Africa (Aoki et al. 1985; De Mulder et al. 1986;
Auchapt et al. 1987; Kampunzu & Mohr 1991; Class
et al. 1994; Paslick et al. 1995; Le Roex et al. 2001);
Ethiopia (Hart et al. 1989; Deniel et al. 1994; Trua et
al. 1999; Barrat et al. 2003; Peccerillo et al. 2003);
Harney Basin (Streck & Grunder 1999; Streck 2002);
Kenya (Bell & Peterson 1991; MacDonald et al. 1995,
2001; Kabeto et al. 2001; Furman et al. 2004); Massif
Central (Chauvel & Jahn 1984; Pilet et al. 2005);
Newer Volcanic Province, Australia (Price et al.
1997); Rio Grande (Johnson & Lipman 1988;
Duncker et al. 1991; Gibson et al. 1992; McMillan et
al. 2000; Maldonado et al. 2006); San Quintín
Volcanic Field (Storey et al. 1989; Luhr et al. 1995);
Saudi Arabia (Camp et al. 1991); Spain-South East
(Benito et al. 1999); Taiwan-North West (Chung et
al. 1995); Taiwan Strait (Chung et al. 1994); Turkey
(Buket & Temel 1998; Aldanmaz et al. 2000; Alici et
al. 2002); Uganda-South West (Llyod et al. 1991);
U.S.A.-West (Leat et al. 1989; Kempton et al. 1991);
and West Antarctica (Hart et al. 1995).
Ocean-islands away from mid-ocean ridges were
compiled separately as OIB magmas from the
following localities: Atlantic (Blum et al. 1996;
Praegel & Holm 2006); Austral Chain, South Pacific
Ocean (Hémond et al. 1994); oceanic part of the
Camaroon Line (Deruelle et al. 1991; Lee et al. 1994);
Cape Verde Islands (Jørgensen & Holm 2002;
Doucelance et al. 2003; Holm et al. 2006); CookAustral Islands (Palacz & Saunders 1986); French
Polynesia (Liotard et al. 1986; Dupuy et al. 1988;
Dupuy et al. 1989; Cheng et al. 1993; Lassiter et al.
2003); Grande Comore Island (Class et al. 1998;
Class & Goldstein 1997; Claude-Ivanaj et al. 1998);
Hawaiian Islands (Chen et al. 1990; Lipman et al.
1990; Chen et al. 1991; Garcia et al. 1992; Maaløe et
al. 1992; West et al. 1992; Frey et al. 1994; Bergmanis
S.P. VERMA
et al. 2000; Ren et al. 2004); Heard Islands (Barling et
al. 1994); Kerguelen Archipelago (Storey et al. 1988;
Weis et al. 1993; Borisova et al. 2002); Madeira
Archipelago (Geldmacher & Hoernle 2000; Schwarz
et al. 2005); South Pacific (Hauri & Hart 1997;
Hekinian et al. 2003); Ponape Island (Dixon et al.
1984); Reunion Islands (Fretzdorf & Haase 2002);
Samoa Seamount (Hart et al. 2004); Society Chain
(Binard et al. 1993; Hémond et al. 1994); and Socorro
Islands (Bohrson & Reid 1995).
MORB data were compiled from the following
ridges: America-Antarctica (Le Roex & Dick 1981);
Chile (Bach et al. 1996); East Pacific Rise (Lonsdale
et al. 1992; Bach et al. 1994; Hekinian et al. 1996;
Sims et al. 2003); Galapagos Spreading Centre
(Schilling et al. 1982; Verma & Schilling 1982);
Genovesa (Harpp et al. 2003); Indian (Price et al.
1986; Dosso et al. 1988; Mahoney et al. 1992; Ray et
al. 2007); Mendocino (Kela et al. 2007); Mid-Atlantic
(Bryan et al. 1981; Schilling et al. 1983; Le Roex et al.
1987; Bougault et al. 1988; Dosso et al. 1993; Haase et
al. 1996; Le Roux et al. 2002a, 2002b); North Fiji
Basin (Monzier et al. 1997); Red Sea (Barrat et al.
2003); and Western Pacific (Park et al. 2006).
Finally, enriched types of MORB (E-MORB)
from locations at and near the ridges were separately
compiled. These were from: Amsterdam Island
(Doucet et al. 2004); Bouvet Island (Verwoerd et al.
1976; Le Roex & Erlank 1982); Galápagos Islands
(Geist et al. 1986; White et al. 1993); Iceland (Slater
et al. 1998); North Fiji Basin (Monzier et al. 1997);
and St. Paul Island (Doucet et al. 2004).
The magma types were determined from the
SINCLAS computer program (Verma et al. 2002),
which also provided standard igneous norms and
rock names strictly according to the IUGS
recommendations. It may be mentioned, in this
context, that many workers do not correctly follow
the IUGS recommendations for volcanic rock
classification (Le Bas et al. 1986; Le Bas 2000), for
which plotting the analytical data in a TAS diagram
without proper Fe oxidation recalculations and
anhydrous basis, is not the recommended procedure
unless Fe-oxidation varieties are individually
determined for all samples using classical analytical
procedures. Modern analytical instruments are not
generally capable of distinguishing between different
Fe-oxidation states, and therefore it is not a common
practice to analyse them separately. In this context,
in spite of the IUGS recommendations to use the
measured Fe-oxidation varieties as determined,
Middlemost (1989) had suggested that they should
not be used because they are highly susceptible to
changes related to weathering after magma
emplacement. On the other hand, because we are
dealing with compositional data, both individual
concentrations and sums strongly depend on the
procedure of Fe-ratio (Fe2O3 and FeO) adjustment
(e.g., Le Maitre 1976; Middlemost 1989), which
would affect rock and magma types inferred from
the TAS diagram. Furthermore, some rock names
actually depend on the CIPW norm values, for
which ‘standardised’ calculations are required
(Verma et al. 2003). I therefore strongly recommend
the use of a computer program, such as SINCLAS,
for these purposes. SINCLAS (Verma et al. 2002) is
freely available by request from any of the authors.
t
For evaluation of the MgO-Al2O3-FeO diagram
of Pearce et al. (1977), more differentiated
intermediate magmas, as inferred from SINCLAS,
were also used following the recommendations of
the original authors. Database compilation for the
companion paper by Verma et al. (2010) required all
kinds of magmas ranging from ultrabasic to acid
types to be separated and used for evaluation. The
additional literature references –besides those
above– for constructing the complete databases that
included all types of magmas, were as follows:
Barberi et al. (1975); Singer et al. (1992b); Tamura et
al. (2003); Izbekov et al. (2004); Schmitz & Smith
(2004); de Moor et al. (2005); Nakada et al. (2005);
Pallister et al. (2005); Ayalew et al. (2006); Hirotani
& Ban (2006); and Shukuno et al. (2006).
I finally stress that the present compilation
includes rocks from only ‘pure’ uncontroversial
tectonic settings, and therefore, for correct
discrimination, the application of discrimination
diagrams should result in unique tectonic settings.
Therefore, if a diagram designated an overlap region
of two different tectonic settings, a significant
number of samples should not plot there if that
particular diagram is to be determined as an efficient
one for rock discrimination.
189
STATISTICAL EVALUATION OF DISCRIMINATION DIAGRAMS
Results
(1) Ti/Y-Zr/Y of Pearce & Gale (1977)
All six databases (island arc, island back arc,
continental rift, ocean-island, normal mid-ocean
ridge, and enriched mid-ocean ridge) were used to
statistically evaluate four bivariate, six ternary, and
three old and three sets (each consisting of five
diagrams) of new discriminant function
discrimination diagrams (a total of 28 diagrams). For
some of these diagrams, Rickwood (1989) reported
boundary line coordinates, which have been useful
in reproducing the corresponding boundaries in
them.
This element ratio-element ratio diagram has been
widely used and is still in use, as demonstrated by
recent references during 2007−2008; a few of them
are: Birkenmajer et al. (2007); Shahabpour (2007);
and Cassinis et al. (2008).
The efficiency of a plot for a given tectonic
setting, also called ‘success rate’, is the ratio of the
correctly discriminated samples to the total number
of samples, expressed as the percentage of this ratio.
The incorrect discrimination or mis-discrimination
is the complement of the above efficiency. Thus,
efficiencies were calculated for all fields in a given
diagram, including those designated for overlap
regions and for other areas outside any given field
when this was so. The results are reported in three
subheadings – I. bivariate, II. ternary and III.
discriminant function – as follows.
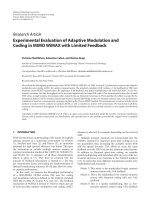
Numerous data plotted far beyond the dividing
line proposed by these authors (Figure 1); they were
discriminated by assuming a linear extension of this
line. For island arc and mid-ocean ridge samples
assumed to pertain to plate margin basalt (PMB)
compiled in this work, the plot showed a very high
efficiency of about 95.5% for main arcs, 90.3% for
back arcs and 94.7% for MORB, but lower for EMORB (58.3%). Note E-MORB compiled in this
work (e.g., Iceland, Galápagos, etc.) largely come
from plate margins, and therefore, should
theoretically plot in the PMB field. For the combined
group of within-plate basalt (WPB) samples, the
efficiency of correct discrimination was also high
(89.1%) for continental rifts and even increased to
98.0% for ocean-island setting. Thus, the incorrect
discrimination was very low (2.0% to 10.9%).
Four Bivariate Diagrams
All bivariate diagrams evaluated in this paper are
based on the so-called immobile or high field
strength elements Ti, Zr, Nb, Y, and V (Rollinson
1993), which seems to be an advantage for
application to altered samples, especially those from
older terrains. Nevertheless, the problems common
to all diagrams in this category are incorrect
statistical handling of compositional data (Aitchison
1982, 1986; Verma et al. 2006; Agrawal & Verma
2007) and use of boundaries subjectively drawn by
eye (Agrawal 1999). The lack of a representative
sample database may be another inherent problem in
the proposals of at least some of the diagrams
evaluated in this work (see Verma et al. 2006;
Agrawal et al. 2008). The conclusion of this statistical
evaluation is that all such simple bivariate diagrams
should be abandoned in favour of more complex
discriminant function bivariate diagrams.
190
The results of this evaluation are plotted in Figure
1 and summarised in Table 1. This diagram
discriminates only two grouped-tectonic settings,
i.e., the combined groups of plate-margin (supposed
to include arc and mid-ocean ridge settings) and
within-plate (includes rift and ocean-island settings).
The main limitation of this discrimination
diagram is that it actually distinguishes only two
tectonic settings (plate margin and within-plate),
instead of at least the four settings required for a
modern view of plate tectonics. Thus, the arc and
mid-ocean ridge settings cannot be distinguished
from one another, nor can continental rift and
ocean-island settings be distinguished from each
other. Furthermore, the boundary or dividing line,
drawn subjectively by eye, is too short and does not
provide good constraints on the discrimination of a
large number of samples that have greater Zr/Y
values than the dividing line (Figure 1).
Although characterised by high success rates, the
restricted power of discriminating only two
combined tectonic settings renders this diagram less
S.P. VERMA
references of this extensively cited work of Pearce &
Norry (1979). The diagram is of element-element
ratio type.
Figure 1.
Statistical evaluation of the Ti/Y-Zr/Y (Pearce &
Gale 1977) bivariate diagram for plate margin basalt
(PMB) and within-plate basalt (WPB), using basic
and ultrabasic rocks from different tectonic settings.
PMB is assumed to include both arc and mid-ocean
ridge (MOR) settings, whereas WPB would include
both continental rift and ocean-island settings. The
solid line is the boundary proposed by the original
authors. The symbols used are explained as inset (EMOR– enriched mid-ocean ridge). The same
symbols are maintained throughout Figures 2−16.
Statistical results are summarised in Table 1.
useful than the newer (discriminant function)
diagrams discussed later in this paper.
(2) Zr-Zr/Y of Pearce & Norry (1979)
The recent papers by Srivastava & Rao (2007), Bağcı
et al. (2008), Cassinis et al. (2008), Çelik & Chiaradia
(2008) and Jarrar et al. (2008) are among the recent
The diagram has a logarithmic scale for both axes
(Figure 2). The fields are totally enclosed in
parallelograms or rhombuses. Consequently,
samples can also plot outside any of the fields. Island
arc samples were poorly discriminated, with a very
low success rate of only about 39.2% plotting in the
sole field of IAB, whereas back arc magmas showed
an even worse efficiency (3.1%; region A in Figure 2;
Table 2). A small but significant proportion of
magmas (21.6% and 8.9%, respectively) plot in the
overlap region of IAB+MORB. Similarly, mid-ocean
ridge magmas (both MORB and E-MORB) were also
very poorly discriminated (Table 2; only 26.3% and
5.5% respectively plot in the pure MORB field B in
Figure 2, with 56.2% and 16.7% in the overlap region
D of IAB+MORB and 3.4% and 4.2% in the overlap
region E of WPB+MORB). These low success rates
imply inapplicability of this diagram for IAB and
MORB, because overlap regions are of no great value
in such discriminations unless one is considering
transitional setting or sources. As stated in the
‘Databases’ section, the data used in this evaluation
were compiled for pure, uncontroversial tectonic
settings, and therefore, overlap regions should
actually be considered as mis-discriminations. The
rift and ocean-island magmas, on the other hand,
showed a greater efficiency; about 65.7%, and 65.6%
of them plotted in the WPB field (see region C in
Figure 2; Table 2).
Table 1. Statistical evaluation information of Ti/Y-Zr/Y (Pearce & Gale 1977) bivariate diagram for plate
margin basalt (PMB) and within plate basalt (WPB).
Number of discriminated samples (%)
Tectonic setting
Island arc
Island back arc
Continental rift
Ocean-island
MORB
E-MORB
Total
samples
PMB
WPB
577 (100)
259 (100)
1040 (100)
1198 (100)
696 (100)
72 (100)
551 (95.5) *
234 (90.3)
105 (10.1)
24 (2.0)
659 (94.7)
42 (58.3)
26 (4.5)
25 (6.7)
935 (89.1)
1198 (98.0)
37 (5.3)
30 (41.7)
* Correct discrimination is indicated in bold when the inferred setting was similar to the expected one, or the
indicated setting pertained to an overlap region (for ** italic bold, see Table 2).
191
STATISTICAL EVALUATION OF DISCRIMINATION DIAGRAMS
Numerous samples plotted outside all the ‘closed’
fields (Figure 2; 1.9% to 32.3% in Table 2), and this is
a major defect of this diagram. The low success rates,
combined with this problem, indicate that this
diagram can only be used for within-plate magmas.
Pearce (1983) separated the fields of continental
and oceanic-arc basalts on the basis of Zr/Y value of
3 with some overlap around this value; samples
plotting above this value were identified as
continental arc, whereas below it as oceanic (or
island) arc. Nevertheless, for samples from an
unknown tectonic setting, confusion would prevail if
the samples with Zr/Y > 3 are truly continental arc
samples, or are from MORB or within-plate settings.
Figure 2.
Statistical evaluation of the Zr-Zr/Y bivariate
diagram (base 10 log-log scales; Pearce & Norry
1979) for island arc basalt (IAB; field A), withinplate basalt (WPB; field C), mid-ocean ridge basalt
(MORB; field B), overlap regions of IAB and MORB
(IAB+MORB; field D), and WPB and MORB
(WPB+MORB; field E), using basic and ultrabasic
rocks from different tectonic settings. For symbols
see Figure 1. Statistical results are summarised in
Table 2.
In the light of the very low success rates (3.1% to
65.7%), the use of this diagram is not recommended.
(3) Ti/1000-V of Shervais (1982)
This diagram has also been extensively used and
remains in use (e.g., Wiszniewska et al. 2007; Bruni
et al. 2008; Dampare et al. 2008), even though Verma
(2000) documented that the equi-Ti/V boundaries
proposed by Shervais (1982) did not work well.
Table 2. Statistical evaluation information of Zr-Zr/Y bivariate diagram (base 10 log-log scales; Pearce & Norry 1979) for island arc
basalt (IAB), mid-ocean ridge basalt (MORB), within plate basalt (WPB), overlap regions of IAB and MORB (IAB+MORB)
and of WPB and MORB (WPB+MORB).
Number of discriminated samples (%)
Tectonic
setting
Total
samples
Overlap
IAB
WPB
(IAB+MORB)
(WPB+MORB)
Other
(outside
any field)
MORB
Island arc
561 (100)
220 (39.2) **
31 (5.5)
34 (6.1)
121 (21.6) *
25 (4.4)
130 (23.2)
Island back arc
259 (100)
8 (3.1)
83 (32.0)
39 (15.1)
23 (8.9)
40 (15.4)
66 (25.5)
Continental rift
1040 (100)
6 (0.6)
683 (65.7)
19 (1.8)
14 (1.3)
33 (3.2)
285 (27.4)
Ocean-island
1198 (100)
0 (0.0)
786 (65.6)
2 (0.2)
0 (0.0)
23 (1.9)
387 (32.3)
MORB
696 (100)
10 (1.4)
75 (10.8)
183 (26.3)
391 (56.2)
24 (3.4)
13 (1.9)
E-MORB
72 (100)
27 (37.5)
23 (31.9)
4 (5.5)
12 (16.7)
3 (4.2)
3 (4.2)
* Correct discrimination is indicated in bold when the inferred setting was similar to the expected one, or the indicated setting
pertained to an overlap region.
** Correct discrimination is indicated in italic bold when the inferred setting was the same as the expected one and no overlap region
was indicated.
192
S.P. VERMA
The boundaries of equi-values of Ti/1000V for 10
to 100 are shown in Figure 3. They have been drawn
only up to the scale values presented by the original
author. Only 63.6% of island arc magmas were
correctly discriminated as IAB (Table 3). The back
arc magmas mostly plotted in the MORB field
(63.0%), with only 35.0% in the correct IAB field,
which is a drawback of this diagram. This point is
important because, in spite of the complex multicomponent sources in practically all tectonic
settings, the main purpose of discrimination
diagrams is to attain a high success rate for a given
tectonic setting, as will be seen later in newer
(2004−2008) discrimination diagrams (see the
section of ‘old and new sets of discriminant function
diagrams’).
The success rates for continental rift and ocean
island were considerably greater than those for arcs
(73.1% and 82.7%, respectively, as OIB; Table 3). The
discrimination of MORB was excellent (92.5% plot
in the MORB field; Table 3), although E-MORB were
poorly discriminated (50.7%) as MORB. Few
samples plot outside the acceptable range of
Ti/1000V= 10−100 (0.0% to 7.7%; Table 3).
Continental rift setting was not included in the
original diagram; it was implicitly assumed to belong
to the ocean-island setting in the present evaluation.
The diagram seems to work relatively well for IAB,
OIB and MORB (63.6−92.5%), but not for back arc
and E-MORB. The proposed equi-value boundaries
were drawn by eye. Incorrect statistical handling of
compositional data implied in this element-element
diagram is another defect (Agrawal & Verma 2007)
Figure 3.
Statistical evaluation of the Ti/1000-V bivariate
diagram (Shervais 1982) for island arc basalt (IAB;
Ti/1000V equi-values of 10−20), ocean-island basalt
(OIB; Ti/1000V equi-values 50-100), and mid-ocean
ridge basalt (MORB; Ti/1000V equi-values are
20−50), using basic and ultrabasic rocks from
different tectonic settings. For symbols see Figure 1.
Statistical results are summarised in Table 3.
that should be corrected in any new proposal based
on these and other immobile elements (Verma and
Agrawal, in preparation). Besides, significantly
better results (much greater success rates) were
obtained from the newer (2004−2008) diagrams (see
the section of ‘discriminant function discrimination
diagrams’ below), and therefore this Ti-V diagram
can be replaced by these newer trace-element based
discriminant function diagrams.
In view of the above considerations, my
conclusion is that this diagram can also be
abondoned.
Table 3. Statistical evaluation information of Ti/1000-V bivariate diagram (Shervais 1982) for island arc basalt (IAB), mid-ocean ridge
basalt (MORB), and ocean-island basalt (OIB).
Number of discriminated samples (%)
Tectonic
setting
Island arc
Island back arc
Continental rift
Ocean-island
MORB
E-MORB
Total
samples
IAB
OIB
MORB
Other
(outside any field)
450 (100)
203 (100)
769 (100)
1015 (100)
532 (100)
69 (100)
286 (63.6)
71 (35.0)
1 (0.1)
0 (0.0)
30 (5.6)
15 (21.8)
3 (0.7)
4 (2.0)
562 (73.1)
839 (82.7)
10 (1.9)
19 (27.5)
142 (31.5)
128 (63.0)
155 (20.2)
98 (9.6)
492 (92.5)
35 (50.7)
19 (4.2)
0 (0.0)
51 (6.6)
78 (7.7)
0 (0.0)
0 (0.0)
193
STATISTICAL EVALUATION OF DISCRIMINATION DIAGRAMS
(4) Nb/Y-Ti/Y of Pearce (1982)
This ratio-ratio diagram (Pearce 1982) also remains
widely used today (e.g., Greiling et al. 2007; BarbozaGudiño et al. 2008; Boztuğ 2008; Çelik 2008;
Femenias et al. 2008; Xu et al. 2008).
The diagram uses base 10 log-log scales and the
X−Y variables are characterised by a common
divisor (Y). The eye-drawn fields are enclosed in
closed boundaries (Figure 4). The region of solely arc
field (A in Figure 4) and mid-ocean ridge (M in
Figure 4) is limited; the overlap region of these two
settings (A+M) is considerably larger. Continental
rift and ocean-island settings are defined as a single
field (W in Figure 4).
The success rates for both island arc and back arc
magmas were extremely low (1.1% and 3.2%,
respectively) for pure field A (Figure 4; Table 4).
Similarly, very low success rates were obtained for
both MORB and E-MORB (8.6% and 8.0%,
respectively). Therefore, the diagram seems to be
practically useless for these (arc and MORB) settings
(Table 4). These (MORB and E-MORB) magmas
mostly (85.9% to 46.0%, respectively) plotted in the
overlap region of IAB+MORB. For continental rift
and ocean-island settings as within-plate, its
functioning was acceptable (success rates of 71.4%
and 87.4%, respectively; Table 4). However, a serious
problem recognised for arc and within-plate settings
is that a large proportion of samples (11.5% to
27.7%) plot outside of any of the recognised fields
(Table 4; Figure 4).
Figure 4.
Statistical evaluation of the Nb/Y-Ti/Y bivariate
diagram (Pearce 1982) for island arc basalt (IAB),
within plate basalt (WPB), and mid-ocean ridge
basalt (MORB), using basic and ultrabasic rocks
from different tectonic settings. A– arc; M– MORB;
A+M– overlap region of arc and MORB; and W–
within-plate. For symbols see Figure 1. Statistical
results are summarised in Table 4.
This diagram is not recommended to be used for
arc and MORB settings, although it can effectively
discriminate within-plate magmas from them.
Continental rift and ocean-island cannot be
discriminated. The overall conclusion is that this
diagram should be abondoned.
Six Ternary Diagrams
As for bivariate diagrams, most (four out of six)
ternary diagrams evaluated in this paper are based
Table 4. Statistical evaluation information of Nb/Y-Ti/Y bivariate diagram (Pearce 1982) for island arc basalt (IAB), within plate
basalt (WPB), and mid-ocean ridge basalt (MORB).
Number of discriminated samples (%)
Tectonic
setting
Total
samples
IAB
WPB
MORB
Overlap
(IAB+MORB)
Other
(outside any field)
Island arc
438 (100)
5 (1.1)
0 (0.0)
52 (11.9)
312 (71.2)
69 (15.8)
Island back arc
249 (100)
8 (3.2)
13 (5.2)
21 (8.5)
138 (55.4)
69 (27.7)
Continental rift
974 (100)
0 (0.0)
696 (71.4)
70 (7.2)
24 (2.5)
184 (18.9)
Ocean-island
1197 (100)
0 (0.0)
1046 (87.4)
11 (0.9)
2 (0.2)
138 (11.5)
MORB
617 (100)
2 (0.3)
19 (3.1)
53 (8.6)
530 (85.9)
13 (2.1)
E-MORB
63 (100)
0 (0.0)
42 (46.0)
5 (8.0)
29 (46.0)
0 (0.0)
194
S.P. VERMA
on the so-called immobile elements Ti, P, Zr, Hf, Nb,
Y, and V (Rollinson 1993), which seems to be an
advantage for application to altered samples
especially from older terrains. Two diagrams are
based on major elements. The major problems
common to all diagrams in this category are
incorrect statistical handling of compositional data
(Aitchison 1982, 1986; Agrawal & Verma 2007) and
use of boundaries subjectively drawn by eye
(Agrawal 1999). The reconstruction of ternary
variables from any kind of experimentally measured
variables imposes a further constant-sum constraint
on these diagrams. Note that these ternary diagrams
can be easily replaced by natural log-ratio bivariate
diagrams (Verma & Agrawal, in preparation) and, if
necessary, new bivariate diagrams based on only
three variables can be proposed.
(5) Zr-3Y-Ti/1000 Ternary Diagram of Pearce &
Cann (1973)
This ternary diagram (Pearce & Cann 1973) has been
very popular with thousands of references in the
published literature; recent ones include: Ghosh et al.
(2007); Shekhawat et al. (2007); Çelik & Chiaradia
(2008); and Kumar & Rathna (2008).
This diagram includes fields for island arc
tholeiites (IAT; field A in Figure 5), calc-alkaline
basalts (CAB; field C), and within-plate basalts
(WPB; field D). An overlap region (field B) of IAT
and CAB with MORB or ocean floor basalt (OFB)
was also proposed. Because MORB setting was not
Figure 5.
Statistical evaluation of the Zr-3Y-Ti/1000 ternary
diagram (Pearce & Cann 1973) for island arc
tholeiites (IAT; field A), calc-alkaline basalts (CAB;
field C), and within-plate basalts (WPB; field D),
using basic and ultrabasic rocks from different
tectonic settings. Field B is overlap region of IAT,
CAB, and MORB. For symbols see Figure 1.
Statistical results are summarised in Table 5.
discriminated without overlap (i.e., it was proposed
to overlap with the arc setting), MORB samples were
not used in this evaluation. The fields are enclosed in
distinct areas (Figure 5). An error in the ternary
coordinates of field boundaries summarised by
Rollinson (1993) was also corrected.
The statistical results are presented in Table 5.
The nomenclature of IAT and CAB used by Pearce &
Table 5. Statistical evaluation information of Zr-3Y-Ti/1000 ternary diagram (Pearce & Cann 1973) for island arc tholeiites (IAT),
calc-alkaline basalts (CAB), and within plate basalts (WPB).
Number of discriminated samples (%)
Tectonic
setting
Total
samples
IAT
Island arc
579 (100)
Island back arc
259 (100)
Continental rift
1039 (100)
6 (0.6)
Ocean-island
1198 (100)
0 (0)
CAB
WPB
Overlap
(IAT+CAB+
OFB)*
Other
(outside any
field)
129 (22.3)
66 (11.4)
16 (2.8)
264 (45.6)
104 (18.0)
1 (0.4)
113 (43.6)
24 (9.3)
115 (44.4)
6 (2.3)
54 (5.2)
746 (71.8)
49 (4.7)
184 (17.7)
13 (1.1)
1000 (83.5)
7 (0.6)
178 (14.8)
* OFB–ocean floor basalt.
195
STATISTICAL EVALUATION OF DISCRIMINATION DIAGRAMS
Cann (1973) is no longer recommended by the IUGS
for the classification of volcanic rocks (see Le Bas et
al. 1986; Le Bas 2000; Le Maitre et al. 2002). Any
genetic meaning of the ‘calc-alkaline’ term has been
also questioned (Sheth et al. 2002). In spite of these
objections, in order to evaluate this diagram we must
assume that IAT and CAB, including their overlap
region, represent island arc magmas (main arcs as
well as back arcs), and WPB includes the CRB and
OIB settings. If so, this diagram (Figure 5) may
discriminate only two sets of tectonic settings: IAB
on one hand (correct discrimination being
represented by IAT, CAB and the overlap region) and
combined CRB and OIB on the other (WPB region).
With this assumption, only 22.3% and 11.4% of
island arc magmas plot in the IAT and CAB fields,
respectively, with the bulk of samples (45.6%) falling
in the overlap region with MORB (Table 5). Thus, the
total success rate of about 33.7% was unacceptably
low for arc magmas. Only about 2.8% and 18.0% of
the samples plot incorrectly as within-plate or
outside of any of these fields, respectively. Back arc
magmas were mostly discriminated in the CAB
(43.6%) and overlap region (44.4%), with only 11.6%
mis-discriminated samples. 71.8% of the CRB and
83.5% of the OIB samples plot in the WPB field,
whereas most of the remaining mis-discriminated
samples (17.7% and 14.8%, respectively) plot outside
any of the specified fields.
construct this diagram, it is easy to use it for most
applications. The mobility of major elements,
however, casts doubt on results from older, altered
terrains, which may be one of the reasons not to use
this diagram.
All tectonic settings except continental arc are
represented in this diagram (Figure 6). For its
evaluation, I separated subalkaline rocks in the silica
range of 51−56% on an anhydrous basis (using
SINCLAS program, Verma et al. 2002). The arc and
MORB magmas show relatively high success rates
(63.9−72.9%; Table 6). However, continental rift and
ocean-island are very poorly discriminated (only
17.6% and 14.9%, respectively, plot in the correct
fields; Table 6); most of them (52.1% and 70.2%)
were wrongly discriminated as MORB. The success
rates that characterise this diagram have been totally
superseded by new major element based
discriminant function diagrams (Agrawal et al. 2004;
Verma et al. 2006).
For all the above reasons, continued use of this
diagram is not recommended.
Although from the above assumption a fairly
good discrimination results for within-plate
magmas, the limitation of this ternary diagram is
that it discriminates only two groups of tectonic
settings (IAB –with IAB+MORB– and CRB+OIB),
with no provision for either discriminating MORB,
or for the separate identification of CRB and OIB.
Holm (1982) noted that continental tholeiites were
poorly recognised as IAT on this diagram (Figure 5).
The use of this diagram is not recommended: it
should be abandoned in favour of the newer
(2004−2008, 2010) diagrams.
(6) MgO-Al2O3-FeOt of Pearce et al. (1977)
This diagram has been used and remains in use (e.g.,
Yang et al. 2007; Appelquist et al. 2008; Nardi et al.
2008). Because only major elements are required to
196
Figure 6.
Statistical evaluation of the MgO-Al2O3-FeOt ternary
diagram (Pearce et al. 1977) for island and
continental arc (IA+CA shown as IA), mid-ocean
ridge and ocean floor (termed as MOR), continental
rift (CR), ocean-island (OI), and spreading centre
island (termed in the present work as E-MOR), using
basaltic and andesitic rocks (samples with (SiO2)adj
between 51−56%) from different tectonic settings.
For symbols see Figure 1. Statistical results are
summarised in Table 6.
S.P. VERMA
Table 6. Statistical evaluation information* of MgO-FeOt-Al2O3 ternary diagram (Pearce et al. 1977) for island and continental arc
(IA+CA), mid-ocean ridge (MOR) and ocean floor, continental rift (CR), ocean-island (OI) and spreading centre island (also
termed here as E-MOR).
Number of discriminated samples (%)
Tectonic
setting
Island arc
Island back arc
Continental rift
Ocean-island
MORB
E-MORB
Total
samples
(IA+CA)
CR
OI
MOR
E-MOR
Other
(outside any field)
583 (100)
194 (100)
142 (100)
94 (100)
200 (100)
3
425 (72.9)
124 (63.9)
36 (25.4)
1 (1.1)
16 (8.0)
0
12 (2.1)
1 (0.5)
25 (17.6)
13 (13.8)
26 (13.0)
2
37 (6.3)
0 (0.0)
4 (2.8)
14 (14.9)
22 (11.0)
0
36 (6.2)
67 (34.6)
74 (52.1)
66 (70.2)
136 (68.0)
0
72 (12.3)
2 (1.0)
3 (2.1)
0 (0.0)
0 (0.0)
1
1 (0.2)
0 (0.0)
0 (0.0)
0 (0.0)
0 (0.0)
0
* Only subalkaline rocks used with 51–56% (SiO2)adj (see Verma et al. 2002, for the correct meaning of the subscript adj).
(7) Th-Ta-Hf/3 of Wood (1980)
This ternary diagram (Wood 1980; see also Wood et
al. 1979) remains widely used, e.g., by Rahmani et al.
(2007); Keskin et al. (2008); and Peng et al. (2008).
The proposed fields are closed and are of
complicated shapes (Figure 7).
In addition to N-MORB, an E-MORB setting is
also discriminated on this diagram (Figure 7). The
arc field is subdivided into island arc tholeiite and
calc-alkali basalt, but because this is not the accepted
nomenclature by the IUGS (Le Bas et al. 1986; Le
Maitre et al. 2002), I did not make this distinction in
the present evaluation. Nevertheless, the within-plate
setting is not subdivided into continental rift and
ocean-island settings.
Both island arc and back arc magmas are
correctly discriminated, with high success rates of
about 87.4% and 75.0%, respectively (Table 7). The
discrimination of continental rift and ocean-island
magmas as within-plate magmas is also acceptable
(63.0% and 69.9%). Finally, a fairly large proportion
(68.1%) of mid-ocean ridge basalt is also correctly
discriminated. However, these success rates are
certainly smaller than those obtained for some
discriminant function diagrams (see the later
section). I did not calculate the percentages of EMORB discrimination, because the total number of
E-MORB samples with the chemical variables for
this ternary diagram was very small (only 10). One
Figure 7.
Statistical evaluation of the Th-Ta-Hf/3 ternary
diagram (Wood 1980) for island arc basalt (IAB; field
D), within-plate basalt (WPB; field C), normal type
mid-ocean ridge basalt (N-MORB; field A), and
enriched type mid-ocean ridge basalt (E-MORB;
field B), using basic and ultrabasic rocks from
different tectonic settings. For symbols see Figure 1.
Statistical results are summarised in Table 7.
major drawback, besides of course the closure
problem and the combined within-plate field
(without distinguishing rift from ocean-island), is
that numerous samples (2.4% to 17.3%) plot outside
all fields (Figure 7; Table 7).
197
STATISTICAL EVALUATION OF DISCRIMINATION DIAGRAMS
Table 7. Statistical evaluation information of Th-Ta-Hf/3 ternary diagram (Wood 1980) for island arc basalt (IAB), within plate basalt
(WPB), normal type mid-ocean ridge basalt (N-MORB), and enriched type mid-ocean ridge basalt (E-MORB).
Number of discriminated samples (%)
Tectonic
setting
Island arc
Island back arc
Continental rift
Ocean-island
MORB
E-MORB
Total
samples
IAB
WPB
N-MORB
E-MORB
Other
(outside any field)
175 (100)
92 (100)
508 (100)
502 (100)
138 (100)
10
153 (87.4)
69 (75.0)
26 (5.1)
2 (0.4)
2 (1.5)
0
2 (1.1)
1 (1.1)
320 (63.0)
351 (69.9)
11 (8.0)
2
5 (2.9)
5 (5.4)
5 (1.0)
2 (0.4)
94 (68.1)
0
8 (4.6)
7 (7.6)
69 (13.6)
135 (26.9)
18 (13.0)
7
7 (4.0)
10 (10.9)
88 (17.3)
12 (2.4)
13 (9.4)
1
Although the diagram seems to perform
satisfactorily, the closure problem and eye-fitted
boundaries related to ternary diagrams still apply,
and therefore, the excellent discriminating
properties of elements such as Th, Hf and Ta, should
be used to advantage in a new set of discriminant
function diagrams (see Agrawal et al. 2008; Verma &
Agrawal, manuscript in preparation).
(8) 10MnO-15P2O5-TiO2 of Mullen (1983)
Pal et al. (2007), Çelik (2008), and Bonev & Stampfli
(2008) are among the recent references that still used
this major element based ternary diagram. Contrary
to other ternary diagrams, this diagram has divided
the entire ternary field into six tectonic regions,
although boninite and calc-alkali basalt fields are not
clearly subdivided by a boundary (Figure 8). The
setting of IAB can be assumed to be represented
collectively by IAT, CAB and Bon (Table 8); similarly,
OIB can be supposed to include OIT and OIA.
With these assumptions, island arc and back arc
magmas show high collective success rates of about
96.2% and 84.2%, respectively (Table 8). The
collective success rates of continental rift and oceanisland were also high (92.1% and 65.6%; Table 8).
MORB magmas were not efficiently discriminated
on this diagram (only about 54.2% plotted as MORB;
Table 8). E-MORB samples were mostly wrongly
discriminated as IAT (46.1%). Additionally, the
relative mobility of these major elements,
particularly Mn, may also be of concern in its use for
older terrains. The error distortion and closure
198
Figure 8.
Statistical evaluation of the 10MnO-10P2O5-TiO2
ternary diagram (Mullen 1983) for island arc
tholeiite (IAT), calc-alkaline basalt (CAB), boninite
(Bon), ocean-island tholeiite (OIT), ocean-island
alkali basalt (OIA), and mid-ocean ridge basalt
(MORB), using basic and ultrabasic rocks from
different tectonic settings. CAB+IAT+Bon could be
collectively termed as island arc, whereas OIT+OIA
can be named as ocean-island or within-plate
(because rift setting was not included here). For
symbols see Figure 1. Statistical results are
summarised in Table 8.
problems will persist in all ternary diagrams,
including this one (Verma, in preparation).
Better alternatives of discriminant function
diagrams should be sought. Nevertheless, for
relatively unaltered samples the diagram performs
better than most other bivariate and ternary
S.P. VERMA
Table 8. Statistical evaluation information of 10MnO-10P2O5-TiO2 ternary diagram (Mullen 1983) for island arc calc-alkaline basalt
(CAB), island arc tholeiite (IAT) and boninite (Bon), ocean-island tholeiite (OIT), ocean-island alkali basalt (OIA), and midocean ridge basalt (MORB).
Number of discriminated samples (%)
Tectonic
setting
Island arc
Island back arc
Continental rift
Ocean-island
MORB
E-MORB
Total
samples
628 (100)
272 (100)
1274 (100)
1474 (100)
963 (100)
91 (100)
Island arc
Ocean-island
MORB
CAB
IAT
Bon
OIT
OIA
209 (33.3)
111 (40.8)
15 (1.2)
0 (0.0)
3 (0.3)
1 (1.1)
365 (58.1)
117 (43.0)
68 (5.3)
0 (0.0)
282 (29.3)
42 (46.1)
30 (4.8)
1 (0.4)
0 (0.0)
412 (34.4)
1 (0.1)
4 (4.4)
0 (0.0)
0 (0.0)
84 (6.6)
2 (0.2)
76 (7.9)
14 (15.4)
18 (2.9)
33 (12.1)
1077 (85.5)
784 (65.4)
79 (8.2)
16 (17.6)
6 (0.9)
10 (3.7)
30 (2.4)
66 (0.0)
522 (54.2)
14 (15.4)
diagrams hitherto discussed, except for MORB
samples. I propose that newer major element based
discriminant function diagrams (set of five diagrams
by Verma et al. 2006) with greater discriminating
power, be adopted as the best alternative to this
major element based ternary diagram.
(9) Zr/4-Y-2Nb of Meschede (1986)
This diagram is still in use, e.g., Raza et al. (2007),
Rao & Rai (2007), Keskin et al. (2008), Ahmad et al.
(2008); and Çelik & Chiaradia (2008).
No overlap-free region for IAB or MORB was
proposed in this diagram (Figure 9). CRB and OIB
also can only be collectively discriminated. An
advantage seems to be that it supposedly
discriminates E-MORB from other tectonic varieties.
A large proportion of arc magmas (about 68.6%) plot
in the overlap region of IAB+MORB, whereas about
42.4% of back arc magmas occupy the overlap region
of IAB+WPT (Table 9; Figure 9). The success rates
for continental rift and ocean-island were relatively
high, with about 76.1% and 79.7% samples plotting
in the within-plate field. MORB magmas mostly plot
in the overlap region with IAB (about 73.2%; Table
9). However, E-MORB samples were erroneously
discriminated mostly as overlap of IAB+MORB
(46.0%) and WPB (31.7%), with only about 12.7%
correctly discriminated as E-MORB (Table 9). A
considerable number of samples of OIB and CRB
also plotted outside of any tectonic field (11.7% and
15.6%, respectively; Figure 9; Table 9).
Figure 9.
Statistical evaluation of the Zr/4-Y-2Nb ternary
diagram (Meschede 1986) for within-plate alkali
basalt and tholeiite (WPB; regions A), enriched type
mid-ocean ridge basalt (E-MORB; region B), overlap
region of island arc basalt and within-plate tholeiite
(IAB+WPT; region C), and overlap region of normal
type island arc basalt and mid-ocean ridge basalt
(IAB+N-MORB; region D), using basic and
ultrabasic rocks from different tectonic settings. For
symbols see Figure 1. Statistical results are
summarised in Table 9.
The major defect of this diagram is that it does
not specify an overlap-free region for either IAB, or
for MORB. Furthermore, the problems of wrong
discrimination of E-MORB and the inability to
separate continental rift and ocean-island are
sufficient reasons to abandon this diagram as well.
199
STATISTICAL EVALUATION OF DISCRIMINATION DIAGRAMS
Table 9. Statistical evaluation information of Zr/4-Y-2Nb ternary diagram (Meschede 1986) for within-plate alkali basalt and tholeiite
(WPB), enriched type mid-ocean ridge basalt (E-MORB), overlap region of within-plate tholeiite and island arc basalt
(WPT+IAB) and overlap region of normal type mid-ocean ridge basalt and island arc basalt (IAB+N-MORB).
Number of discriminated samples (%)
Tectonic
setting
Island arc
Island back arc
Continental rift
Ocean-island
MORB
E-MORB
Total
samples
437 (100)
250(100)
1020 (100)
1197 (100)
617 (100)
63 (100)
Overlap region
WPB
14 (3.2)
42 (16.8)
3776(76.1)
954 (79.7)
27 (4.4)
20 (31.7)
(IAB+WPT)
(IAB+MORB)
Other
(outside any
field)
76 (17.4)
106 (42.4)
40 (3.9)
3 (0.2)
72 (11.7)
5 (7.9)
300 (68.6)
91 (36.4)
20 (2.0)
0 (0.0)
452 (73.2)
29 (46.0)
24 (5.5)
1 (0.4)
159 (15.6)
140 (11.7)
0 (0.0)
1 (1)
E-MORB
23 (5.3)
10 (4.0)
25 (2.4)
100 (8.4)
66 (10.7)
8 (12.7)
All of these problems have been overcome in newer
diagrams (Agrawal et al. 2008; Verma & Agrawal, in
preparation).
(10) La/10-Nb/8-Y/15 of Cabanis & Lecolle (1989)
Raveggi et al. (2007), Koçak (2008) and Kurt et al.
(2008) are among the recent authors that used this
ternary diagram. The diagram basically includes
fields for volcanic arc basalt (field A), continental
basalt (field B), and oceanic basalt (field C). Futher
subdivisions of fields were also proposed, which are
not evaluated in the present work. For example, field
A includes IAT and CAB and an overlap region of
IAT and CAB. Field B includes (perhaps less
conventionally) continental basalt and back-arc
basin basalt. Field C of oceanic basalt is subdivided
into alkali basalt from intercontinental rift (again,
not a valid nomenclature), E-type MORB and
normal MORB. In the present evaluation, however,
and for simplicity, field A was assumed to
correspond to IAB, field B to CRB, and field C to
OIB+MORB. This simple approach is the only one
that can be practiced in the light of the confused
nomenclature used by these authors.
Figure 10 presents a plot of all data on this ternary
diagram. The results are summarized in Table 10.
About 78.1% and 74.3% of island arc and back arc
magmas, respectively, correctly plot in the IAB field,
with most of the remaining samples being misdiscriminated as field B (CRB in Table 10). Only
200
Figure 10. Statistical evaluation of the La/10-Nb/8-Y/15 ternary
diagram (Cabanis & Lecolle 1989) assumed to
discriminate arc basalt (IAB), continental basalt
(CRB), and ocean floor basalt (OIB+N-MORB+EMORB), using basic and ultrabasic rocks from
different tectonic settings. For symbols see Figure 1.
Statistical results are summarised in Table 10.
about 41.6% of the CRB samples were correctly
discriminated in field B, with the greater number of
the samples (55.4%) being mis-discriminated as
OIB+MORB (field C in Figure 10). Similarly,
numerous OIB samples (54.6%) were wrongly
discriminated as CRB (field B) as compared to 44.6%
correctly discriminated in the overlap region of
OIB+MORB (field C, OIB+MORB). For MORB too,
S.P. VERMA
Table 10. Statistical evaluation information of La/10-Nb/8-Y/15 ternary diagram (Cabanis & Lecolle 1989), assumed to discriminate
arc basalt (IAB), continental basalt (CRB), and ocean floor basalt (OIB+N-MORB+E-MORB).
Number of discriminated samples (%)
Tectonic setting
Island arc
Island back arc
Continental rift
Ocean-island
MORB
E-MORB
Total samples
347 (100)
167 (100)
796 (100)
793 (100)
489 (100)
55 (100)
IAB
CRB
OIB+MORB
271 (78.1)
124 (74.3)
24 (3.0)
6 (0.8)
46 (0.8)
0 (0.0)
72 (20.7)
42 (25.1)
331 (41.6)
433 (54.6)
299 (61.1)
21 (38.2)
4 (1.2)
1 (0.6)
441 (55.4)
354 (44.6)
144 (29.4)
34 (61.8)
the correct discrimination was very poor (only about
29.4% samples plotting in field C, with most of them
erroneously plotting in field B). The number of EMORB samples having data for these ternary
elements (La, Nb, and Y) was limited in our database
(only 55 samples), although most of them (about
61.8%) plotted in field C (OIB+MORB).
The limitations of this ternary diagram are that it
does not discriminate an ocean-island setting from
MORB or continental rift, and that the CRB, OIB
and MORB magmas compiled in the present work
were poorly discriminated. Additionally, the main
drawback of this diagram is that the nomenclature
used (such as intercontinental rift) does not strictly
correspond to plate tectonic theory.
Due to the above complications and relatively
poor performance of the diagram, I propose that it
should also be abandoned in favour of the newer set
of diagrams, e.g., the set of five new diagrams by
Agrawal et al. (2008) discussed in the next section,
‘discriminant function diagrams’, and still newer
(2010) diagrams (Verma & Agrawal, in preparation).
Old and New Sets of Discriminant Function
Diagrams
The old diagrams in this category have been very few
(Score1-Score2 diagram of Butler & Woronow 1986;
and two bivariate diagrams based on F1-F2-F3 of
Pearce 1976). Newer diagrams were proposed during
2004−2008, and yet another set (2010) is currently
under preparation. The constant sum or closure
problem of compositional data can be overcome by
discriminant function diagrams (Aitchison 1982,
1986; Rollinson 1993; Agrawal & Verma 2007). Use
of probability-based objective boundaries can be
another asset of new discrimination diagrams
(Agrawal 1999; Agrawal et al. 2004, 2008; Verma et
al. 2006). These reasons, combined with significantly
high success rates documented for the newer
diagrams (2004−2008; see the later part of this
section), are sufficient to justify adopting them for all
future applications of this geochemical tool.
(11) Score1-Score2 Diagram of Butler & Woronow
(1986)
Besides Verma et al. (2006), Verma (2006), and
Agrawal et al. (2008), there has been no other
reference during 2006−2008 to the paper by Butler &
Woronow (1986). The Score1-Score2 diagram is
much less used probably because of the complicated
calculations involved, which are more difficult than
those for the simpler bivariate and ternary diagrams.
Furthermore, Rollinson (1993; p. 179) committed a
serious reproduction error in the score1 equation and
failed to explain correctly the meaning of Ti (=100
times TiO2) and Y (=3 times Y) in the score1 and
score2 equations. However, Verma (2006, 2009a),
basing the application on the original paper by Butler
& Woronow (1986), successfully used this diagram
for the complex and controversial tectonic setting of
Mexican Volcanic Belt and Los Tuxtlas volcanic field
of southern Mexico.
The correct equations are as follows:
Score1 = – (37.07 × TiO2) – (0.0668 × Zr) –
(1.1961 × Y) + (0.8362 × Sr)
(1)
201
STATISTICAL EVALUATION OF DISCRIMINATION DIAGRAMS
Score2 = – (33.76 × TiO2) – (0.5602 × Zr) +
(2.2191 × Y) + (0.1582 × Sr)
(2)
where TiO2 is in %m/m, Zr, Y and Sr are in μg/g.
Butler & Woronow (1986) elaborated on the
closure problem encountered in the conventional
Zr–3Y–Ti/1000 ternary diagram (Figure 5) of Pearce
& Cann (1973) and, using the combination of
Aitchison’s proposal (Aitchison 1982, 1984, 1986)
and principal component analysis, proposed a new
diagram to discriminate the tectonic settings of IAB,
WPB and MORB.
The results of statistical evaluation are presented
graphically in Figure 11 and numerically in Table 11.
All IAB, continental rift and ocean-island settings
showed very high success rates from 80.5% to 98.7%.
About 69.8% of the back arc magmas plotted in the
IAB field, whereas only about 55.5% of the E-MORB
occupied the MORB field. Although Butler &
Woronow (1986) based their proposal on average
values from a total of 35 locations, I have used, for
simplicity, individual analyses to evaluate this
diagram. Given the very high success rates for
individual magmas, the results will not significantly
change even if average values were used.
One drawback of this diagram is that continental
rift and ocean-island magmas cannot be
discriminated from one another. Another problem is
that many samples plot outside the eye-drawn
boundaries (Figure 11), for which an approximate
continuation of these boundaries was assumed for
discrimination.
Figure 11. Statistical evaluation of the Score1–Score2 diagram
(Butler & Woronow 1986) for arc (IAB), within-plate
(WPB), and mid-ocean ridge (MORB), using basic
and ultrabasic rocks from different tectonic settings.
For symbols see Figure 1. Statistical results are
summarised in Table 11.
I suggest that this diagram can be successfully
used for discriminating these tectonic settings.
Nevertheless, it is unfortunate that during the past 30
years this diagram has not found much application
outside the work of Verma and collaborators. From
the above considerations and in view of the newer
diagrams that, in addition, successfully discriminate
the continental rift and ocean-island settings, the
present Score1–Score2 diagram can be replaced in
favour of these new ones capable of discriminating
four tectonic settings, instead of three (Figure 11).
Table 11. Statistical evaluation information of Score1-Score2 discriminant function diagram (Butler & Woronow 1986) for arc (IAB),
within-plate (WPB), and mid-ocean ridge (MORB).
Number of discriminated samples (%)
Tectonic setting
Total samples
IAB
WPB
MORB
Island arc
516 (100)
467 (90.5)
41 (7.9)
8 (1.6)
Island back arc
258 (100)
180 (69.8)
67 (26.0)
11 (4.2)
Continental rift
1065 (100)
25 (2.3)
1021 (95.9)
19 (1.8)
Ocean-island
1198 (100)
2 (0.2)
1183 (98.7)
13 (1.1)
MORB
678 (100)
1 (0.2)
131 (19.3)
546 (80.5)
E-MORB
72 (100)
1 (1.4)
31 (43.1)
40 (55.5)
202
S.P. VERMA
(12) F1-F2 of Pearce (1976)
Surprisingly similar to the Score1-Score2 diagram,
the F1-F2 diagram has also been much less used even
though this latter was proposed by the same
pioneering author (J.A. Pearce) of several widely
used bivariate and ternary diagrams.
Pearce (1976) advocated in favour of
discriminant analysis of major elements as a superior
technique for basalt discrimination from different
tectonic settings. That compositions had to be
treated differently in such statistical analysis (see
Aitchison 1982, 1986) was not recognised at that
time (1977). Further, the boundaries were fitted by
eye. Nevertheless, Pearce (1976) set stringent control
on data quality, such as requiring that the sum of all
initially measured major oxides including volatiles
must be between 99 and 101, that only fresh samples
with FeO/Fe2O3 > 0.5 were to be used, and that
CaO+MgO must be between 12 and 20%. With these
conditions, the proposed functions F1 and F2 were as
follows:
F1 = + (0.0088 × SiO 2 ) − (0.0774 × TiO 2 ) +
(0.0102 × Al 2O3 ) + (0.0066 × FeO t ) −
(0.0017 × MgO) − (0.0143 × CaO) −
(0.0155 × Na 2O) − (0.0007 × K 2O)
(3)
F2 = −(0.0130 × SiO 2) − (0.0185 × TiO 2) −
(0.0129 × Al 2O3 ) − (0.0134 × FeO t) −
(0.0300 × MgO) − (0.0204 × CaO) −
(0.0481× Na 2O) + (0.0715 × K 2O)
(4)
where FeOt is total Fe expressed as FeO.
The F1-F2 diagram was designed to discriminate
the combination of low-potassium tholeiite (LKT)
and calc-alkali basalt (CAB), assumed collectively as
island arc basalts (IAB=LKT+CAB) in this
evaluation, shoshonite (SHO, not assumed to belong
to any specific tectonic setting), ocean floor basalt
assumed to be MORB (OFB=MORB), and CRB and
OIB assumed collectively to be within-plate basalt
(WPB).
Figure 12. Statistical evaluation of the F1-F2 discriminant
function diagram (Pearce 1976) for low-potassium
tholeiite and calc-alkali basalt (LKT+CAB; assumed
as arc –IAB– setting), within-plate (WPB),
shoshonite (SHO; not assumed to belong to any of
the four settings evaluated in the present work),
ocean floor basalt (OFB; assumed as mid-ocean
ridge basalt –MORB– setting), using selected basic
rocks from different tectonic settings. See the text for
restrictions imposed by the original author on the
use of this diagram. For symbols see Figure 1.
Statistical results are summarised in Table 12.
Figure 12 and Table 12 present the results of my
evaluation. Fairly high success rates were obtained
for arc and back arc (93.7% and 70.2%, respectively,
in Table 12). MORB samples are also well
discriminated as OFB (80.5%), whereas continental
rift and ocean-island do so with 65.8% and 78.7%
success rates as WPB. Significant percentages of the
samples (2.1% to 18.7%), however, plot outside any
given field (Table 12).
The major drawbacks of this diagram are the eyedrawn boundaries and the inability to discriminate
between continental rift and ocean-island settings. It
is not clear to which tectonic setting the shosonite
(SHO) should belong. Although such rocks are more
common in within-plate settings, they are also
encountered in an arc environment. The strict
controls (see above) will be other factors that would,
in practice, make the routine application of this
diagram difficult. In any case, this diagram has not
been much used during the last 30 years.
203
STATISTICAL EVALUATION OF DISCRIMINATION DIAGRAMS
Table 12. Statistical evaluation information of F1-F2 discriminant function diagram (Pearce 1976) for low-potassium tholeiite and
calc-alkali basalt (LKT+CAB; assumed as arc –IAB– setting), shoshonite (SHO; not assumed to belong to any tectonic
setting), within-plate (WPB), ocean floor basalt (OFB; assumed as mid-ocean ridge basalt –MORB– setting.
Number of discriminated samples (%)
Tectonic
setting
Island arc
Island back arc
Continental rift
Ocean-island
MORB
E-MORB
Total
samples
Overlap region
(LKT+CAB;
assumed IAB)
WPB
SHO
(OFB;
assumed
MORB)
Other
(outside any
field)
381 (100)
171 (100)
661 (100)
550 (100)
558 (100)
30 (100)
357 (93.7)
120 (70.2)
128 (19.4)
1 (0.2)
52 (9.3)
10 (30)
1 (0.3)
1 (0.6)
435 (65.8)
433 (78.7)
36 (6.5)
18 (55)
7 (1.8)
16 (9.3)
22 (3.3)
0 (0.0)
9 (1.6)
0 (0)
8 (2.1)
2 (1.2)
45 (6.8)
33 (6.0)
449 (80.5)
4 (12)
8 (2.1)
32 (18.7)
31 (4.7)
83 (15.1)
12 (2.1)
1 (3)
(13) F2-F3 of Pearce (1976)
As a complement to the F1-F2 diagram, Pearce (1976)
proposed a companion diagram (F2-F3) to better
separate the volcanic arc subdivisions, namely, LKT
and CAB. The function F2 is the same as above
(equation 4) whereas F3 is as follows:
F3 = − (0.0221× SiO 2 ) − (0.0532 × TiO 2 ) −
(0.0361× Al 2O3 ) − (0.0016 × FeO t ) −
(5)
(0.0310× MgO) − (0.0237 × CaO) −
(0.0614× Na 2O) − (0.0289 × K 2O)
Note the correct value of the coefficient for SiO2
(−0.0221, instead of −0.221 wrongly printed in the
journal) as modified by Pearce (1976) in a reprint
that I obtained from J.A. Pearce during the late
seventies.
The discriminating power of this diagram (Figure
13; Table 13) is somewhat less than the earlier (F1-F2)
diagram. Here, the success rates for arc, back arc and
MORB were respectively, about 80.9%, 82.3% and
78.0%, for assumed settings of island arc and MORB
(Table 13). The diagram will not work for withinplate magmas, because this setting is actually missing
from this diagram. It should be used to distinguish
between LKT and CAB for arc magmas, because
LKT and CAB are effectively separated from one
another (Figure 13). However, in view of the
nomenclature of basaltic rocks (Le Bas et al. 1986),
this so-called advantage does not really matter,
because these terms are not recommended by the
IUGS any more (Le Bas 2000; Le Maitre et al. 2002).
204
Figure 13. Statistical evaluation of the F2-F3 discriminant
function diagram (Pearce 1976) for low-potassium
tholeiite (LKT), calc-alkali basalt (CAB), shoshonite
(SHO), ocean floor basalt (OFB; assumed as midocean ridge basalt MORB), using selected basic
rocks from different tectonic settings. LKT+CAB
were assumed as arc –IAB– setting. Same restrictions
apply for this diagram as for Figure 12. For symbols
see Figure 1. Statistical results are summarised in
Table 13.
Both sets of F diagrams of Pearce (1976) are not
capable of discriminating continental rift and oceanisland settings. Their discriminating power for IAB
and MORB is also superseded by the newer diagrams
(2004−2010). The statistical handling also is not up
to the present expectations (Aitchison 1986; Agrawal
et al. 2008). Therefore, I recommend replacing these
F1-F2-F3 diagrams in future with the newer
alternatives (see below).
S.P. VERMA
Table 13. Statistical evaluation information of F2-F3 plot (Pearce 1976) for low-potassium tholeiite (LKT), calc-alkali basalt (CAB),
shoshonites (SHO), ocean floor basalt (OFB; assumed as mid-ocean ridge basalt MORB).
Number of discriminated samples (%)
Tectonic
setting
Total
samples
Assumed IAB setting
SHO
LKT
CAB
(OFB;
assumed
MORB setting)
Other
(outside any
field)
Island arc
381 (100)
131 (34.4)
177 (46.5)
5 (1.3)
46 (12.1)
22 (5.8)
Island back arc
171 (100)
6 (16.8)
112 (65.5)
8 (4.7)
29 (17.0)
16 (9.3)
Continental rift
661 (100)
116 (17.6)
347 (52.5)
36 (5.4)
105 (15.9)
57 (8.6)
Ocean-island
550 (100)
152 (27.6)
227 (41.3)
14 (2.5)
90 (16.4)
67 (12.2)
MORB
558 (100)
73 (13.1)
27 (4.8)
0 (0.0)
435 (78.0)
23 (4.1)
E-MORB
30 (100)
9 (27)
13 (40)
1 (3)
9 (27)
1 (3)
(14) Set of Five Diagrams Based on Majorelements (Agrawal et al. 2004)
These relatively new discriminant function
discrimination diagrams have been cited by several
workers. Recent references include: Srivastava &
Sinha (2007); Wiszniewska et al. (2007); Jafarzadeh
& Hosseini-Barzi (2008); Sheth (2008); DíazGonzález et al. (2008); and Pandarinath (2009).
This was, in fact, the first set of diagrams that
actually allowed discriminating of two very similar
tectonic settings of continental rift and ocean-island.
For the modern plate tectonics theory, I consider that
the discrimination of these two tectonic settings for
older terrains is important because continental
rifting should have occurred, as its name suggests,
from extensional features on a continental crust
whereas the ocean-island setting would correspond
to an oceanic crust. The search for old oceanic crust,
being of interest to the scientific community (Pearce
2008), should be facilitated by such a distinction of
continental rift and ocean-island settings if one is
capable of discriminating them with high success
rates.
The first of the five diagrams in this set consists of
a four-field DF1-DF2 plot to discriminate the four
tectonic settings: IAB, CRB, OIB, and MORB. The
two functions that account for about 97.2% of the
between-groups variances are as follows (Agrawal et
al. 2004):
(DF1)(IAB-CRB-OIB-MORB) = 0.258 × (SiO 2 ) adj +
2.395 × (TiO 2 ) adj + 0.106 × (Al 2O 3 ) adj +
1.019 × (Fe 2O 3 ) adj − 6.778 × (MnO) adj +
0 .405 × (MgO) adj + 0.119 × ( CaO) adj +
(6)
0.071× (Na 2O) adj − 0.198 × (K 2O) adj +
0.613× (P2O 5 ) adj − 24.065
DF2 (IAB -CRB -OIB-MORB) = 0.730 × (SiO2 ) adj +
1.119 × (TiO 2 ) adj + 0.156 × (Al 2O3 ) adj +
1.332 × (Fe 2O3 ) adj + 4.376 × (MnO)adj +
(7)
0.493 × (MgO) adj + 0.936 × (CaO) adj +
0.882 × (Na 2O) adj − 0.291 × (K 2O) adj −
1.572 × (P2O5 ) adj − 59.472
where the subscript adj refers to the adjusted data
from SINCLAS (Verma et al. 2002).
The discriminant function for the other four
diagrams corresponding to three groups at a time,
are calculated similarly (equations 8−15).
For IAB-CRB-OIB discrimination, the equations
are (note P2O5 is absent from equations 8 and 9):
205
STATISTICAL EVALUATION OF DISCRIMINATION DIAGRAMS
(DF1) (IAB -CRB -OIB) = 0.251 × (SiO2 ) adj +
(DF1) (IAB -OIB -MORB) =1.232 × (SiO2 ) adj +
2.034 × (TiO 2) adj − 0.100 × (Al 2O3 ) adj +
0.573 × (Fe 2O3) adj + 0.032 × (FeO) adj −
2.877 × (MnO)adj + 0.260 × (MgO) adj +
4.166 × (TiO 2 ) adj +1.085 × (Al 2O3 ) adj +
(8)
(12)
3.930 × (MnO)adj +1.334 × (MgO) adj +
0.052 × (CaO) adj + 0.322 × (Na 2O) adj −
1.085 × (CaO) adj + 0.416 × (Na 2O) adj +
0.229 × (K 2O) adj −18.974
0.827 × (K 2O) adj −119.050
(DF2) (IAB -OIB -MORB) =1.384 × (SiO 2 ) adj +
(DF2)(IAB -CRB -OIB) = 2.150 (SiO 2 ) adj +
1.091 × (TiO 2 ) adj + 0.908 × (Al 2O3 ) adj +
2.711 (TiO2 ) adj +1.792 (Al 2O3 ) adj +
2.419 × (Fe 2O3 ) adj + 0.886 × (FeO) adj +
2.295 (Fe 2O3 ) adj +1.484 (FeO) adj +
8.594 (MnO)adj +1.896 (MgO) adj +
3.522 × (Fe 2O3 ) adj + 0.500 × (FeO) adj −
(9)
5.281 × (MnO)adj + 1.269 × (MgO) adj +
(13)
1.790 × (CaO) adj + 2.572 × (Na 2O) adj +
2.158 (CaO) adj +1.201 (Na 2O) adj +
0.138 × (K 2O) adj − 134.295
1.763 (K 2O) adj 200.276
For IAB-CRB-MORB discrimination (equations
10-11):
For CRB-OIB-MORB discrimination (equations
14−15):
(DF1) (CRB -OIB -MORB) = 0.310 × (SiO2 ) adj +
1.936 × (TiO2 ) adj + 0.341 × (Al 2O3 ) adj +
(DF1) (IAB -CRB -MORB) = 0.435 × (SiO 2 ) adj −
1.392 × (TiO 2 ) adj + 0.183 × (Al 2O3 ) adj +
0.148 × (FeO) adj + 7.690 × (MnO)adj +
0.021 × (MgO) adj + 0.380 × (CaO) adj +
0.760 × (Fe 2O3 ) adj + 0.351 × (FeO) adj −
11.315 × (MnO)adj + 0.526 × (MgO) adj +
(10)
(14)
0.084 × (CaO)adj + 0.312 × (K 2O) adj +
1.892 × (P2O5 ) adj − 32.909
0.036 × (Na 2O) adj + 0.462 × (K 2O) adj −
1.192 × (P2O5 ) adj − 29.435
(DF2) (CRB
-OIB -MORB)
= 0.703 × (SiO 2 ) adj +
2.454 × (TiO 2 ) adj + 0.233 × (Al 2O3 ) adj +
(DF2) (IAB -CRB -MORB) = 0.601 × (SiO2 ) adj −
1.943 × (Fe 2O3 ) adj − 0. 182 × (FeO) adj −
0.335 × ( TiO 2 )adj + 1.332 × ( Al 2O 3 ) adj +
2.421 × (MnO)adj + 0.618 × (MgO) adj +
1.449 × ( FeO)adj + 0.756 × ( MnO) adj +
0.712 × (CaO) adj − 0.866 × (K 2O) adj −
0.893 × ( MgO) adj + 0.448 × (CaO)adj +
(11)
(15)
1.180 × (P2O5 ) adj − 56.455
0.525 × ( Na 2O)adj + 1.734 × ( K 2 O) adj +
2.494 × ( P2O 5 )adj − 78.236
For IAB-OIB-MORB discrimination (equations
12−13; note P2O5 is absent from these equations):
206
These discriminant functions were calculated for
each data set and the corresponding discrimination
diagrams were constructed (Figure 14a−e), from
which the statistical synthesis was prepared (Table
14). For the corresponding discriminant function
S.P. VERMA
Figure 14. Statistical evaluation of the set of five major-element based discriminant function DF1–DF2
discrimination diagrams (Agrawal et al. 2004) for island arc basalt (IAB), continental rift basalt
(CRB), ocean-island basalt (OIB) and mid-ocean ridge basalt (MORB), using basic and
ultrabasic rocks from different tectonic settings. For probability-based discrimination
boundaries see the original paper by Agrawal et al. (2004). For symbols see Figure 1. Statistical
results are summarised in Table 14. (a) four-groups IAB-CRB-OIB-MORB diagram; (b) threegroups IAB-CRB-OIB diagram; (c) three-groups IAB-CRB-MORB diagram; (d) three-groups
IAB-OIB-MORB diagram; and (e) three-groups CRB-OIB-MORB diagram.
207
STATISTICAL EVALUATION OF DISCRIMINATION DIAGRAMS
Table 14. Statistical evaluation information of the set of five major-element based discriminant function DF1-DF2 discrimination
diagrams (Agrawal et al. 2004) for island arc basalt (IAB), continental rift basalt (CRB), ocean-island basalt (OIB) and midocean ridge basalt (MORB).
Number of discriminated samples (%)
Tectonic setting
Total samples
IAB
CRB
OIB
MORB
IAB-CRB-OIB-MORB
Island arc
Island back arc
Continental rift
Ocean-island
MORB
E-MORB
639 (100)
285 (100)
1271 (100)
1479 (100)
963 (100)
91 (100)
516 (80.7)
212 (74.4)
76 (6.0)
15 (1.0)
26 (2.7)
6 (6.6)
16 (2.5)
23 (8.1)
864 (68.0)
386 (26.1)
21 (2.2)
9 (9.9)
1 (0.2)
0 (0.0)
232 (18.2)
1069 (72.3)
27 (2.8)
14 (15.4)
106 (16.6)
50 (17.5)
99 (7.8)
9 (0.6)
889 (92.3)
62 (68.1)
IAB-CRB-OIB
Island arc
Island back arc
Continental rift
Ocean-island
639 (100)
285 (100)
1271 (100)
1479 (100)
612 (95.8)
250 (87.7)
79 (6.2)
6 (0.4)
25 (3.9)
35 (12.3)
1006 (79.2)
520 (35.2)
2 (0.3)
0 (0.0)
186 (14.6)
943 (64.4)
−
−
−
−
IAB-CRB-MORB
Island arc
Island back arc
Continental rift
MORB
E-MORB
639 (100)
285 (100)
1271 (100)
963 (100)
91 (100)
521 (81.5)
208 (73.0)
55 (4.3)
30 (3.1)
5 (5.5)
19 (3.0)
21 (7.4)
1099 (86.5)
30 (3.1)
25 (27.5)
−
−
−
−
−
99 (15.5)
56 (19.6)
117 (9.2)
903 (93.8)
61 (67.0)
IAB-OIB-MORB
Island arc
Island back arc
Ocean-island
MORB
E-MORB
639 (100)
285 (100)
1479 (100)
963 (100)
91 (100)
536 (83.9)
227 (79.7)
6 (0.4)
19 (2.0)
5 (5.5)
−
−
−
−
−
3 (0.5)
2 (0.7)
1372 (92.8)
39 (4.0)
20 (22.0)
100 (15.6)
56 (19.6)
101 (6.8)
905 (94.0)
66 (72.5)
CRB-OIB-MORB
Continental rift
Ocean-island
MORB
E-MORB
1271 (100)
1479 (100)
963 (100)
91 (100)
−
−
−
−
960 (75.5)
428 (28.9)
25 (2.6)
8 (8.8)
204 (16.1)
1036 (70.5)
23 (2.4)
12 (13.2)
106 (8.3)
9 (0.6)
915 (95.0)
71 (78.0)
boundaries in Figure 14a−e as objectively inferred
from LDA of the data, the reader is referred to
Agrawal et al. (2004).
In the first four-field diagram (Figure 14a), both
arc and back arc magmas were discriminated with
success rates of about 80.7% and 74.4%, respectively
(Table 14). MORB samples were also successfully
discriminated with still greater success rate of about
92.3%, whereas the enriched MORB variety showed
68.1%. Samples from continental rift and oceanisland settings could be discriminated, for the first
time, although with relatively small success rates of
208
about 68.0 and 72.3% in this particular diagram
(Figure 14a; Table 14). This discrimination was in
fact improved in the other diagrams (Figure 14b−e;
Table 14) of this set (see the next paragraph).
Nevertheless, these percentages (68.1% to 92.3%;
Figure 14a; Table 14) are similar to 70.3% to 93.0%
values for IAB, CRB, OIB, and MORB settings
obtained by Agrawal et al. (2004) using their training
and testing sets.
The other four diagrams for three tectonic
settings at a time (IAB-CRB-OIB, IAB-CRB-MORB,
IAB-OIB-MORB, and CRB-OIB-MORB; Figure
S.P. VERMA
14b−e) performed better, as expected, than the above
four-field diagram (Figure 14a). The success rates for
the main tectonic varieties of magmas as
discriminated in these four diagrams (Figure 14b−e)
were 64.4−95.8%, 81.5−93.8%, 83.9−94.0%, and
70.5−95.0%, respectively. In comparison, Agrawal et
al. (2004) reported success rates of 79.4−92.0%,
80.8−96.0%, 84.8−96.0%, and 71.8−96.0%,
respectively, for these four diagrams.
Back arc and E-MORB magmas (Figure 14b−e)
were also successfully discriminated as, respectively,
arc and MORB, with high success rates of
73.0−87.7% and 67.0−78.0% (Table 14), this being a
great advantage of these diagrams as compared to all
earlier bivariate, ternary, and discriminant function
diagrams. From the tectonics point of view and
irrespective of petrological arguments of magma
sources, it should be beyond doubt that if a
tectonomagmatic diagram is capable of
discriminating arc and MORB settings, back arc
magmas should be discriminated as arc and EMORB from mid-ocean ridges as MORB. This
would then justify their names as back arc and EMORB, respectively. Otherwise, does it make any
sense to use a discrimination diagram? Petrological
modelling, if correctly done, would suffice. I suggest
that correct discrimination with high success rates
(back arc as arc and E-MORB from mid-ocean ridges
as MORB) would render this methodology to be
truly complementary to petrological modelling.
Thus, in terms of the success rates for
discriminating all four major tectonic settings, this
set of five new diagrams performed better than all
other discrimination diagrams available prior to
2004. The proposal of these discriminant function
major element diagrams was a major step forward,
because it used an extensive database in the LDA and
the discrimination boundaries were objectively
drawn from probabilities. The drawback of statistical
methodology still persisted because the
compositional data were not correctly handled
(Aitchison 1982, 1986). Therefore, these diagrams
can also be replaced by the newer (2006−2010) major
element (or trace element) based diagrams that in
addition, incorporate log-ratio transformation of
compositional variables.
(15) Set of Five Discriminant Function Diagrams
Based on Log-transformed Ratios of Majorelements (Verma et al. 2006)
Besides many of the papers cited for the discriminant
function diagrams of Agrawal et al. (2004), the
following references also cite the paper by Verma et
al. (2006): Rajesh (2007); Shekhawat et al. (2007);
Vermeesch (2007); and Torres-Alvarado et al. (2010).
Sheth (2008) positively evaluated these (Verma et al.
2006) and earlier (Agrawal et al. 2004) diagrams
using mafic volcanics and ophiolites and inferred
that most rocks were discriminated with relatively
high success rates.
A major advance in the application of
discrimination diagrams was probably achieved by
Verma et al. (2006), who solved the final problem
related to the older discrimination diagrams. Other
problems common to all simple bivariate and ternary
diagrams as well as old discriminant function
diagrams were already overcome by Agrawal et al.
(2004). The final step forward was the statistically
correct handling of compositional data (Chayes
1960, 1965, 1978; Aitchison 1981, 1982, 1984, 1986,
1989; Aitchison et al. 2000, 2003; Egozcue et al. 2003;
Aitchison & Egozcue 2005). These authors (Verma et
al. 2006) calculated the natural logarithm of element
ratios using a common divisor, in this case (SiO2)adj
before carrying out LDA. Thus, ratios of all other
major elements in the natural logarithm space, viz.,
ln(TiO2/SiO2)adj, ln(Al2O3/SiO2)adj, ln(Fe2O3/SiO2)adj,
ln(FeO/SiO2)adj, ln(MnO/SiO2)adj, ln(MgO/SiO2)adj,
ln(CaO/SiO2)adj, ln(Na2O/SiO2)adj, ln(K2O/SiO2)adj,
and ln(P2O5/SiO2)adj were used in LDA. Note ratios
eliminate the chemical measurement units (converts
compositional data theoretically restricted to 0−1 or
0−100% space, to non-compositional space), and the
natural logarithms of the ratio variables open up the
restriction of the space to practically from –∞ to +∞.
The common divisor ascertains that we are dealing
with the compositions as a multivariate problem
(instead of a series of univariate data; see Verma et al.
(2006) and Agrawal & Verma (2007) for more
discussion on this innovation in compositional data
handling, and Vermeesch (2006, 2007) for probably
erroneous treatment of them).
The discriminant functions for the four groups
diagram (representing about 94.2% of the between
groups variance) were as follows:
209