Effects of ENSO on cold - air activities and tropical cyclones in Vietnam
Bạn đang xem bản rút gọn của tài liệu. Xem và tải ngay bản đầy đủ của tài liệu tại đây (629.68 KB, 4 trang )
Environmental Sciences | climatology
Effects of ENSO on cold - air activities
and tropical cyclones in Vietnam
Duc Ngu Nguyen*
Centre for Hydro - Meteorological, Environmental
Sciences and Technologies
Received 19 May 2017; accepted 6 June 2017
Abstract:
Introduction
This paper presents a summary of the results of a study
into the effects of ENSO (El Niño and La Niña) on the
frequency of cold fronts and tropical cyclones affecting
Vietnam. The results show that, during the ENSO periods,
cold air activities affecting Vietnam were reduced. The
ratio of total positive anomalies to negative anomalies of
front frequency was 68% in the case of El Niño, and 60%
in the case of La Niña. The frequency of tropical cyclones
affecting Vietnam decreased by 28% in the case of El
Niño, and increased to 38% in comparison with the multiyear average in the case of La Niña. During the El Niño
period, hurricanes affecting Vietnam were often evenly
distributed or concentrated in the first half of the typhoon
season, but during the La Niña period, hurricanes were
concentrated in the second half of the hurricane season.
ENSO - El Niño-Southern Oscillation - is an oceanic atmospheric phenomenon that occurs in the Pacific Ocean, and
brings on strong transformations in the weather and climate
of many places around the world, and impacts economic and
environmental activities [1]. Over the last half of a century
(1951-2016), 20 warm ENSO (El Niño) - and 13 La Niña related occurrences have been identified according to the
Oceanic Niño Index - ONI) [2]. Many scientists have been
researching this phenomenon, and many programs have been
implemented, including surveys gathering empirical research
about oceans and the atmosphere, especially the TOGA program
(1985-1994) [3-5]. ENSO often causes severe fluctuations of
weather in Vietnam, in which the activity of tropical cyclones
and cold air is notable.
Keywords: cold air, effects of ENSO, tropical cyclones.
Classification number: 6.2
This paper studies the impact of ENSO on the intrusion of
cold air and the effects of typhoons and tropical depressions
on Vietnam.
Methodology and Data
Methodology
The main research method used in this study was a standard
deviation analysis that contained the following statistical
characteristics:
1) Mean: X
1 n
Xti
n t 1
2) Anomaly: X Xt X
Where : Xt 0, Positive anomaly
Xt 0, Anomaly 0
Xt 0, Negative anomaly
3) The method of determining the periods of warm ENSO
phase (El Niño) and the periods of cold ENSO phase (La
*
Email:
88
Vietnam Journal of Science,
Technology and Engineering
June 2017 • Vol.59 Number 2
Environmental Sciences | climatology
Niña): The study compared the correlation coefficient between
the average annual sea surface temperature in NIÑO areas
with the mean annual air temperature at 14 climate stations
representing the climatic zones in Vietnam, in this study, one
El Niño episode was defined as a continuous period of no
less than six months with a five-month moving average of the
standard deviation of monthly sea surface temperature average
(SSTA) of NIÑO-3 (150oW-90oW, 5oN-5oS) greater than or
equal to 0.5oC. A La Niña episode is a continuous period of
no less than six months with a five-month moving average of
SSTA in the NIÑO-3 area less than or equal to - 0.50C.
the 98/2000 La Niña, the pressure anomaly of the stations is
positive and fluctuate in the La. Cycle, corresponding to the
volatility of the SOI.
Data
- Monthly average sea surface temperature data and
anomaly in the NIÑO period of 1950-2000.
- Southern Oscillation Index (SOI) in the period of 18762001 [6].
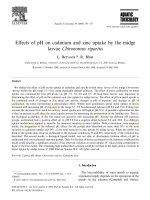
Fig. 1. Variation of the standard deviation of sea level
pressure of moving average of five months in El Niño.
- Data on climatic elements including sea level pressure
at four stations in Hanoi, Da Nang, Vung Tau, and Con Dao;
cold fronts and typhoons affected Vietnam during the periods
of 1950-2000 [7-9].
Results and discussions
The El Niño and La Niña episodes during the period of
1956-2000
As was stated above, during 1956-2000, there was an
occurrence of 12 El Niño episodes: 1957/1958, 63/64, 65/66,
68/70, 72/73, 76/78, 79, 82/83, 86/88, 91/92, 93, and 97/98,
and eight La Niña episodes: 64/65, 67/68, 70/71, 73/74, 75/76,
84/85, 88/89, and 98/00. The 1997/1998 El Niño season had
the highest SSTA value of 3.9°C, which occurred in December
1997 and was considered the strongest El Niño season out of
the above mentioned El Niño episodes. The 1998/2000 La
Niña had the largest negative SSTA value of -1.6oC, recorded
in January 2000, which was considered the strongest La Niña
occurrence in the above mentioned La Niña season [10]. These
two ENSO batches are used in the case study.
The impact of ENSO on the operation of cold air in
Vietnam
Fluctuations of atmospheric pressure:
Checking fluctuations of atmospheric pressure in Hanoi,
Da Nang, Vung Tau, and Con Dao for the 1997/1998 El Niño
and 1998/2000 La Niña showed that suitable for SOI, the
strongest fluctuations, decrease in the north (Fig. 1 and 2). In
the El. period of 97/98, the pressure anomaly of the stations
was positive (as opposed to the SOI index) and increased
according to El’s development cycle. Until the peak stage and
then gradually decrease in the period of recession El. During
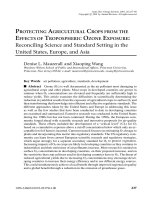
Fig. 2. Variation of the standard deviation of sea level
pressure of moving average of five months in La Niña
1998/2000.
Fluctuations of cold fronts affect Vietnam:
Cold front activity affecting Vietnam is reflected through
the frequency of cold fronts and the cold front seasons in
Hanoi. The impact of ENSO including the El Niño and La
Niña’s influences were analyzed on a basis of the data on the
anomaly of cold front frequency and unusual behavior of cold
seasons.
1) Standard of frequency and standard of cold fronts season
The period of 1956-2000 had 1.303 cold fronts, which
averages at 29.1 phase for a year, and 2.42 cold fronts per month
(Table 1). That is a typical value for the frequency of cold
fronts in a month, assuming the number of fronts distributed
throughout the year for 12 months. So the cold season in
JUNE 2017 • Vol.59 Number 2
Vietnam Journal of Science,
Technology and Engineering
89
Environmental Sciences | climatology
Vietnam can be considered to be from October to May the next
year. June and September are considered as transition months,
and July and August are the interruptions of cold fronts.
Table 3. The anomaly of cold front frequency in La Niña
months.
Table 1. Frequency of cold front over Hanoi from 1956
to 2000.
Months
1
2
3
4
5
6
7
8
9
10
11
12
Year
Total
181
144
148
120
121
68
6
7
61
131
160
156
1303
Average
4.0
3.2
3.3
2.7
2.7
1.5
0.13
0.16
1.4
2.9
3.6
3.5
29.1
Table 2. Anomaly of cold front frequency in El Niño
months.
Sign of anomaly
1
2
3
4
5
6
Positive
7
4
Negative
4
7
No Anomaly
2
Total
13
7
8
9
10
11
12
Total
1
2
5
7
2
1
7
9
9
6
60
7
10
8
6
11
12
8
4
4
7
88
0
0
0
0
0
0
0
0
0
0
0
2
11
8
12
13
13
13
13
14
13
13
13
150
3) La Niña’s influence on cold fronts
In the 107 months of La Niña, during the period of 1956 to
2000, there were 243 cold fronts in Hanoi. On average, La Niña
had 2.27 cold front phases, less than the normal average during
those months (Table 3). As in the El Niño months, the number
of La Niña months had a negative effect on cold fronts, more
than the positive anomaly. Almost all months that had negative
anomalies are superior, especially during the half months
after winter. Only in May, October, and December, opposite
situation was observed, in which the positive anomalies were
greater than the negative anomalies. In addition, the La Niña
season of 1998-2000, which lasted for only four months (in
18 months of existence), was the period of interruption and
transition of the cold front season but still very little cold front.
90
Vietnam Journal of Science,
Technology and Engineering
1
2
3
4
5
6
7
8
9
10
11
12
Total
Positive
0
2
2
3
5
3
0
4
4
7
4
8
42
Negative
4
6
6
5
2
6
8
4
5
4
7
3
60
None
5
0
0
0
0
0
0
0
0
0
0
0
5
Total
9
8
8
8
7
9
8
8
9
11
11
11
107
An overview of the ENSO cold-front relationship:
2) The effect of El Niño on the frequency of cold fronts
In the 150 months of El Niño, during the period of 19562000, there were 356 cold fronts throughout Hanoi. On average,
each month there had 2.37 cold fronts, less than the average
monthly amount. Although the number of El Niño occurrences
had fewer cold fronts, at approximately equal to the number
of El Niño cold fronts, the number of El Niño months was
negative anomalies than that number of El Niño months that
had positive anomalies. The negative anomaly occurs much in
the last months of the cold season (II, III, IV, V) and two months
of cold interruption (VII, VIII). On the contrary, the positive
anomaly is greater than the negative anomaly in the first few
months of winter and winter. This leads to the conclusion that,
under El Niño conditions, the cold front season has a higher
frequency in the first half of winter and is more likely to end
sooner than normal (Table 2).
Sign of anomaly
- In the El Niño and La Niña periods, the frequency of cold
fronts usually decreased, especially in the last months (for El
Niño) and the second half of the seasons (for La Niña).
- During the El Niño and La Niña periods, the cold front
seasons usually began no sooner or later than usual, but
sometimes ended sooner than usual.
- In the El Niño and La Niña periods, cold front interruptions
were usually longer than in normal years. During the El Niño
years, the number of colder waves deepened further south
during the La Niña years. In the years of El Niño and La Niña,
the number of cold fronts affecting our country is less than
normal. The ratio of total the positive and negative anomaly
of the front frequency in Hanoi for the months of the year was
only 68% in the case of El Niño and 60% in the case of La
Niña. The time interruption of a front is longer, especially in
the last months of the cold front season and therefore, the cold
front season ended earlier than normal.
The impact of ENSO on the occurrences of tropical
cyclones in Vietnam
The standard number of storms and storm seasons in
Vietnam:
During the period of 1956-2000, there were 311 storms
and tropical depressions (here-in-after referred to as “storms”),
and their impact on Vietnam averaged 6.9 attacks per year and
0.58 each month (Table 4). In this study, the mean values of
monthly and yearly storms during the 1956-2000 monitoring
period were considered to be monthly and yearly storms. If
the hurricane season is a period of months with an average of
0.33 times/month or more (at least an average of 3 years with 1
storm), the storm season in Vietnam is from June to December.
Table 4. The average of number storm for per month and
year.
June 2017 • Vol.59 Number 2
Months
1
2
3
4
5
6
7
8
9
10
11
12
Year
Number of
storm
0.0
0.02
0.07
0.07
0.11
0.67
0.73
1.16
1.42
1.33
1.00
0.33
6.91
Environmental Sciences | climatology
Impact of ENSO on the occurrences of storms:
- Hurricanes affect Vietnam under El Niño conditions
During the period of 1956-2000, there were 12 El Niño
periods with a total of 150 El Niño months and 63 storms. On
average, there were 0.42 typhoons in Vietnam for each El Niño
month, less than the average number of 0.16 attacks (about
28%). Most of the storms affecting Vietnam during the El
Niño months of the hurricane season are less than the monthly
standard (negative anomaly). Hence, the negative anomaly of
the year is also significantly greater than the positive anomaly
(Table 5). Thus, the number of hurricanes affecting Vietnam
under El Niño conditions is less than normal.
Table 5. Sign of anomaly storm in El Niño months of the
hurricane season.
Month
6
7
8
9
10
11
12
Year
Positive anomaly
3
7
4
5
1
2
3
25
Negative anomaly
9
5
8
9
12
11
10
64
Total
12
12
12
14
13
13
13
89
During the period of 1956-2000, there were nine
occurrences during the La Niña phase with a total of 107 La
Niña occurrences and 86 storms. On average, each La Niña
month during this period had 0.8 storms affecting Vietnam,
more than the standard average of 38% and twice the number
of storms affecting Vietnam under El Niño conditions. The
difference between the positive anomaly and the negative
anomaly is not much but the absolute value of the positive
anomaly is significantly greater than the absolute value of the
negative anomaly, so the number of storms in the months and
in both The hurricane season under La Niña condition is still
higher than the average (Table 6).
Table 6. Sign of storm anomaly in La Niña month of the
hurricane season.
6
7
8
9
10
11
12
Year
Positive anomaly
4
3
3
4
8
6
3
31
Negative anomaly
3
5
5
5
3
5
8
34
Total
7
8
8
9
11
11
11
65
2. The frequency of cold fronts that affects Vietnam in
periods of warm ENSO and cold ENSO are less trivial. The
frequency of cold fronts decreased much in the last months
of the season in the case of El Niño and the second half of the
cold season in the case of La Niña. The cold front season ends
earlier than usual.
3. The frequency of storms affecting Vietnam in El Niño
was 28% less than usual, while in La Niña, the frequency of
storms affected Vietnam more than usual by about 38% and
nearly twice the frequency of storms affected during the El
Niño waves. During the El Niño periods, typhoons affecting
Vietnam are often evenly distributed or concentrated in the first
half of the typhoon season, while during the La Niña periods,
typhoons are concentrated in the second half of the hurricane
season.
REFERENCES
- Hurricanes affect Vietnam under La Niña conditions
Month
the process of the SOI. In the La Niña cycles, the situation
is reversed; the monthly pressure anomalies are negative, as
opposed to the positive and the SOI. As far south, these effects
are clearer.
[1] Duc Ngu Nguyen (2002), Impact of ENSO on weather, climate,
environment and socio-economic in Vietnam, Synthesis report of the
independent scientific research national project, Vol.1, Hanoi.
[2] Climate Prediction Center (1998), “Quantifying, detecting and
monitoring ENSO”, World Climate News, No.13, p.5.
[3] J.L. Evans (1990), “Envisaged impacts of enhanced greenhouse
warming on tropical cyclones in the Australian region”, CSIRO Division of
Atmospheric Research Technical Paper, No.20, pp.1-31.
[4] Kevin E. Trenberth (1996), “El Niño definition”, Exchanges, 1(3),
pp.6-8.
[5] World Climate Research Programme (1995), CLIVAR: A study of
climate variability and predictability: Science Plan, WCRP 89, WMO/TD
No.690.
[6] Bureau of Meteorology, Australia (1999), Southern Oscillation Index
(SOI) Archives, Copyright Common Wealth of Australia.
[7] Department of Hydro-meteorological Forecasting, and National
Center for Hydro-meteorological Forecasting, The frequency of typhoon
and tropical depression landing data and direct impacts on Viet Nam,
Characteristics activity of tropical cyclones and tropical depression annual
in the period of 1956-2000.
[8] Department of Hydro-meteorological Forecasting, and National
Center for Hydro-meteorological Forecasting, The cold air frequency data
(cold fronts) affecting Vietnam, Characteristics of annual cold air in the
period of 1956-2000.
Conclusions
1. The phenomenon of ENSO clearly affects the distribution
of pressure in Vietnam. During the El Niño cycles, the sea
surface pressure at Vietnam stations had increased. The sea
level pressure anomaly is positive, increasing according to the
El Niño development cycles, as opposed to negative values and
[9] Viet Nam Institute of Meteorology, Hydrology and Climate Change,
Standard climate data for the period of 1961-2010.
[10] Japan Meteorological Agency (1996, 1997), Climate change
monitoring report.
JUNE 2017 • Vol.59 Number 2
Vietnam Journal of Science,
Technology and Engineering
91