The influence of agro-industrial effluents on River Nile pollution
Bạn đang xem bản rút gọn của tài liệu. Xem và tải ngay bản đầy đủ của tài liệu tại đây (1.56 MB, 11 trang )
Journal of Advanced Research (2011) 2, 85–95
Cairo University
Journal of Advanced Research
ORIGINAL ARTICLE
The influence of agro-industrial effluents on River Nile
pollution
Sayeda M. Ali a, Shawky Z. Sabae a, Mohammed Fayez b, Mohammed Monib b,
Nabil A. Hegazi b,*
a
b
National Institute of Oceanography and Fisheries, El-Qanater Research Station, Egypt
Faculty of Agriculture, Cairo University, Giza, Egypt
Received 16 February 2010; revised 3 July 2010; accepted 9 July 2010
Available online 20 October 2010
KEYWORDS
River Nile;
Agro-industrial effluents;
Water pollution;
Biodegradation;
Biofertilizers
Abstract The major agro-industrial effluents of sugarcane and starch industries pose a serious
threat to surface waters. Their disposal in the River Nile around Cairo city transitionally affected
the microbial load. In situ bacterial enrichment (50–180%) was reported and gradually diminished
downstream; the lateral not vertical effect of the effluent disposal was evident. Disposed effluents
increased BOD and COD, and then progressively decreased downstream. Ammoniacal N was elevated, indicating active biological ammonification and in situ biodegradability of the effluents. In
vitro, the nitrogen-fixing rhizobacteria Crysomonas luteola, Azospirillum spp., Azomonas spp. and
K. pneumoniae successfully grew in batch cultures prepared from the crude effluents. This was supported by adequate growth parameters and organic matter decomposition. Therefore, such biodegradability of the tested agro-industrial effluents strongly recommends their use for microbial
biomass necessary for the production of bio-preparates.
ª 2010 Cairo University. Production and hosting by Elsevier B.V. All rights reserved.
Introduction
Globally, industrial waste water represents the main source of
water pollution [1–5]. The River Nile, which represents more
* Corresponding author. Tel./fax: +202 35728 483.
E-mail address: (N.A. Hegazi).
2090-1232 ª 2010 Cairo University. Production and hosting by
Elsevier B.V. All rights reserved.
Peer review under responsibility of Cairo University.
doi:10.1016/j.jare.2010.08.008
Production and hosting by Elsevier
than 90% of the Nile basin’s water resources, is the traditional
receptor of waste and drainage waters generated by different
activities [6,7]. Industrial waste waters are considered among
the major sources of environmental pollution, endangering
public health through direct use as well as feeding fish that live
in the polluted streams. It is estimated that more than 400 factories continue to discharge more than 2.5 million m3 per day
of untreated effluent into Egypt’s waters [8,9]. Several pretreatment techniques have been imposed to reduce the impact
of discharge on municipal plants or on the receiving water
bodies by using microorganisms, chemical and/or physicochemical methods. Potential bacterial strains are used for biodegradation of industrial effluents, e.g. Bacillus spp. and
Pseudomonas spp. for winery and olive oil waste waters [10]
and Ps. fluorescens for pulp and paper mills’ effluents [11].
Ali et al. [12,13] demonstrated the successful biodegradation
86
S.M. Ali et al.
of the effluents of the baker’s yeast industry, producing enough
microbial biomass for the large scale production of biofertilizers (bio-preparates).
The sugarcane and starch industries are among the major
producers of polluting agro-industrial effluents affecting the
River Nile [6,14–16]. The present study is monitoring the
microbial load of the Nile in areas directly subjected to these
particular effluents. In addition, the nature of such effluents
and their possible biodegradation with potential nitrogen-fixing rhizobacteria (diazotrophs) are also investigated.
Material and methods
The experimental area
The studied area is selected to be under the influence of effluent
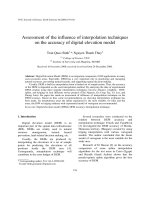
discharge of ‘‘The Sugar and Integrated Industries Companies’’. The complex is one of the major agro-industrial projects, located at Hawamdia city, 20 km south Cairo. It
includes industrial processes related to the production of sugar, ethanol, acetone and beaker’s yeast. The agro-industrial
by-products are directly discharged into the Nile. Nine sites
under the potential effect of the effluent disposal were selected
for monitoring quality of Nile water (Fig. 1). Samples of the
four seasons of 2003 as well as summer and winter of 2005
were collected for microbial and chemical analysis.
Sampling
Periodic water samples were manually and aseptically collected
from the surface water, (ca. <1 m ashore), in sterile brown
bottles (200 ml capacity). Samples were transported to the laboratory and stored at 4 °C until bacteriological analysis was
completed within 24 h. During sample collection, water and
air temperature, pH and electrical conductivity (EC) were measured in situ. Glass-stopped oxygen-sampling bottles (300 ml
capacity), for dissolved oxygen (DO) and biochemical oxygen
demand (BOD) determinations, were filled carefully with water
samples; those of DO were fixed immediately by adding 2 ml
MnSO4 and 2 ml alkaline KI [17]. In addition, one-litre plastic
bottles were filled with water for undertaking the rest of the
chemical analyses.
In addition, samples representing the starch industry effluent were obtained from ‘‘The Egyptian Starch and Glucose
Manufacturing Companies’’, Tora, 15 km south of Cairo.
They were primarily obtained to study their biodegradability
when synergized with the sugarcane effluent.
Analyses
In situ measurements
The temperature of surface water and air was measured using
an ordinary dry mercury thermometer, and transparency by
Secchi-disc [17].
Fig. 1 Satellite image locating the complex of ‘‘The sugar and integrated industries companies’’ (X) and samples obtained; following are
further descriptions of the sampling sites and GPS data:
Sites
Code
Description
Disposal frequency
GPS data
Upstream
Disposal points:
Permanent
S1
0m
–
N:29° 530 3.6200 ; E: 31° 160 48.0600
S2D1
240 m, north upstream
N:29° 530 11.4000 ; E: 31° 160 47.5300
S2D2
S2D3
S2D4
S2D5
S2D6
S3
S4
290 m, north upstream
390 m, north upstream
640 m, north upstream
1020 m, north upstream
1140 m, north upstream
1360 m, north upstream
340 m, north upstream, and 170 m from shore
Almost daily
around the year
Occasional
Occasional
Occasional
Occasional
Occasional
–
–
Occasional
Down-stream
Mid-stream
N:29°
N:29°
N:29°
N:29°
N:29°
N:29°
N:29°
530
530
530
530
530
530
530
12.600 ; E: 31° 160 48.0600
14.2200 ; E: 31° 160 48.0600
23.1300 ; E: 31° 160 48.9200
35.1500 ; E: 31° 160 48.9200
39.700 ; E: 31° 160 48.0600
47.8500 ; E: 31° 160 45.7900
14.0800 ; E: 31° 160 53.6100
Pollution of River Nile by agro-industries
Laboratory measurements
Bacteriological analyses
– Water samples were serially diluted in half strength basal
salt of the N-deficient combined carbon sources medium,
CCM [18]. The pour plate technique and the plate count
87
agar [17] were used for the enumeration of total bacterial
counts at both 22 °C and 37 °C incubation temperatures.
Agar plates of total thermophilic bacteria were incubated
at 55 °C. For total spore-forming bacteria, water samples
and successive dilutions were pasteurized, for 15 min at
80 °C, prior to plating and incubating at 30 °C.
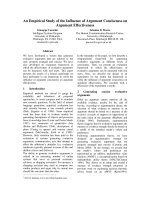
Fig. 2 Spatial changes in microbial determinations of water samples obtained along the sites of sugarcane industries during the
successive seasons of 2003: (A) changes in various bacterial groups; (B) total microbial load; (C) percentage increases in microbial load;
(D) correlation matrix. S1, upstream; S2, the disposal site; S3, downstream; S4, midstream. Means followed by the same letter are not
significantly different (p < 0.05).
88
S.M. Ali et al.
– Total diazotrophs (associative nitrogen-fixing bacteria) were
counted using the surface-inoculated plate method and the
N-deficient combined carbon sources medium CCM [18].
Agar plates were surface inoculated with 200 ll of each suitable dilution, and incubation took place at 30 °C for 72 h.
Representative colonies were transferred to semi solid
CCM and measured for acetylene reduction [19]. Potential
isolates, producing >5 nmoles C2H4 mlÀ1 hÀ1, were
selected and subjected to colony and cell morphology. Further identification was based on the API microtube systems,
API 20 E (for Enterobacteiaceae) and 20 NE (for NonEnterobacteriacae), as a standardized micro-method [20].
– Total and faecal coliforms were enumerated in MacConky
broth medium [17]. For the presumptive test, three sets of
tubes were prepared: five tubes each containing 10 ml of
double strength broth were inoculated with 10 ml water
sample; five tubes containing 5 ml of single strength broth
were inoculated with 1 ml of water sample; and the remaining five tubes containing 5 ml of single strength broth were
inoculated with 0.1 ml of water sample. After incubation at
37 °C for 48 h, the MacConky broth tubes were observed
for acid and gas production. The presumptive coliform
numbers were estimated using the MPN index. Tubes with
a positive presumptive reaction were submitted to the confirmed stage. Sub-cultures from positive tubes were incubated in a water bath at 44.5 °C for 24–48 h; such tubes
were again observed for acid and gas production, with the
number of positive tubes used to calculate the MPN of faecal coliform. Confirmatory test using eosin methylene blue
(EMB) agar was performed.
For detection and counting of faecal streptococci, tubes of
azide dextrose broth medium [17] were inoculated with suitable
serial decimal dilutions of water samples, following the same
procedure as for total coliform. Inoculated tubes were incubated at 37 °C for 48 h. A confirmatory test was made by
transferring three loops from the positive tubes (those with
developed bacteria growth turbidity) to ethyl violet azide broth
and incubation at 37 °C for 48 h. Positive tubes were those
having a slight turbidity accompanied with purple bottom.
Chemical analyses
Electrical conductivity (EC), pH and total dissolved solids
(TDS) were measured using pH, EC and TDS meter model
JENWAY (4330). Dissolved oxygen (DO) was measured using
the modified Winkler method, and biochemical oxygen demand
(BOD) with the five-day incubation method [17]. Chemical oxygen demand (COD) was carried out using the potassium per-
Table 1
manganate method [21]. Colorimetric methods were used to
determine ammonia and nitrite [17] and nitrate [22].
Effluent biodegradation
Effluents tested
Samples were obtained from the crude effluents of both ‘‘The
Sugar and Integrated Industries Companies’’ and ‘‘The Egyptian Starch and Glucose Manufacturing Companies’’. The latter effluent results from corn seeds-soaking processes, where
the supernatant (corn-steep liquor) was directly discharged
into the River Nile. Samples were taken from the effluent discharging pipes in 5 l sterilized bottles, and immediately analyzed for various chemical constituents [23], minerals [24]
and organic carbon [25]. Amino acids were determined [26]
using the Beckman Amino Acid Analyzer Model 7300 and
the Data system Model 7000. Both effluents were stored at
À70 °C.
Biodegradation and biomass production
The biodegradability of the effluents was tested in batch cultures of a number of bacterial isolates obtained from the disposal sites during in situ microbial analysis, namely the
diazotrophs Chryseomonas luteola (Pseudomonos luteola),
Klebsiella pneumoniae, Azospirillum spp. and Azomonas spp.
Cultures were maintained on CCM medium except for Azomonas spp., which was on the specific nitrogen-deficient medium [27].
The sugar effluent was tested as such and/or diluted with
distilled water (1:1 and 1:2, v/v), and amended with the starch
effluent (1, 3, 5 and 10%, v/v). In some cases, the buffer capacity of the tested effluents was adjusted with the buffer solution
of KH2PO4 (0.6 g lÀ1) plus K2HPO4 (0.4 g lÀ1). Prepared effluents were distributed as 100 ml in 500 ml capacity Erlenmeyer
flasks, autoclaved and inoculated with the individual tested
strains (10% v/v). Batch cultures were incubated in a rotary
shaker of 100 rpm at 30 °C. At regular intervals, bacterial populations (cfu) were estimated using the surface plate count
technique. Growth rate and doubling time were calculated
[28] as follows: growth rate K = log Nt–log No/log2 (Tt–To),
where No = viable cell counts at To, To = time at the beginning of determination, Nt = viable cell counts at Tt, Tt = time
of determination. Doubling time (dt) = 1/K. Growth and survival patterns of tested diazotrophs under the previous growth
conditions were compared to those on the recommended culture medium (CCM). In the case of Azomonas spp. batch cultures, organic carbon consumption [25] was monitored parallel
to growth measurement.
Bacterial populations (log cfu mlÀ1) at the experimental site as affected by seasons of the year 2003.
Season
Total bacteria at
22 °C (log cfu mlÀ1)
Total bacteria at
37 °C (log cfu mlÀ1)
Diazotrophs
(log cfu mlÀ1)
Spore-forming
bacteria (log cfu mlÀ1)
Thermophilic
bacteria (log cfu mlÀ1)
Winter
Spring
Summer
Autumn
3.498
3.973
3.967
4.537
3.117
3.781
4.106
4.345
2.718
4.708
4.248
4.983
1.794
2.154
2.197
2.147
0.996
1.098
1.128
2.018
C
B
B
A
D
C
B
A
D
B
C
A
Means followed by the same letter are not significantly different (p < 0.05).
B
A
A
A
B
B
B
A
Pollution of River Nile by agro-industries
Media
– Plate count agar [17] contains (g lÀ1): tryptone, 5.0; glucose,
1.0; yeast extract, 2.5; agar, 15; pH, 7.2.
– MacConkey broth-single strength [17] contains (g lÀ1): peptone, 20; sodium chloride, 5.0; sodium taurocholate, 5.0;
lactose, 10.0 and bromo-cresol purple, 0.01; pH, 7.2. The
89
constituents of the single strength medium were doubled
in the double strength medium. The double strength medium was used for 10 ml inocula.
– Eosin methylene blue agar Levin’s medium [17] contains
(g lÀ1): peptone, 10.0; lactose, 10.0; K2HPO4, 2.0; eosin
Y, 0.4; methylene blue, 0.065; agar, 15; pH, 7.2.
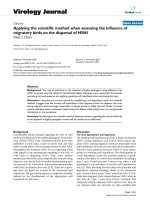
Fig. 3 Spatial changes in bacterial indicators of pollution reported in the water of sampled sites: (A) changes in populations of various
bacterial indicators of pollution; (B), cumulative bacterial load; (C) percentage increases; (D) correlation matrix. S1, upstream; S2,
disposal site; S3, downstream; S4, midstream. Means followed by the same letter are not significantly different (p < 0.05).
90
S.M. Ali et al.
– Azide dextrose broth-single strength [17] contains (g lÀ1):
peptone, 15.0; beef extract, 4.5; sodium chloride, 7.5;
sodium azide, 0.25; pH, 7.2. The constituents of the single strength medium were doubled in the double strength
medium. The double strength medium was used for 10 ml
inocula.
– Ethyl violet azide broth [17] contains (g lÀ1): peptone, 20.0;
glucose, 5.0; sodium chloride, 5.0; KH2PO4, 2.7; K2HPO4,
2.7; ethyl violet, 0.00083; sodium azide, 0.5; pH, 7.2.
– The combined carbon sources medium, CCM [18] comprises
(g lÀ1): glucose, 2.0; malic acid, 2.0; sucrose, 1.0; mannitol,
2.0; KOH, 2.0; KH2PO4, 0.6; K2HPO4, 0.4; MgSO4,
pH
9
30
mg/l
mg/l
230
BOD
COD
20
mg /l
7
DO
25
A
8
6
7H2O, 0.2; NaCl, 0.1; CaCl2, 0.02; FeCl3, 0.015; MnSO4,
0.01; Na2MoO4, 0.002; ZnSO4, 0.00025; CuSO4, 0.00008;
yeast extract, 0.2; fermentol (a local product of corn-steep
liquor), 0.2; sodium lactate was included as 0.6 ml lÀ1
(60% v/v) and pH adjusted to 7.0. The culture medium
was autoclaved at 121 °C for 20 min, while filter-sterilized
solutions of biotin (5 lg lÀ1) and para amino benzoic acid
(10 lg lÀ1) were added after sterilization.
– Nitrogen deficient culture medium [27] contains
(g lÀ1): CaCO3, 1; K2HPO4, 1; MgSO4Æ7H2O, 0.2; NaCl,
0.2; FeSO4Æ7H2O, 0.1; Na2MoO4Æ2H2O, 0.005 and glucose,
10.
0.4
15
dSm-1
10
165
5
220
0.35
155
3.5
3
2.5
2
1.5
1
0.5
0
mg/l
0.05
6.5
6
0.015
0.3
mg/l
mg/l
17
0.3
mg/l
15
14
13
NO2
NO3
NH3-N
0.2
0.15
0.1
0.3
0.01
B
0.25
16
mg / l
145
7
5.5
0
0.35
210
mg/l
7.5
mg/l
0.05
0
0.2
S1
S2
S3
S4
0.04
0.005
0
Site
0.1
S1
S2
S3
Site
Parameters
TBC at 22ºC
TBC at 37ºC
Tth
TSF
TD
TC
FC
FS
Water oC
Transparency
pH
EC
TDS
Alkalinity
DO
BOD
COD
S4
0.03
S1
S2
S3
S4
0
Site
NO2-0.05
-0.06
-0.14
0.02
0.03
0.56*
0.71*
0.19
-0.39*
-0.20
0.60*
-0.13
-0.08
0.48*
0.04
0.10
-0.54*
NO3-0.22
-0.25
-0.22
-0.32*
-0.39*
0.13
0.43*
0.28
-0.79*
-0.15
0.51*
-0.20
-0.08
0.73*
0.15
-0.03
-0.14
S1
S2
S3
Site
NH3-N
0.41*
0.42*
0.39*
0.51*
0.68*
0.37*
0.71*
0.10
0.11
-0.52*
0.00
0.56*
0.48*
-0.14
-0.53*
-0.13
-0.36*
S4
Alkalinity
D
Marked correlations are significant at p< 0.05 (n= 48)
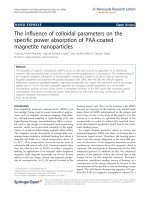
Fig. 4 Physical and chemical determinations of tested waters; site effect (A) total biological load (B) percentage increases and decreases
(C) correlation matrix (D). S1, upstream; S2, disposal site; S3, downstream; S4, midstream. Means followed by the same letter are not
significantly different (p < 0.05).
Pollution of River Nile by agro-industries
91
The richness of the effluent in organic C exerted a specific
enrichment effect on the total population of diazotrophs
(>105 cfu mÀ1, Fig. 2), which physiologically require ample
sources of C for growth.
The seasonal effect was distinguishable, the total microbial
load of various bacterial groups being statistically highest in
autumn and lowest in winter (Table 1). Temperature influence
is a possibility, due to the significant positive correlation coefficients (r = 0.29–0.62) computed between various bacterial
populations and the water temperature (Fig. 2D). An additional cause might to be the inconsistent nature of the effluent
quantitatively and/or qualitatively.
Statistically, bacterial enrichment was reported at the disposal site, being gradually diminished 1.4 km downstream;
however, differences in upstream were still significant
(Fig. 2B). The lateral not vertical effect of the effluent disposal
is clearly demonstrated as the microbial load of the middle
stream remained unaffected.
Statistical analysis
Data were statistically analyzed using analysis of variance (ANOVA) [29] using the MSTAT and STATISTICA (6.0) computer
programs. The correlation coefficients and linear regressions
among the different parameters were determined as well.
Results
The total bacterial load of the Nile water around the four seasons of the year 2003 as affected by effluent disposal is illustrated in Fig. 2A. Increases in total bacteria developed at
22 °C and 37 °C were about 50% (Fig. 2C). Such increases
were elevated to ca. 180% for total thermophiles. This was
particularly reported in autumn at the disposal sites, where
the effluent temperature was 30–33 °C, being higher than upstream (24 °C). Changes in the spore-forming and diazotrophic
bacteria were minimal, being less than 10%.
A
11.0
Plot of Means, 3-way interaction, F(54,240)= 13.87; p<0.000
RM
10.5
SE (1:1)
10.0
SE (1:2)
SE as such
Log No./ ml
9.5
9.0
8.5
8.0
7.5
7.0
6.5
Azospirillum spp.
Klebsiella pneumoniae
Chryseomonas luteola
6.0
0
2
4
8 12 24 32 48 72 96
0
2
4
8 12 24 32 48 72 96
0
2
4
8 12 24 32 48 72 96
Time [h]
B
12
Azospirillum spp.
Klebsiella pneumoniae
Chryseomonas luteola
Log No. / ml
10
8
6
RM
SE+1%StE
4
SE+3%StE
Plot of Means, 3-way interaction, F(90,360)= 163.49; p<0.000
2
SE+5%StE
SE as such
SE+10%StE
0
0
2
4
8
12 24 32 48 72 96
0
2
4
8
12 24 32 48 72 96
0
2
4
8
12 24 32 48 72 96
Time [h]
Fig. 5 In vitro aerobic biodegradation of the sugarcane industry-effluent. A: The growth pattern of various tested bacterial isolates
growing in batch cultures as affected by the effluent dilution (ANOVA 3-ways interactions); the effluent as such, SE; diluted effluent (v/v)
1:1, SE (1:1); diluted effluent 1:2, SE (1:2); compared to reference culture medium, RM. B: The growth pattern of bacterial isolates grown
in batch cultures prepared from the effluent of sugarcane industries when mixed with the effluent of starch industries (ANOVA 3-ways
interaction); Reference culture medium (RM); sugarcane effluent as such (SE) or amended with starch effluent at percentages 1%
(SE + 1%StE), 3% (SE + 3%StE), 5% (SE + 5%StE) and 10% (SE + 10%StE).
92
Correlation coefficients indicated significant positive interactions among the various populations of bacteria tested
(Fig. 2D). In addition, the total bacterial load positively correlated with EC (r = 0.54–0.63), TDS (r = 0.34–0.52), water
temperature (r = 0.29–0.62); and negatively correlated with
transparency (r = À0.31 and À0.40), water pH (r = À0.32
and À0.38) and DO (r = À0.35 and À0.65) (Fig. 2D).
Indicators of pollution were monitored in the experimental
area, and the obtained results are presented in Fig. 3. Representative groups were already reported in the non-affected upstream and middle stream samples; populations ranged from
25 to 1800, 9 to 1800 and 8 to 1800 MPN/100 ml for total coliforms, faecal coliforms and faecal strepotocci, respectively.
Particular enrichment of total coliforms and faecal streptococci was distinguished at the disposal site (Fig. 3B); corresponding increases were 49% and 520% over the upstream
population (Fig. 3C). Seasonally, water load of bacterial indicators of pollution, in particular faecal coliforms, was higher in
spring compared to other seasons. The ratio of faecal coliforms to faecal streptococci ranged from 0.04 to 16.4. The lowest ratios (0.04–0.2) were reported in winter, indicating the
non-human source of pollution. Otherwise, the ratio was very
variable, indicating the complexity of the pollution sources,
being a mixture of both human and non-human (0.9–3.4). Dis-
S.M. Ali et al.
tinctive cases of human sources of pollution (12.3–16.4) were
distinguishable in spring. Correlation coefficients were statistically significant among the various indicators of pollution
(Fig. 3D). Statistically, both total and faecal coliforms correlated negatively with BOD and COD (À0.32 and À0.64) and
positively with nitrite and ammonia (0.37–0.71) (Fig. 4).
The chemical parameters (pH, EC, TDS and alkalinity) were
increased (3–9%) by the effluent disposal (Fig. 4A and C). The
effluent did positively increase both BOD (20%) and COD
(8%) at the disposal site (Fig. 4A–C), then progressively decreased downstream. Concomitantly and significantly, DO is decreased (10%). Among the soluble forms of N, ammonia was
particularly increased at the disposal site indicating active biodegradation through the ammonification process (Fig. 4B). This
was confirmed by significant positive correlations with populations of various bacterial groups (Fig. 4D). This indicates the
in situ biodegradability of the effluent under investigation.
In vitro biodegradation of the effluent of sugar industries by
different genera of bacteria was tested under laboratory conditions. The tested isolates were obtained from water samples at
the disposal sites. Special preference was given to the effective
C-consuming, nitrogen-fixing bacteria (diazotrophs), as confirmed by nitrogenase activity. The taxonomic position of selected isolates was proposed (data not shown). They were
Fig. 6 Growth pattern (log no mlÀ1) and efficient organic C decomposition (O.C., g lÀ1) of Azomonas spp. growing in batch culture of
reference culture medium (NF) compared to the effluent of sugarcane industries, as such and/or pH adjusted with or without buffer
solution.
Pollution of River Nile by agro-industries
able to grow on the crude effluent as such and/or diluted up to
1:2 (v/v), with the descending order Crysomonas luteola
(dt = 0.5 h), K. pneumoniae (dt = 1.0–1.17 h) and Azospirillum spp (dt = 0.75–1.75 h) compared to the CCM reference
culture medium (with dt of 0.75–1.88 h) (Fig. 5A). Statistical
analysis showed no significant differences attributable to dilultioning of the crude effluent. A representative isolate of the
aquatic nitrogen-fixing Azomonas spp. was successfully enriched and isolated from waters at the disposal site. The bacterium successfully grew, and efficiently (>80%) degraded the
organic carbon content of the effluent, with doubling times
even shorter (dt = 0.4–0.56 h) than the reference NF medium
(dt = 1.54 h) (Fig. 6). No significant differences were attributable to the adjusting pH and buffering capacity of the tested
effluents.
Discussion
It is reported that chemicals, food, metal products and textiles
are the most prominent and potential pollution resources for
surface waters in Africa, including Egypt [30]. This is in addition to discharge of contaminated agricultural waste water.
The situation is rather complicated around metropolitan cities,
as in the case of Cairo city, due to the intense industrial and
touristic activities along the shores of the rivers [3,15].
The organic load amended by the various industrial activities in the Cairo city vicinity was calculated [19,31,32], to
which the starch, yeast and glucose industries contribute ca.
3239 kg/day COD and 1148 kg/day BOD. Such enrichment
in organic load questions the practise of the direct disposal
of the effluent onto water surfaces and strongly recommends
pre-treatment through microbial digestion, resulting in successfully reduced COD and sulphate content [33–35]. Furthermore, ground water properties can be affected under heavy
pollution stress by industrial effluents [36]. Therefore, the potential polluting stress of such agro-industries has intrigued
researchers both at home and abroad. In previous publications
[12,13], we clearly demonstrated the potential polluting capacity of baker’s yeast effluent, and the very efficient aerobic biotreatment, prior to disposal, through biomass production of
diazotrophic bacteria. Table 2 presents their rich load of organic carbon (26–62%), nitrogen (0.4–1.7%), cations (32–
1970 ppm), anions (269–5338 ppm), and micro-elements (0.9–
23.7 ppm). Such richness did transitionally boost the microbial
load and compositional changes of Nile water at the disposal
points (Fig. 2), particularly in the autumn (Table 1). As much
as 45–50% increases were reported for total bacteria at 22 °C
and 37 °C. Thermophiles were dramatically increased up to
180%, attributable to the elevation of water temperature from
24 °C to 30–33 °C. In contrast, spore formers and diazotrophs
were minimally affected (6–7%). Earlier reports [16] encountered higher populations (ca. 1.5 · 107 cfu mlÀ1) than those
we reported (3.7 · 105 cfu mlÀ1). This is an indication of some
improvement, possibly through the partial pre-treatment of
tested effluents prior to disposal to comply with recent environmental regulations. It is of interest to mention the lowest
microbial load (4.5 · 103 cfu mlÀ1) in the midstream of the
sites under investigation (Fig. 2B). This agrees with El-Gohary
[7] who concluded that the midstream conditions of the Nile
are still, on average, at a fairly clean level owing to dilution
and degradation of the pollutants discharged. The riverbanks,
however, are much more polluted.
93
Monitoring indicators of pollution resulted in the recovery
of total coliforms, faecal coliforms as well as faecal streptococci. In general, respective populations (that were already
encountered years earlier in the studied area [6,16]) were mini-
Table 2 Chemical analyses of the effluent by-products of the
sugarcane and starch industries around Cairo city.
Parameter
Sugar effluent
Starch effluent
PH
EC (d S mÀ1)
Salinity (g lÀ1)
Total solids (g lÀ1)
Total dissolved solids (g lÀ1)
Ash (g lÀ1)
Organic carbon (g lÀ1)
Total nitrogen (g lÀ1)
Protein (g lÀ1)
C/N ratio
Total sugars (ppm)
Reducing sugars (ppm)
Non reducing sugars (ppm)
8.00
4.50
1.90
3.7
2.30
1.3
260
3.7
23
70.3
0.05
0.03
0.02
4.60
12.50
7.20
65.5
8.90
12
622
16.5
103
37.7
1.97
1.53
0.44
Cations (ppm)
Ca2+
Mg2+
K+
Na+
96
61.2
245.7
379.5
32
673.2
1969.5
64.4
Anions (ppm)
COÀ
3
HCOÀ
3
ClÀ
À
SO4
–
756.4
514.5
268.8
–
5337.5
616
288
30
3
200
530
176
1900
10.07
4.512
2.213
2.304
1.304
4.528
2.623
0.914
10.31
5.899
2.275
2.04
6.419
23.74
3.041
11.61
–
–
–
–
–
–
–
–
–
–
–
–
–
–
–
–
0.11
0.043
0.043
0.23
0.11
0.21
0.33
0.04
0.17
0.05
0.08
0.23
0.07
0.22
0.036
0.06
Elements (ppm)
Macro
N
P
K
Micro
Cd
Cr
Co
Cu
Fe
Mn
Pb
Zn
Amino acids (mg/100 ml)
Asparatic acid
Threonine
Serine
Glutamic acid
Proline
Glycine
Alanine
Cysteine
Valine
Methionine
Isoleucine
Leucine
Phenylalanine
Histidine
Lysine
Arginine
– Not detected.
94
Table 3
S.M. Ali et al.
Relating the analyses of the studied area of River Nile to the international permissible limits.
Parameter
PH
Conductivity (d S mlÀ1)
BOD (mg lÀ1)
COD (mg lÀ1)
À1
NHÀ
3 (mg l )
NO2 (mg lÀ1)
À1
NOÀ
3 (mg l )
Total count 22 °C (·102 cfu mlÀ1)
Total count 37 °C (·102 cfu mlÀ1)
Range
Permissible limits
Upstream
Disposal site
Downstream
Irrigation water
Drinking water
7.2–8
0.31–0.37
1.12–3.2
12.4–17
0.11–0.32
0.008–0.02
0.027–0.072
12–146
2–360
7.2–8.2
0.34–0.39
2.22–3.84
12.8–18.2
0.1–0.34
0.010–0.019
0.024–0.058
197–10500
114–7467
7.5–8.2
0.31–0.38
1.44–2.27
12.3–17.7
0.11–0.27
0.008–0.016
0.025–0.056
7–522
6–780
6.5–8.5
<0.7–<3
10WEF, 40
75WEF, 80
0–5
NA
<5–<30
NA
NA
6.5–8.5
0.4EC
<3ECA1
NA
1.5
1.0
50
1EC
0.1EC
Permissible limits are those provided by FAO for irrigation water [40] and WHO [41] for drinking water. The superscripted values: EC,
European Economic Community [42], ECA1, Level A1 simple physical treatment and disinfection; WEF, Water Environment Federation
(WEF) [43]. NA, not available.
BOD and COD, refer to [17] and [21], respectively.
mal (900, 14, 250 MPN/100 ml) in summer and maximal (1800,
900, 1800 MPN/100 ml) in winter and/or spring. Such seasonal
high densities might be attributable to reduced volume of water
in the river during the annual drought period of November/
January [3,37]. The water level in the studied area was measured as 18.0 m in summer and 16.8 m in winter (The General
Directory of River Nile Protection in Cairo City, personal communication). Under the effect of the disposed effluent, the ratio
of faecal coliforms to faecal streptococci ranged from 0.06 to
1.6, being lowest in summer and highest in spring. This clearly
indicates the complexity of pollution resources, and the potential disposal of not only industrial but also domestic and animal
waste waters from defecation and washing and bathing of humans and animals around the studied area, a conclusion that
is often reached in the rural areas and agricultural basins of
world rivers, e.g. in the Czech Republic [38], Egypt [6,16], India
[2,39], Nigeria [3] and Poland [5]. The level of pollution at the
disposal point is also indicated by the ‘‘differential temperature
ratio test’’, i.e. total bacterial count at 22 °C: at 37 °C [34]. Values obtained (0.2–2.6) were comparable to those recorded earlier [16], being inferior to the recommended 10:1. Increased
levels of COD (16.1 mg lÀ1) and BOD (2.9 mg lÀ1) occurred
at the disposal sites, and then, respectively decreased to 15.0
and 1.8 downstream and midstream, which was comparable
to what has been reported previously [14,15].
Comparing the ammonia content at the disposal points
(258 lg lÀ1) to upstream (190 lg lÀ1), downstream (163 lg lÀ1)
as well as midstream (168 lg lÀ1), indicates in situ microbial
activity and biodegradability of the disposed effluent through
the process of ammonification. This was confirmed by the sharp
increase in the water content of heterotrophic bacterial populations. In vitro experiments concluded that a number of tested
bacterial isolates, representing the in situ microflora, were able
to grow in the effluent batch cultures, with doubling times comparable to the respective reference culture medium. The tested
bacterial strains (Chryseomonas luteola, Klebsiella pneumoniae,
Azospirillum spp. and Azomonas spp.) were able to degrade the
sugarcane effluent; Azomonas spp., in particular, were able exhaust more than 82–92% of the organic matter load of the effluent (Figs. 5A and 6), an efficiency that is related to the wellknown high respiratory metabolisms and C-source requirements of such tested diazotrophs.
It is of importance to mention that the studied area is under
the influence of effluents other than the sugarcane industry,
mainly the starch industry 6 km to the north of the tested disposal site. Therefore, a possibility exists for the in situ combined effect of both effluents, as well as others, on microbial
load or quality of water. In vitro experiments clearly demonstrated a synergetic phenomenon where the effluent of the
starch industry did boost the biodegradability of the sugarcane
effluent (Fig. 5B). Statistically, Klebsiella pneumoniae and
Chryseomonas luteola in particular positively responded with
successive amendments of starch effluent. Active cell growth
of tested diazotrophs nominates such effluents for the production of value-added microbial biomass necessary to formulate
bio-preparates, biofertilizers and biocontrol agents [12,13].
In conclusion, the River Nile in the vicinity of Cairo city is
under pollution stress, mainly from agro-industrial and touristic activities. The downstream analyses, 1.4 km away from the
disposal site, indicated the improvement in water quality,
with respect to chemical but not microbiological parameters
(Table 3). It is of interest to note the increased levels of indicators of pollution compared to the international permissible
limits. In addition, fluctuations are dynamic and exist not only
among seasons but between years. Comparing analyses of
summer and winter seasons of both years 2003 and 2005 (data
not shown) indicated a similarity of not more than 15–45% of
the tested parameters and necessitated careful routine monitoring. In addition, bio-treatments should be imposed prior to
disposal of effluents into the river.
Acknowledgments
The authors would like to pay tribute to Cairo University on
its centennial anniversary, acknowledging the European
cooperation in research and education through the years.
The present work was supported by the EU-French-Egyptian
Research Grant BLAFE/FC31/3-94.
References
[1] Akaninwor JO, Anosike EO, Egwim O. Effect of indomie
industrial effluent discharge on microbial properties of new
Calabar river. Sci Res Essay 2007;2:1–25.
[2] Alam JB, Hossain A, Khan SK, Banik BK, Islam MR, Muyen
Z, et al. Deterioration of water quality of Surma river. Environ
Monit Ass 2007;134(1–3):233–42.
Pollution of River Nile by agro-industries
[3] Ekhaise FO, Anyasi CC. Influence of breweries effluent
discharge on the microbiological and physicochemical quality
of Ikpoba river, Nigeria. Afr J Biotechnol 2005;4(10):1062–5.
[4] Gunkel G, Kosmol J, Sobral M, Rohn H, Montenegro S,
Aureliano J. Sugar cane industry as a source of water pollution –
case study on the situation in Ipojuca river, Pernambuco, Brazil.
Water Air Soil Poll 2007;180(1–4):261–9.
[5] Niewolak S. Bacteriological monitoring of river water quality in
the North area of Wigry National Park. Pol J Environ Stud
2000;9(4):291–9.
[6] Abu-Shady MR, El-Moatassem M, Heikal MT, Khalafalla GM.
Microbiological quantity of the river Nile stretch flows through
Cairo. In: Second international conference on potable water
management and water treatment technologies, Cairo, Egypt;
1996. p. 96.
[7] El-Gohary FA. Industrial wastewater management in Egypt.
Cairo: Italian–Egyptian Study Days on the Environment; 1994.
[8] Abdel-Dayem S. Water quality issues in Egypt. Cairo: Italian–
Egyptian Study Days on the Environment; 1994. p. 81–92.
[9] Myllyla¨ S. Cairo-a mega-city and its water resources. In: The
third Nordic conference on middle eastern studies: ethnic
encounter and culture change. Joensuu, Finland: Tampere
University; 1995.
[10] Euse´bio A, Mateus M, Baeta-Hall L, Almeida-Vara E, Duarte
JC. Microflora evaluation of two agro-industrial effluents
treated by the JACTO jet-loop type reactor system. Water Sci
Technol 2005;51(1):107–12.
[11] Chauhan N, Thakur IS. Treatment of pulp and paper mill
effluent by Pseudomonas fluorescens in fixed film bioreactor.
Poll Res 2002;21(4):429–34.
[12] Ali SM, Amin G, Fayez M, El-Tahan M, Monib M, Hegazi NA.
Production of rhizobia biofertilizers using baker’s yeast effluent
and their application to Leucaena leucocephala. Arch Agron Soil
Sci 2005;51(6):605–17.
[13] Ali SM, Hamza MA, Amin G, Fayez M, El-Tahan M, Monib
M, et al. Production of biofertilizers using baker’s yeast effluent
and their application to wheat and barley grown in North Sinai
deserts. Arch Agron Soil Sci 2005;51(6):589–604.
[14] Abdel-Satar AM. Water quality assessment of river Nile from
IDFO to Cairo. Egypt J Aqua Res 2005;31(2):200–23.
[15] Ezzat MN, Shehab H, Hassan AA, El-Sharkawy M, El Diasty
A, El-Assiouty I, et al. A. Survey of Nile system pollution
sources 2002. Report No. 64, Agricultural Policy Reform
Program-Water Policy Program, United States Agency for
International Development/Egypt.
[16] Sabae SZ. Monitoring of microbial pollution in the river Nile
and the impact of some human activities on its waters. In:
Proceeding of the third international conference on biological
science, vol. 3. Faculty of Science, Tanta University; 2004. p.
200–14.
[17] American Public Health Association (APHA). Standard
methods for the analysis of water and wastewater. In: 19th ed.
Washington, DC: American Public Health Association (APHA);
1995.
[18] Hegazi NA, Hamza MA, Osman A, Ali S, Sedik MZ, Fayez M.
Modified combined carbon N-deficient medium for isolation,
enumeration and biomass production of diazotrophs. In: Malik
AK, Sajjad MM, editors. Nitrogen fixation with nonlegumes. London: Kluwer Academic Publishers; 1998. p. 247–53.
[19] Hegazi NA, Amer HA, Monib M. Studies on N2-fixing spirilla
(Azospirillum spp.) in Egyptian soils. Rev Ecol Biol Sol
1980;17(4):491–9.
[20] Logan NA, Berkeley RCW. Identification of Bacillus strains
using the API system. J Gen Microbiol 1984;130(7):1871–82.
[21] Golterman HL. Methods for chemical analysis of
freshwaters. Oxford and Edinburgh: Blackwell Scientific
Publications; 1971.
95
[22] Mullin JB, Riley JP. The spectrophotometric determination of
nitrate in natural waters, with particular reference to sea-water.
Ann Chim Acta 1955;12(C):464–80.
[23] Association of Official Analytical Chemists (AOAC). Official
methods of analysis of the Association of Official Analytical
Chemists. 15th ed. Washington, DC: Association of Official
Analytical Chemists (AOAC); 1990.
[24] Jackson ML. Soil chemical analysis. New Delhi: Prentice Hall
of India Pvt. Ltd.; 1967.
[25] Walkley A. Walkley-Black method. In: Page AL, editor.
Methods of soil analysis. Part 2. Chemical and microbiological
properties. Madison: American Society of Agronomy Inc., Soil
Science Society of America Inc.; 1982. p. 570–1.
[26] Moore S, Spackman DH, Stein WH. Chromatography of amino
acids on sulfonated polystyrene resins. Anal Chem
1958;30:1185–90.
[27] Atlas RM. Nitrogen free agar medium. In: Parks LC, editor.
Handbook of microbiological media. 2nd ed. London: CRC
Press Inc.; 1997. p. 1019.
[28] Pirt SJ. Principles of microbe and cell cultivation. Oxford and
Melbourne: Bleackwell Scientific Publications; 1975.
[29] Freed RE, Eisensmith SP, Goetz S, Reicosky D, Smail VW,
Wolberg P. MSTAT, a microcomputer program for the design,
management and analysis of agronomic research experiments,
version 4.0. Michigan State University; 1990.
[30] Hamza A, Gallup J. Assessment of environmental pollution in
Egypt: case study of Alexandria metropolitan area. Water Qual
Bull 1982;7:56–61.
[31] Abdel-Shafy HI, Aly RO. Water issue in Egypt: resources,
pollution and protection endeavors. Cejoem 2002;8(1):3–21.
[32] Dijkman JPM. Environmental action plan of Egypt. A working
paper on water. Directorate of General International Cooperation.
The Netherlands: Ministry of Foreign Affairs; 1993. p. 116–27.
[33] Lo KV, Liao PH. Anaerobic treatment of baker’s yeast
wastewater: I. Start-up and sodium molybdate addition.
Biomass 1990;21(3):207–18.
[34] Van der Merwe M, Britz TJ. Anaerobic digestion of baker’s
yeast factory effluent using an anaerobic filter and a hybrid
digester. Biores Technol 1993;43(2):169–74.
[35] Van Der Merwe-Botha M, Britz TJ. Combined pre-degradation
and anaerobic digestion for the treatment of a baker’s yeast
factory effluent. Water Sci Technol 1997;36(6–7):295–301.
[36] Madhavi A, Rao AP. Effect of industrial effluent on properties
of groundwater. J Environ Biol 2003;24(2):187–92.
[37] Sabea SZ, Hazzaa MM, Abdel-Halim SA, Awni NM, Dabbour
SM. Studies on the bacterial indicators of water pollution and
bioremediater isolates for Cu2+, Fe2+ and Zn2+ in Rosetta
branch, river Nile, Egypt. Egypt J Biotechnol 2006;22:77–103.
[38] Bera´nkova´ D, Ungerman J. Nonpoint sources of pollution in the
Morava river basin. Water Sci Technol 1996;33(4–5):
127–35.
[39] Chandra R, Singh S, Raj A. Seasonal bacteriological analysis of
Gola river water contaminated with pulp paper mill waste in
Uttaranchal, India. Environ Monit Ass 2006;118(1–3):
393–406.
[40] Ayers RS, Westcot DW. Water quality for agriculture. 1985.
FAO Irrigation and Drainage, Paper 29. Rome, Italy: Food and
Agriculture Organization of the United Nations (FAO).
[41] World Health Organization (WHO). Guidelines for drinking
water quality. Incorporating First Addendum. 3rd ed. Geneva:
World Health Organization (WHO); 2006.
[42] Council Directive 98/83/EC. Council Directive 98/83/EC of 3
November 1998 relating to the quality of water intended for
human consumption. Off J Eur Com 1998;L330:32–54.
[43] Water Environment Federation (WEF). Using reclaimed water
to augment potable water resources. Washington, DC, USA:
Water Environment Federation (WEF); 1998.