The key role of micromorphology in studies of the genesis of clay minerals and their associations in soils and its relevance to advances in the philosophy of soil science
Bạn đang xem bản rút gọn của tài liệu. Xem và tải ngay bản đầy đủ của tài liệu tại đây (20.45 MB, 15 trang )
Turkish Journal of Earth Sciences
/>
Research Article
Turkish J Earth Sci
(2013) 22: 376-390
© TÜBİTAK
doi:10.3906/yer-1201-11
The key role of micromorphology in studies of the genesis of clay minerals and their
associations in soils and its relevance to advances in the philosophy of soil science
Gordon Jock CHURCHMAN*
School of Agriculture, Food and Wine, Waite Campus, The University of Adelaide, Private Mail Bag No.1, Glen Osmond,
South Australia 5064, Australia
Received: 31.01.2012
Accepted: 23.04.2012
Published Online: 06.05.2013
Printed: 06.06.2013
Abstract: Micromorphological observations from 3 different published works have been studied to aid understanding of aggregation
and of colloids, both unique to soils. Saprolites in Hong Kong included ‘veins’ of different thicknesses and colours. Optical mineralogy
identified them as infill from the neogenesis of clays in rock fractures. The common thicker infills resulted from weathering. Dark infill
contained comminuted primary minerals whereas thin pale infill originated hydrothermally. Scanning electron microscopy (SEM)
showed that the size, shape, and mineralogy of the kaolin minerals formed in infill depended on the types of cracks in the saprolites
and on drying. Energy-dispersive X-ray spectroscopy analyses showed Fe and/or Mn in dark-coloured infill from comminution of
primary minerals upon brecciation, or else beside pale infill in tuff, showing seasonal drying in tuff but not in granite. Pale infill gave
predominantly large tubular halloysite in granite but large platy kaolinite in tuff, except that hydrothermal kaolin gave small particles. In
dark infill, kaolin particles were also small and were kaolinite and halloysite mixtures. The effect of impurity Fe and Mn in constraining
kaolin mineral crystallinity in infills simulates some of the effects of impure soil environments. Long-term cultivation of soils in Australia
led to environmental scanning electron microscope images of large microaggregates indicating their breakdown and loss. Transmission
electron micrographs of ultrathin sections showed that microaggregates of clay size, comprising clay minerals and oxides covering other
materials, including organic matter, were predominant in virgin soil but were broken down to fine clay particles that blocked pores in
cultivated soils. SEM showed a web of biological origin in long-term irrigated sandy New Zealand soil that surrounded macroaggregates
but only became closely attached on drying. The nature of the macroaggregates was affected strongly by their history of drying, even
during preparation for analyses. Micromorphology is especially useful for indicating the nature of aggregates in situ in soils.
Key Words: Aggregates, microaggregates, macroaggregates, aggregate stability, electron microscopy, colloids, neogenesis
1. Introduction
Micromorphology is an established sub-discipline of soil
science. Its foundation probably lies in the use of hand
lenses for magnifying the features of soils in the field,
hence expanding the view available to the naked eye. Thin
sections have been studied under optical microscopes for
the understanding of soil genesis since the beginning of the
20th century (Stoops 2010), but Stoops (2010) considers
that the study of micromorphology had its real start with
the publication of W.L. Kubiëna’s book Micropedology in
1938.
Any study of the fine-level structures or morphology
visible through microscopy, including those of
non-soil materials, can be strictly characterised as
micromorphology. Since the early 20th century, the scope
of microscopy has advanced dramatically, mainly through
the use of electron optical methods. Because the unique
contribution of micromorphology to studies of soils
*Correspondence:
376
and other natural objects comes from its ability to view
these objects in situ, thereby minimising artefacts from
their preparation, scanning electron microscopy (SEM)
is the electron optical approach that has been used most
commonly in these studies. SEM continues to be widely
used in soil studies, for minerals (e.g., Churchman et al.
2010b), organic materials, and also their associations
(e.g., Miltner et al. 2011). Its use with an environmental
cell (as environmental scanning electron microscopy, or
ESEM) means that any effects of strong drying beyond
that experienced by soils in nature can be avoided during
the preparation of soils for viewing. This is especially
advantageous for studying biological entities in soils,
as well as, potentially, for some soil aggregates (Foster
1994; Churchman et al. 2010a). Transmission electron
microscopy (TEM) has also been used, especially by
R.C. Foster in Australia and C. Chenu in France, to study
soils using preparative techniques that leave material, in
CHURCHMAN / Turkish J Earth Sci
ultrathin sections, largely physically intact for viewing
(e.g., Foster & Martin 1981; Chenu 1989; Chenu & Plante
2006; Churchman et al. 2010a).
In this study, published work, largely by me and
co-workers, is used to illustrate some of the uses of
micromorphology at different scales to solve problems
relating to the genesis of some soils and soil minerals and
also to the nature of associations between soil minerals
and other components in some other soils. The main use of
these examples herein is to point to an important role that
micromorphology may be able to play in advancing our
philosophical understanding of soils. Probably the major
advantage of the various micromorphological tools for the
study of soils is that they can provide views of the soils in
situ, as already discussed. Many methods of studying soils
and their components require chemical and physical pretreatments that produce artefacts comprising materials
that may have lost some of the defining characteristics
that constitute soils as a unique object of study. Therefore,
micromorphological studies potentially have a key role
to play in understanding the unique and important
characteristics of the materials we call soils.
This study is mainly concerned with the contributions
that micromorphology can make to discovering the
characteristics of soils that make them unique among
materials for scientific study. Micromorphological studies
by their very nature have also made, and continue to make,
contributions to discerning important characteristics of
soils. It may be argued that the most useful explanation
in soils reside at the level of plant roots, biota (including
microbes), and water and nutrients. Explanations at the
atomic level are not of much use in soils (e.g., Churchman
2010a). Furthermore, roots, biota, and water are concerned
with aggregated soil, not with crushed, disaggregated,
or even dried soil. The strength of micromorphological
studies is that they observe aggregated, and largely
undisturbed, soil.
Hence, this study seeks to ascertain the role that
micromorphology, using optical, electron-optical, and also
newer techniques such as those using X-ray microscopy
(e.g., Wan et al. 2007) and computer-assisted tomography
(Tracy et al. 2010), may be able to play in better defining
soils as a philosophical entity. The philosophical
framework for the study was established by Churchman
(2010a). According to Churchman’s (2010a) analysis, soils
have 3 aspects that mark them as unique objects of study.
These are: (i) the formation and properties of horizons, (ii)
the occurrence and properties of aggregates, and (iii) the
occurrence and behaviour of unique colloids. Respectively,
these may be defined as the unique macro-, micro-, and
nano-characteristics of soils. It is already evident from the
literature that each of these has been the subjects of study
by micromorphological techniques.
In the pedological context, micromorphological
studies, generally at the macro-level using optical
microscopy, have been carried out on different horizons
of soils. The micromorphology of distinctive horizons
including gypseous, spodic, mollic, takyric, and yermic, as
well as the commonly named A, B, and C horizons, has
been the topic of many studies (see, for example, many
of the chapters in Stoops et al. (2010)). Characterisation
of their micromorphological features has enhanced the
understanding of their genesis and that of their constituent
soils. In this study however, emphasis is given to studies
of aggregates and colloids at the micro- and nano-levels,
respectively.
2. Outline of the studies
The micromorphological results from 3 studies are
presented here. The studies are:
1. Saprolite weathering, Hong Kong (Churchman et
al. 2010b). Among micromorphological techniques, this
study employed mainly optical microscopy of this section
and SEM of whole (rock) samples.
2. Long-term effects of agriculture on an Alfisol soil,
South Australia (Churchman et al. 2010a). This study
employed the micromorphological techniques of ESEM
of intact aggregates separated from soils and TEM of
ultrathin sections of resin-embedded sections of whole
soils.
3. Effects of irrigation on an Inceptisol, New Zealand
(Churchman & Tate 1986). This study employed only SEM
for micromorphology.
Most of the details of the setting of the samples and
preparative techniques can be found in the references
cited, but some are summarised and illustrated herein
under ‘Materials’.
3. Materials
3.1. Saprolite weathering
Since the project including this study was carried out
with the major objective of explaining the role played by
kaolin-rich vein-like zones within saprolites on slopes in
Hong Kong in causing or enhancing landslides, the study
mainly focused on samples comprising these ‘veins’. The
saprolites have formed within either granite or volcanic
tuff as a result of weathering under a very high rainfall.
It had been established that they could include either or
both halloysite or kaolinite and therefore their analysis was
able to add to our understanding of the conditions under
which halloysite or kaolinite were formed authigenically
from the products of weathering of granite or volcanic tuff.
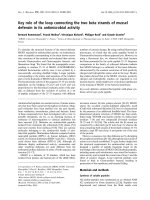
Figure 1 shows a kaolin-rich ‘vein’ within volcanic tuff on
a slope in Hong Kong.
For the study, block samples of approximately 100 ×
100 × 50 mm in size were collected from the saprolites at
377
CHURCHMAN / Turkish J Earth Sci
Cul
tiva
te >
Newly
cultivated
100
yea
rs
Churchyard (virgin)
Trial plots, 250 m
(Cultivated > 100 years + NT, CT, 18 years)
Figure 1. A photograph of saprolite from the weathering of
volcanic tuff on a slope and an incorporated white vein-like
feature that is shown at the true angle to the slope. The width of
the ‘vein’ ranges up to approximately 10-20 mm.
20 sites, 10 of them from granite and 10 from volcanic tuff,
and were transported to the laboratory without drying.
While some sub-samples were removed from ‘vein’ and
surrounding material on the blocks for SEM and other
studies, the largest part of the block was impregnated with
a resin following air-drying and thin sections were cut for
optical microscopy. SEM was conducted with an energy
dispersive X-ray (EDX) detector. Samples were coated with
gold for SEM imaging and with carbon for EDX analyses.
3.2. Long-term effects of agriculture
In this study, samples of the same soil type, which had been
subjected to common, and sometimes also experimentally
controlled, agricultural practices over periods of time of
up to approximately 120 years, were compared for the
effects of these practices on the nature of the soils, and
particularly on the associations between their constituents.
The study was enabled by the availability of a virgin site
adjacent to a recently cultivated and farmed site, also
quite close to rotation and tillage trial sites located on
land that had been formed for ca. 100 years. The site of
the virgin soil was located within a plot of land that had
been occupied by a church building from the beginning of
the settlement of this region in 1869 until 1949 and which
had remained fenced off and never cultivated since. The
terrain is quite flat over the area comprising all sites. The
area including the virgin site and the recently cultivated
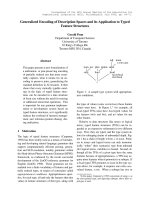
site, and also the location of the trial sites, are shown in an
aerial photograph in Figure 2.
Generally, samples for micromorphological analyses
were taken from cores removed from the soils at intervals
ranging from 0.01 m at the tops of the profiles to >0.1 m at
greater depths.
3.3. Effects of irrigation
The availability of 2 sites, about 8 km apart, on the same
sandy soil type, where soil had been irrigated with effluent
378
Figure 2. An aerial photograph (from Google Earth, taken
December 2006) showing the sampling spots (numbered) in
the churchyard site of the virgin soil and the adjacent newly
cultivated soil as well as the surrounding soil that has been
cultivated for >100 years. The site of the plots in which tillage
(including no-tillage, NT, and conventional tillage, CT) and crop
rotation trials were carried out for 18 years following cultivation
for >100 years overall is indicated, although outside of the
view shown. Reproduced from Churchman et al. (2010a) with
permission from Elsevier.
from an abattoir and kept moist for 25 years at one site
while it had been irrigated with water to maintain a 20%
moisture content at an irrigation research station at the
other site for 30 years, enabled this study. The soils were
maintained under permanent grass-clover pasture, which
was grazed by sheep or cattle. There were control sites at
each site and these both dried out each summer. The main
object of the study had been to determine the effect of the
disposal of the abattoir effluent upon aggregation in the
soil, and the inclusion of the soil which had been irrigated
with water alone for a similar period of time was aimed to
enable the separation of the effects of water alone in the
abattoir effluent from that of the water inevitably added
along with this effluent. SEM was carried out on 3.4-2.0
mm aggregates separated from the soils by wet sieving.
The aggregates were examined by SEM both before airdrying and after freeze-drying, and also after air-drying.
4. Results and interpretations
4.1. Saprolite weathering
While optical microscopy was carried out on both matrix
and ‘vein’ material, the most useful information was
obtained from the latter. Nonetheless, it was observed that
kaolin alteration was ubiquitous and extensive throughout
the host rocks studied. In saprolites from both granite
and volcanic tuff, feldspars showed the greatest degree
of alteration. Alteration of biotite and sometimes also of
muscovite was observed in the matrix of the saprolite,
although some muscovite remained unaltered. Quartz
appeared to be unaltered throughout.
CHURCHMAN / Turkish J Earth Sci
The ‘veins’ varied in colour from white through pink,
shades of yellow, and brown, and, in some cases, were
black. Their colours have been identified more objectively
using the Munsell scheme (see Churchman et al. 2010b).
Even so, they could be separated into pale or dark. The
textures also varied, ranging from clayey to sandy silt.
Pale veins were either clay or silty clay in texture, while
dark veins covered a wider range, including the coarser
grades of sandy, silty clay, and sandy silt. Veins also varied
in thickness or width between samples, but were generally
>10 mm at their thickest in any one sample, although some
were as thick as 55 mm. They also varied in thickness
within samples, as seen in Figures 3-7. In 2 samples, both
in saprolite from tuff at the FNS (Fei Ngo Shan) locality,
the white veins were notably narrow; they were always
narrower than 5 mm. A further point of distinction
between the veins in these 2 samples and those from all
other samples was that those in FNS occurred as broad
networks of intersecting veinlets, characterised as ‘box-
work’, in stark contrast to each of the veins in all other 18
samples, which were in a parallel or sub-parallel alignment
with other veins where they occurred in the same sample.
This distinction pointed to a genetic difference that was
explored (see below) between the origin of the veins in the
FNS samples and those at all other sites.
Overall, the nature of the kaolin clay minerals – and
other minerals – occurring in the veins appeared to have
a direct association with the thickness and colour of the
veins, although thick white veins differed also according to
their lithologies, whether granitic or tuffaceous. Samples
were therefore separated into 4 types according to the
thickness and colour of their included veins. These types
and their optical analyses, as well as their clay mineralogies,
from SEM were as follows:
1. Thick white veins (a) in granite: These are represented
in Figure 3 by sample TKL2 from Tiu Keng Leng.
(b) in tuff: These are represented in Figure 4 by sample
SSR DS1 from Sai Sha Road.
2200
4079 s6 ug10.5 flow lhs
Si
2000
Al
Intensity
1800
1600
1400
Au-M
1200
1000
800
600
400
200
0
K K
1
2
3
Mn Fe
4
5
6
Au-L
Fe
7
8
9
10
Energy (KeV)
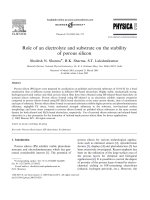
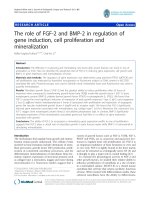
Figure 3. Top left: Block sample TKL2 (approx. 100 mm2), showing thick white vein towards top of sample. Top right: Microfabric of
white vein within sample TKL2; the scale bar is 1 mm long. Lower left: SEM of white vein in TKL2 at low magnification. Lower right:
EDX analysis of the vein in TKL2. Partly reproduced from Churchman et al. (2010b) with permission from the Clay Minerals Society.
379
CHURCHMAN / Turkish J Earth Sci
1400
4157 s01 ug342 yellow average
Si
1200
Al
Intensity
1000
800
600
Au-M
400
200
0
K K
1
2
3
Ti Ti
4
5
MnFe
Fe
6
7
Au-L
8
9
10
Energy (KeV)
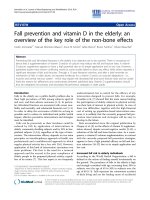
Figure 4. Top left: Block sample SSR DS1 (approx. 100 mm2), showing thick white vein towards top of sample, as well as thinner
black veins and also black spots. Top right: Microfabric of white vein (top) and also thinner black vein within sample SSR DS1; the
scale bar is 1 mm long. Lower left: SEM of white vein in SSR DS1 at low magnification. Lower right: EDX analysis of the vein in SSR
DS1. Partly reproduced from Churchman et al. (2010b) with permission from the Clay Minerals Society.
2. Thin white veins. These are represented in Figure 5
by sample FNS N from Fei Ngo Shan.
3. Thick brown veins. These are represented in Figure 6
by sample TKL3 from Tiu Keng Leng.
4. Thick black veins. These are represented in Figure 7
by sample STC S1A from Sha Tin College.
The major features of the images and analyses in Figures
3-7 and the others of similar types that they represent
(Churchman et al. 2010b) that require explanation include:
1. The reason why veins are either ‘white’ (or other light
colours such as pink) or dark, including shades of brown,
yellow, red, or black.
2. The reason for the different sizes and shapes of claysized particles in SEM.
380
3. The reason why the veins in samples from one
location (FNS) are much thinner than the veins in samples
from other locations and that they have a unique random
or box-work configuration among the other samples in the
study.
The explanations are detailed by Churchman et al.
(2010b) but, in summary, they are explained by the
origin of the veins. Fresh rock, whether granite or tuff,
has undergone alteration on the slopes. This has occurred
either by weathering, or by hydrothermal alteration.
Alteration has led to the replacement of the most easily
altered primary minerals by secondary minerals. X-ray
diffraction analyses, as well as previous studies on samples
from the slopes of Hong Kong (Kirk et al. 1997; Campbell
CHURCHMAN / Turkish J Earth Sci
4304 s02 ug65.1 top slicken
Si
1200
1000
Intensity
800
600
Au
400
Al
200
0
K
Mg
Na
1
2
3
Au
Fe
Ca
4
Ti
5
Mn
Fe
6
7
8
9
10
Energy (KeV)
Figure 5. Top left: Block sample FNS N (approx. 100 mm2), showing thin white veins throughout sample. Top right: Microfabric
of white vein within sample FNS N; the scale bar is 1 mm long. Lower left: SEM of white vein in FNS N at high magnification.
Lower right: EDX analysis of the vein in FNS N. Partly reproduced from Churchman et al. (2010b) with permission from the Clay
Minerals Society.
et al. 1998) indicated that either halloysite or kaolinite
constituted the bulk of the secondary minerals formed.
The rocks have become weakened as a result of alteration
of their constituent minerals. Especially because of the load
imposed by materials upslope, the weakening of the rocks
has led to their fracture. This has occurred either along
intergranular contacts within the rocks or else by shearing
of crystals. Fracturing that occurred along intergranular
contacts would lead to clean, uncontaminated fracture
surfaces between rock fragments while that occurring with
shearing of crystals would lead to a brecciation of these
crystals. The brecciation would lead to the comminution of
primary minerals into finer fragments and hence to their
easier dissolution, to give especially oxides and hydroxides
of iron and manganese. The veins are explained generally
by the neogenesis of kaolin minerals from solutions that
have leached from the rocks during their alteration. They
are more correctly described as ‘infill’. On the basis of this
genetic mechanism, the explanations of the particular
features of Figures 3-7 identified here are proposed as
follows:
1. Colour of infill. Infill is white when rock fracture
has occurred largely along intergranular contacts, leaving
clean surfaces for neogenesis to occur in the newly formed
void, devoid of coloured contaminants. This is so in the
representative samples described in Figures 3-5. The
EDX analyses in Figure 3 show almost no peak for the
colouring elements Fe and Mn. Apart from that for the
covering Au, the analyses are dominated by those for Al
and Si, with Si > Al, consistent with the composition of
the kaolin minerals. That in Figure 4 is similar but shows
very small peaks for Fe and Mn, as well as minor peaks
for K and Ti. The analyses in Figure 5 are essentially the
same, although there are significantly stronger peaks for
Fe, especially, along with small peaks for K and Ti, in this
case (sample FNS N). These may arise from the bulk of
381
CHURCHMAN / Turkish J Earth Sci
4083 s10 ug14.1 smooth mat
Si
6000
Intensity
Al
5000
4000
Au-M
3000
2000
Fe
1000
0
KK
1
2
3
Ti
4
Mn
5
6
Au-L
Fe
7
8
9
10
Energy (KeV)
Figure 6. Top left: Block sample TKL3 (approx. 100 mm2), showing brown veins throughout the sample. Top right: Microfabric
of brown vein within TKL3; the scale bar is 0.25 mm long. Lower left: SEM of brown vein in TKL3 at intermediate magnification.
Lower right: EDX analysis of the vein in TKL3. Partly reproduced from Churchman et al. (2010b) with permission from the Clay
Minerals Society.
this sample bordering especially narrow infill (Figure 5),
as already noted. The resolution of the beam for analysis
may be insufficiently small to include just infill materials
so that primary minerals such as K-feldspar and titanium
oxide contribute to the analyses. The dominant infill in the
3 samples shown in Figures 3-5 is largely monochrome,
although there are textural differences, especially between
that in FNS N (Figure 5) and those in TKL2 (Figure 6) and
SSR DS1 (Figure 7), as will be explained further below. The
black infill alongside the dominant white infill in SSR DS1
(Figure 6) has another origin (see below).
By contrast, coloured infill may include considerable
Fe, as in TKL3, and this contributes to the various shades of
red, yellow, and brown in the infill in this sample (Figure 6)
382
and/or Mn, which is largely responsible for the dominantly
black infill in STC S1A (Figure 7). K and Ca are also present
in notably high proportions, indicating the incorporation
of substantial primary minerals in the infill in this sample
(STC S1A). The optical micrograph for TKL3 (Figure 6)
and STC S1A (Figure 7) shows that infill in these samples
is very heterogeneous in terms of colour, at least. That for
STC S1A also shows great heterogeneity, and also a high
concentration of small comminuted particles that have
resulted from the brecciation of primary minerals upon
rock fracture occurring within mineral grains.
2. There is a huge difference between the sizes of the
dominant particles in the different infills. Those shown
in the SEMs in Figures 3 and 4 within thick white infills
CHURCHMAN / Turkish J Earth Sci
1200
4207 s13 u41.1 fibres
Mn
1000
800
Intensity
Au
Si
600
Al
400
Mn
Fe
K
200
0
1
2
3
Ca
Au
Fe
4
5
6
7
8
9
10
Energy (KeV)
Figure 7. Top left: Block sample STC S1A (approx. 100 mm2), showing black veins throughout the sample. Top right: Microfabric
of black veins within STC S1A; the scale bar is 1 mm long. Lower left: SEM of black vein in STC S1A at intermediate magnification.
Lower right: EDX analysis of the vein in STC S1A. Partly reproduced from Churchman et al. (2010b) with permission from the
Clay Minerals Society.
are large, although they differ from each other in their
dominant shape. They comprise very long tubular particles
in TKL2 infill (Figure 3) and quite large platy particles,
assembled together in the shape of rosettes, in SSR DS1
infill (Figure 4). In these, and in all other samples, X-ray
diffraction (XRD) analyses have identified tubular particles
as halloysite and platy particles as kaolinite. In TKL2 and
SSR DS1, differential thermal analyses (DTAs) showed
that kaolin minerals comprised at least 80% of the infill
(Table 2 in Churchman et al. 2010b). XRD showed that
100% of the kaolin minerals in TKL2 infill are halloysite,
while 80% of them in SSR DS1 infill are kaolinite (Tables 2
and 3 in Churchman et al. 2010b).
By contrast, the particles of kaolin minerals in the
infills in FNS N, which is white, and in both TKL3 and
STC S1, which are highly coloured, are much smaller
than those in TKL2 and SSR DS1. They appear to be
highly tubular in TKL3 (Figure 6), platy in FNS N (Figure
5), and a mixture of shapes in STC S1 (Figure 7). XRD
analysis confirmed abundant halloysite in TKL3, although
kaolinite was present in nearly as high a concentration,
and it indicated a significantly higher concentration for
halloysite than for kaolinite in FNS N. This confirms
that electron microscopy is probably too selective and/or
misleading when one shape (tubular in this case) is visually
dominant for good quantitative analyses. For STC S1A,
DTA shows that the proportion of infill that comprised
kaolin minerals was very low. XRD showed a crystalline
manganese oxide, todorokite, to be present and other SEM
images showed this to comprise quite large platy particles.
383
CHURCHMAN / Turkish J Earth Sci
(a)
(b)
(c)
(a)
(b)
(c)
Figure 8. Environmental scanning electron micrographs (ESEMs) (left) and transmission electron micrographs (TEMs)
of ultrathin sections (right) of samples from within the upper 0.05 m of (a) virgin soil, (b) newly cultivated soil adjacent
to virgin soil site, and (c) soil under long-term conventional cultivation. Scale bars represent 50 µm in ESEMs and 1 µm
in TEMs. “Q” indicates grains of quartz and “qz” indicates quartz shards. “M” indicates microaggregates; “cl”, clay within
microaggregates; “fc”, fine dispersed clay outside of microaggregates; “om”, organic matter. Reproduced from Churchman et
al. (2010a) by permission from Elsevier.
Therefore, the SEM in Figure 7 shows tubular halloysite,
platy kaolinite, and also platy todorokite. The evidently
substantial occurrence of the latter is consistent with the
high proportion of Mn shown in the EDX analysis of this
sample (Figure 7).
The explanation for the comparatively larger sizes of
particles in TKL2 and SSR DS1 (Figures 3 and 4) than
in others lies in the relatively clean environment (open
cracks) in which kaolin minerals formed by neogenesis in
these samples. The reason why kaolin minerals formed in
the coloured infills are small comes from the constraints
384
that the other ions in solution (those of Fe and/or Mn,
mainly) imposed upon crystal growth in the contaminated
environments resulting from the brecciated fractures.
The explanation why halloysite is formed rather than
kaolinite, or vice versa, in the various samples of infill was
suggested by the appearance of manganese oxide, as black
veins or black spots, and/or iron oxides in or alongside the
infill many of the samples, especially SSR DS1 (Figure 4),
TKL3 (Figure 6), and, of course, STC S1A (Figure 7). Only
those samples containing infill including or bordering on
black spots or veins of manganese oxide and/or red, yellow,
CHURCHMAN / Turkish J Earth Sci
a
b
c
d
Figure 9. Scanning electron micrographs (SEMs) of the surfaces of macroaggregates of 2-3.4 mm in size from a soil: (a) (top left)
Irrigated with water to 30% moisture content for 30 years; aggregate studied freeze-dried. (b) (top right) From control site adjacent
to water-irrigated soil; aggregate studied freeze-dried. (c) (lower left) Irrigated with effluent from an abattoir and kept moist for 25
years; aggregate studied freeze-dried. (d) (lower right) Irrigated with water to 30% moisture content for 30 years; aggregate studied
air-dried. Reproduced from Churchman and Tate (1986) by permission from CSIRO Publishing.
or brown colouring from iron oxides or oxyhydroxides
contained kaolinite. Otherwise, where these features did
not appear, the kaolin minerals in infill were predominantly
halloysite. The white infill in TKL2 (Figure 3) contains
only halloysite among the kaolin minerals. Manganese
and iron oxides or oxyhydroxides both require drying for
their formation, so it is concluded that their occurrence
indicates that the infills containing or bordering these
oxides have undergone periods of drying. Halloysite is
formed in its hydrated state (Churchman & Carr 1975),
so it can be concluded that, when drying occurs, kaolinite
is favoured as the newly formed kaolin mineral, whereas
halloysite only forms when the environment remains wet.
Drying is only intermittent, and probably seasonal, in the
high rainfall zone of Hong Kong, so it appears that mixtures
of halloysite and kaolinite, such as in all samples examined
here except TKL3, result from different hydration regimes
occurring cyclically in the corresponding sites.
3. The exceptional infill in FNS samples. Both the
optical evidence and that from SEM suggest that FNS
samples, represented by FNS N (Figure 5) here, have a
different origin from the other samples in this study. The
microfabric by optical microscopy in Figure 5 appears
to be unstressed, showing randomly disposed microvermiform shapes, unlike those in the other samples in
Figures 3, 4, 6, and 7, which reflect processes of shearing
and/or brecciation having taken place in their formation
and development. The clay particles also differ in their
385
CHURCHMAN / Turkish J Earth Sci
a
b
c
Figure 10. Transmission electron micrographs (TEMs) of ultrathin sections (right) of
samples from within the upper 0.05 m of an Alfisol from South Australia, showing dark
mineral matter surrounding (a) (top) plant cells, probably fine roots (pale), and also
quartz shards; (b) extracellular polysaccharide (identified by staining); and (c) bacteria.
The scale bar in each case represents 1 µm. Partly reproduced from Churchman (2000)
with permission from CRC Press.
alignment and association with one another from the
other samples studied. They comprise relatively small
particles, which are randomly interlocked and reasonably
tightly packed. These characteristics mark them as typical
products of hydrothermal processes, according to Keller
(1976). Weathering, by contrast, tends to give looser
arrangements of particles (Keller 1976). A hydrothermal
origin is possible in Hong Kong, especially close to fault
zones (Irfan 1996). The infill in the FNS samples may not
have formed by complete fractures of rocks as in the other
samples studied.
4.2. Long-term effects of agriculture
In this study, described in detail by Churchman et al.
(2010a), micromorphology was carried out using ESEM on
air-dried aggregates and with TEM, which was applied to
ultrathin sections of resin-treated samples of topsoil. While
many other measurements were made on the soil samples,
386
micromorphology proved crucial in understanding
the effects on the soil studied of different extents of
agricultural management. The micromorphological data
enabled explanations of the differences between soils with
different histories that were recorded in particle and pore
size distributions, surface spectral analyses, and various
measures of aggregate stability to be made in terms of
observable changes in the nature and extent of aggregation.
Examples of observations made with ESEM and TEM of
soils with different land-use histories are given in Figure 8.
The ESEMs in each case (virgin, newly cultivated, and
long-term cultivated soils) show more-or-less rounded
microaggregates that are each just a few micrometres
(generally <10 µm) in diameter mixed in with larger
primary particles, which are identified by XRD as largely
comprising quartz. Quartz is identified in each of the ESEM
images. Clusters of microaggregates, often approximately
CHURCHMAN / Turkish J Earth Sci
50 µm in size, may themselves be characterised as larger
microaggregates, following the widely-accepted Tisdall
and Oades (1982) hierarchical model of aggregation in
soils. The ESEMs of the different samples in Figure 8 differ
mainly in the relative proportions of microaggregates of
various sizes, on the one hand, and quartz particles on
the other. Microaggregates tend to cover the surfaces of
quartz particles, but to different extents in each case.
While electron micrographs necessarily provide selective
views, a surface-sensitive technique with a wider scope,
photoacoustic infrared spectroscopy, confirmed that
more quartz was exposed at the surface of the long-term
cultivated soil than the newly cultivated soil whereas
there was considerably less quartz exposed at the surface
of the virgin soil than in both of the cultivated soils. One
reason why the greatest amount of quartz was exposed at
the surface of the long-term cultivated soil than in that of
both the virgin and newly cultivated soil was revealed by
the particle size distributions, which showed a lower clay
content in the long-term cultivated soil than in either the
virgin or newly cultivated soil, each of which had the same
content of clay. Loss of clay by erosion, likely to be by wind,
is suggested by this result.
The effects of soil management at the micrometric
level are shown by the TEMs in Figure 8. In the virgin soil
(Figure 8a), virtually all of the fine material occurs within
microaggregates which are approximately 2 µm across; 2
µm is one of the basic sizes for microaggregates that are
postulated in the Tisdall and Oades (1982) hierarchical
model. Although microaggregates also dominate the TEM
image for the newly cultivated soil (Figure 8b), these are
generally greatly reduced in size from those shown for
the virgin soil in Figure 8a. Many are submicron in size.
In the TEM image of the conventionally cultivated soil
(Figure 8c), however, there appears to be much dispersed
submicron material that is characterised as fine clay
in the image. The high concentration of fine clay in the
conventionally cultivated soil blocks pores (Figure 8c), but
more pores are open in the newly cultivated soil (Figure
8b), while they appear to be generally free of fine clay
in the virgin soil (Figure 8a). The pore size distribution
determined by mercury intrusion porosimetry confirmed
these indications from TEM by showing a peak in pore
volume for pores in the 10-100 µm range for the virgin
soil that decreased in height for the newly cultivated soil,
but had disappeared from the pore size distribution for the
long-term cultivated soil. Furthermore, it may be deduced
from Figure 8c that the dispersed fine clay is easily available
for loss from erosion by wind or water. The series of TEMs
in Figure 8 show that the source of deterioration of the
soil by long-term agricultural practices lies in the loss of
microaggregates. A measure of the stability of aggregates to
a disrupting force, in this case osmotic pressure, confirmed
the micromorphological observations, especially by TEM,
of the breakdown of aggregates.
Churchman et al. (2010a) also studied the effects of
the introduction of no-till management practices to the
soil following its cultivation by conventional practices
for ~100 years. The soil was examined by all the same
micromorphological and other analytical techniques as
samples from the other sites after no tillage had been used
for 18 years. It yielded similar images in ESEM and TEM
to those shown in Figure 8c for long-term conventional
cultivation and similar results from photoacoustic infrared
spectroscopy, for particle and pore size distributions and
for aggregate stability, to those for this latter soil. There was
no evidence for any effect of no-till management on the
nature and extent of microaggregation at any scale below
~100 µm of soil that was already cultivated conventionally
for ~100 years.
4.3. Effects of irrigation
In this study, described in detail by Churchman & Tate
(1986), micromorphology as carried out using SEM
enabled identification of a mechanism to explain the
results of macroaggregate stability determinations that
were made using the traditional wet-sieving approach
that is common in soil structural studies. According to
these determinations, air-dried macroaggregates 2-3.4
mm across following long-term irrigation with water only
were more stable to immersion in water with mechanical
agitation, as assessed by wet sieving, than were those from
long-term irrigation with organic-rich abattoir effluent.
When wet-sieving was carried out on field moist soils
without prior air-drying, although those from both waterand effluent-irrigation were weaker than the air-dried
macroaggregates, the macroaggregates from the waterirrigated soil were even less stable than those from the airdried soil. The SEMs of the surface of the macroaggregates
following the various irrigation treatments are shown in
Figure 9.
The outstanding feature of the SEMs in Figure 9 is
the appearance of a web, with an organic appearance,
surrounding the aggregates. In the aggregates that had been
irrigated with water alone but never air-dried either over
the preceding 30 years or prior to SEM analysis (Figure 9a),
the web was incomplete and only partially attached to the
soil particles. By contrast, the web appeared to be closely
attached to the soil particles in the aggregates from the
control site alongside the soil that was irrigated with water.
In the macroaggregates from the effluent soil (Figure 9c),
the web was even more complete, although this soil was
also examined without prior drying, either throughout
its treatment or prior to SEM analysis. When the waterirrigated soil had been air-dried prior to analysis (Figure
9d), no distinct web was apparent over the particles.
387
CHURCHMAN / Turkish J Earth Sci
It is likely that the web observed in Figure 9 consisted
of a polysaccharide, which is commonly involved in the
stabilisation of macroaggregates, e.g. Tisdall and Oades
(1982). The SEMs show incomplete binding by the web
of components in wet macroaggregates, especially when
these were from irrigation by water alone, but the closer
association of the components in dried macroaggregates
helps to explain the generally lower water stability of
macroaggregates prior to air-drying and especially the
lower stability of water-irrigated rather than effluenttreated macroaggregates when drying was not allowed
to occur. This supports an earlier study by Reid and
Goss (1981), who found that stabilisation of soils by
polysaccharides may not become effective until soils dried
out.
5. Discussion
In discussing the implications of the contributions made
by the various micromorphological techniques employed
in these 3 studies to a better philosophical understanding
of soils, it should first be noted that the study of saprolites
is not concerned with soils per se. In terms of the unique
characteristics of soils proposed by Churchman (2010a),
the saprolites do not comprise horizons or aggregates.
However, they show a variety of forms of their constituent
minerals, which are mainly either halloysite or kaolinite,
and this aspect has a bearing upon the origin of the unique
character of colloids in soils. In inorganic saprolites, the
colloids comprise clay minerals. The study of the saprolites
showed that, when formation of these clay minerals
occurred, by the process of neogenesis that is common in
soils (Churchman & Lowe 2012), the size, especially, of the
product minerals was greatly influenced by the presence
of impurities in the environment in which formation
took place. As pointed out by Churchman (2010b), using
other examples from the same Hong Kong study, clay
minerals in soils are generally much smaller than their
counterparts that have formed in less heterogeneous nonsoil environments. The contrast between the minerals in
the white infills from weathering (samples TKL2 and SSR
DS1, Figures 3 and 4) and those in the coloured infills
(samples TKL3 and STC S1A, Figures 6 and 7) simulates
something of the comparison between, respectively, clay
minerals formed in a non-soil environment and those
formed in soils. The main difference between the simulated
soil-like environments in these coloured infills and those
in soils lies in the influence of biology on soils. Biology
tends to exacerbate the heterogeneity of the environments
for neogenesis in soils. Of course, clay minerals in
soils have many other characteristics that make them
somewhat exceptional compared with those from nonsoil environments, but the work described here makes
no particular contribution to their origin. Note, however,
388
that micromorphological techniques, especially highresolution TEM, can show the nature of interstratifications
and point to their origin (see, e.g., Churchman et al. 1994).
The micromorphological study of the long-term effects
of agriculture on a soil showed the effects of common
agricultural practices on microaggregates, generally
regarded as aggregates which are <250 µm in equivalent
spherical diameter (Tisdall & Oades 2006). These are the
most stable constituents of the structure of soils (Tisdall &
Oades 1982; Churchman et al. 2010a) and their breakdown
signifies a loss of structure and hence of agronomically
important pores that is essentially irreversible by farming
practices (Churchman et al. 2010a). Furthermore, the loss
of the smallest microaggregates implies the release of very
fine particles, as seen in Figure 8c, that leads to their easy
loss from the soil system and hence erosion by wind or
water. Furthermore, close examination of TEMs that were
obtained in this particular study, including that in Figure
8a, showed that the essential nature of microaggregates was
made up of mineral material, identified by Churchman et
al. (2010a) as both crystalline clay minerals and oxides,
surrounding organic matter of various types. Figure 10 is a
composite of images from TEM that shows this feature of
some microaggregates in the soil studied. It is very likely
that the coating minerals serve to protect the organic
matter in the core of the microaggregates from breakdown
through either predation by microbes or oxidation. This
mechanism is likely to constitute the main method of
sequestration of carbon in soils generally (e.g., Lehmann
et al. 2007; McCarthy et al. 2008).
The micromorphological effects found in the study
of the effects of irrigation on soils point to a biologically
derived mechanism for the association of particles and
microaggregates together to give macroaggregates. It
is the pores between macroaggregates that are most
important for the anchoring of plant roots in soils and for
the transport of essential nutrients, water, and air to them
(Tisdall & Oades 1982). The micromorphology of the soil
in this study also showed strong effects of air-drying upon
soil structure.
Aggregation has been identified as a unique
characteristic of soils, even though there is no clear-cut,
widely accepted definition of aggregates (Churchman
2010a). This is exemplified by a discussion by Weinhold et
al. (2005) of the factors involved in assessing soil quality.
Soil quality itself is defined as “the capacity of a soil to
sustain biological productivity, maintain environmental
quality and promote plant and animal health” (Weinhold
et al. 2005, p. 349). Weinhold et al. (2005) then concluded
that aggregation accounts for almost all of the physical
properties, many of the biological properties, and also some
of the chemical properties that relate to the assessment of
soil quality.
CHURCHMAN / Turkish J Earth Sci
In practice, measures of the stability of aggregates
to disruptive forces such as water have been generally
used to define the status of aggregation in soils, and the
important contributions of aggregates to soil properties
have been discussed in terms of those of, for example,
‘water-stable aggregates’. The stability of macroaggregates
is often determined by their resistance to disruption by
immersion in water through wet-sieving (e.g., Kemper &
Roseneau 1986), but this technique, besides being limited
because it does not represent all possible disruptive forces
encountered by soils in the field (for example, that of wind),
is also limited and probably compromised by the methods
chosen for soil preparation, and particularly those of
drying and re-wetting. Air-drying is usually adopted, but
soils may also be analysed field-moist (e.g., Churchman &
Tate 1986), while many studies (e.g., Kemper & Roseneau
1986; Oades &Waters 1991; Le Bissonais 1996) have shown
that even the rate of re-wetting air-dried soils with water
can substantially affect the result obtained. Le Bissonais
(1996) suggested that an older French approach whereby
re-wetting was carried out in ethanol, had merit, although
he also suggested that the method adopted should reflect
the disruptive forces that were most relevant in each
situation. In general, however, soils, and particularly
macroaggregates, are likely to become disrupted in the
course of making any measurement of, for example, their
size distribution. Generally, soils and their aggregates
comprise a range of stabilities and the weakest are easily
disrupted; hence, studies of those that are stable to a
defined level of a disruptive force may neglect important
characteristics of their unstable counterparts. For example,
they may neglect aggregates bound, however loosely,
by the network seen in pre-dried soils in Figure 9a. In
order to properly represent the nature of the aggregates
encountered by, for example, plant roots, microbes, and
nutrients and pollutants in soils, it would be preferable to
be able to study aggregation and aggregates as they occur
in situ in soils.
As seen here and elsewhere (e.g., Chenu 1989; Oades
& Waters 1991; Foster 1994; Stoops et al. 2010), modern
approaches to micromorphology, especially using
electron-optical techniques, offer the promise of being able
to advance our understanding of the nature of aggregates
in situ. The promise is encouraged by the quite recent
development and use in soil studies of such techniques as
scanning transmission X-ray microscopy (STXM) (Wan
et al. 2007) and X-ray computer tomography (CT) (Tracy
et al. 2010). STXM has enabled mapping elements as they
occur spatially in microaggregates (Wan et al. 2007) while
X-ray CT enables 3-dimensional imaging of undisturbed
aggregates as well as roots (Tracy et al. 2010) in soil.
In summary of the central role played by aggregation
in soils, it may be argued that the most important
properties of soils, including the protection they offer
for their constituent microorganisms (e.g., Bruns 2002),
are directly attributable to those of their aggregates and
to the nature and extent of their aggregation. Insofar as
materials in soils, e.g., quartz sands and fine clays, are
not aggregated together with other soil components (e.g.,
Figure 8c), they will behave similarly to these particular
materials in other contexts, e.g., quartz sands in river
courses and beaches, and fine clays in saprolites, regoliths
in general, and mineral deposits. Otherwise, aggregates
demand close and careful attention by current and future
micromorphological approaches if we are to advance our
knowledge of soils as unique and important materials.
Acknowledgements
I wish to acknowledge the considerable practical and
intellectual contributions to the work presented here
by the following colleagues or former colleagues: Kevin
Tate, Craig Ross, Karen Meyrick, Elisabeth Pansier (New
Zealand), Ralph Foster, Stuart McClure, Ian Pontifex, Jan
Skjemstad, Richard Merry, Les Janik, Daniel Weissmann
(Australia), Luigi d’Acqui (Italy), and Steve Parry (Hong
Kong). Funding for the work reported was provided by the
former Department of Scientific and Industrial Research
(New Zealand), and the Grains Research and Development
Corporation (Australia). Permission to reproduce some
of the figures was given by the Civil Engineering and
Development Department, Hong Kong.
References
Bruns, M.A. 2002. Bacteria. In: Lal, R. (ed). Encyclopedia of Soil
Science. Marcel Dekker, New York, 94-99.
Campbell, S.D.G., Koor, N.P., Franks, C.A.M. & W.W.L. Shum.
1998. Geological assessment of slopes in areas close to major
landslides on Hong Kong Island. In: Li, K.S., Kay, J.N. &
Ho, K.K.S. (eds). Slope Engineering in Hong Kong. Balkema,
Rotterdam, 121-128.
Chenu, C. 1989. Influence of a fungal polysaccharide, scleroglucan, on
clay microstructures. Soil Biology and Biochemistry 21, 299-305.
Chenu C. & Plante A.F. 2006. Clay-sized organo-mineral complexes
in a cultivation chronosequence: revisiting the concept of the
‘primary organo-mineral complex’. European Journal of Soil
Science 57, 596-607.
Churchman, G.J. 2000. The alteration and formation of soil minerals
by weathering. In: Summer, M.E. (ed.) Handbook of Soil
Science, CRC Press, Boca Raton, F3-F76.
Churchman, G.J. 2010a. The philosophical status of soil science.
Geoderma 157, 214-221.
389
CHURCHMAN / Turkish J Earth Sci
Churchman, G.J. 2010b. Is the geological concept of clay minerals
appropriate for soil science? A literature-based and
philosophical analysis. Physics and Chemistry of the Earth 35,
927-940.
Churchman, G.J. & Carr. R.M. 1975. The definition and nomenclature
of halloysites. Clays and Clay Minerals 23, 382-388.
Churchman, G.J., Foster, R.C., D’Acqui, L.P., Janik, L.J., Skjemstad,
J.O., Merry, R.H. & Weissmann, D.A. 2010a. Effect of land-use
history on the potential for carbon sequestration in an Alfisol.
Soil & Tillage Research 109, 23-35.
Churchman, G.J. & Lowe, D.J. 2012. Alteration, formation, and
occurrence of minerals in soils. In: Huang, P.M., Li, Y. &
Sumner, M.E. (eds). Handbook of Soil Sciences. 2nd edition. Vol.
1: Properties and Processes. CRC Press, Taylor & Francis, Boca
Raton, Florida, 20.1-20.72.
Churchman, G.J., Pontifex, I.R. & McClure, S.G. 2010b. Factors
affecting the formation and characteristics of halloysites or
kaolinites in granitic and tuffaceous saprolites in Hong Kong.
Clays and Clay Minerals 58, 220-237.
Churchman, G.J., Slade, P.G., Self, P.G. & Janik, L.J. 1994. Nature
of interstratified kaolin-smectites in some Australian soils.
Australian Journal of Soil Research 32, 805-822.
Churchman, G.J. & Tate, K.R. 1986. Effect of slaughterhouse effluent
and water irrigation upon aggregation in seasonally dry New
Zealand soil under pasture. Australian Journal of Soil Research
24, 505-516.
Foster, R.C. 1994. & Microorganisms and soil aggregates. In:
Pankhurst, C.E., Doube, B.M., Gupta, V.V.S.R. & Grace, P.R.
(eds). Soil Biota. CSIRO Publications, Melbourne, 144-155.
Foster, R.C., Martin, J.K. 1981. In situ analysis of soil components
of biological origin. In: Paul, E.A. & Ladd, J.N. (eds). Soil
Biochemistry, Volume 5. Marcel Dekker, New York, 75-110.
Irfan, T.Y. 1996. Mineralogy, fabric properties and classification
of weathered granites in Hong Kong. Quarterly Journal of
Engineering Geology 29, 5-35.
Keller, W.D. 1976. Scan electron micrographs of kaolins collected
from diverse environments of origin - 2. Clays and Clay
Minerals 24, 201-204.
Kemper, W.D. & Roseneau, R.C. 1986. Aggregate stability and size
distribution. In: Klute, A. (ed). Methods of Soil Analysis, Part
1. Physical and Mineralogical Methods. American Society of
Agronomy, Madison, Wisconsin, 425-442.
Kirk, P.A., Campbell, S.D.G., Fletcher, C.J.N. & Merriman, R.J.
1997. The significance of primary volcanic fabrics and clay
distribution in landslides in Hong Kong. Journal of the
Geological Society, London 154, 1009-1019.
390
Le Bissonais, Y. 1996. Aggregate stability and assessment of soil
crustability and erodibility: I. Theory and methodology.
European Journal of Soil Science 47, 425-437.
Lehmann, J., Kinyangi, J. & Solomon, D. 2007. Organic matter
stabilization in soil microaggregates: implications from spatial
heterogeneity of organic matter contents and carbon forms.
Biogeochemistry 85, 45-57.
McCarthy, J.F., Ilavsky, J., Jastrow, J.D., Mayer, L.M., Perfect, E.
& Zhuang, J. 2008. Protection of organic carbon in soil
microaggregates via restructuring of aggregate porosity and
filling of pores with accumulating organic matter. Geochimica
et Cosmochimica Acta 72, 4725-4744.
Miltner, A., Bombach, P., Schmidt-Brüken, B. & Kästner, M. 2011.
SOM genesis: microbial biomass as a significant source.
Biogeochemistry DOI 10.1007/s10533-011-9658-z.
Oades, J.M. & Waters, A.G. 1991. Aggregate hierarchy in soils.
Australian Journal of Soil Research 29, 815-828.
Reid, J.B. & Goss, M.J. 1981. Effect of living roots of different plant
species on the aggregate stability of two arable soils. Journal of
Soil Science 32, 521-541.
Stoops, G. 2010. Micromorphology as a tool in soil and regolith
studies. In: Stoops, G., Marcelino, V., & Mees, F. (eds).
Interpretation of Micromorphological Features of Soils and
Regoliths. Elsevier, Amsterdam, 1-13.
Stoops, G., Marcelino, V. & Mees, F. (eds). 2010. Interpretation of
Micromorphological Features of Soils and Regoliths. Elsevier,
Amsterdam.
Tisdall, J.M. & Oades, J.M. 1982. Aggregate hierarchy in soils.
Australian Journal of Soil Research 29, 815-828.
Tracy, S.R., Roberts, J.A., Black, C.R., McNeill, A., Davidson, R.
& Mooney, S.J. 2010. The X-factor: visualising undisturbed
root architecture in soils using X-ray computed tomography.
Journal of Experimental Botany 61, 311-313.
Wan, J., Tyliszczak, T. & Tokunaga, T.K. 2007. Organic carbon
distribution, speciation, and elemental correlations within
soil microaggregates: Applications of STXM and NEXAFS
spectroscopy. Geochimica et Cosmochimica Acta 71, 5439-5449.
Weinhold, B.J., Varvel, G.E & Doran, J.W. 2005. Soil quality. In: Hillel,
D. (ed). Encylopedia of Soils in the Environment, Volume 3.
Elsevier, Amsterdam, 349-353.