Remote sensing and GIS approach for spatiotemporal mapping of Ramganga reservoir
Bạn đang xem bản rút gọn của tài liệu. Xem và tải ngay bản đầy đủ của tài liệu tại đây (997.59 KB, 9 trang )
Int.J.Curr.Microbiol.App.Sci (2019) 8(5): 775-783
International Journal of Current Microbiology and Applied Sciences
ISSN: 2319-7706 Volume 8 Number 05 (2019)
Journal homepage:
Original Research Article
/>
Remote Sensing and GIS Approach for Spatiotemporal
Mapping of Ramganga Reservoir
Vaibhav Deoli* and Deepak Kumar
Department of Soil and Water Conservation Engineering, College of Technology, G.B. Pant
University of Agriculture and Technology, Pantnagar, India, 263145
*Corresponding author
ABSTRACT
Keywords
Landsat-8, NDVI,
Ramganga
reservoir, QGIS,
spatiotemporal
Article Info
Accepted:
10 April 2019
Available Online:
10 May 2019
Remote sensing is very useful to collect information about water resource and to manage it
by satellite data. In this paper, study has been carried out for Ramganga reservoir using
Landsat 8 imagery for spatiotemporal mapping. The imagery has been collected from 2013
to 2018 for pre-monsoon and post monsoon season. The reservoir, under study, is
presently used for hydroelectric purpose and irrigation. Landsat-8 images which were
cloud free has been taken for the study. The study is carried out on QGIS platform and
Normalized Difference Vegetation Index (NDVI) has been used to map water spread area
of the reservoir. Results of this study suggested that in pre-monsoon session, maximum
water spread area of 59.81 km2was in 2014 whereas year 2017 has shown minimum water
spread area of 3.18 km2 for pre-monsoon session. In post monsoon session, year 2014
shows maximum water spread area of68.53 km2 the reservoir whereas year 2016 shows
minimum water spread area of 53.97 km2. The average water spread area of the reservoir
in pre-monsoon was 40.01km2 and in post-monsoon was 61.84 km2. The results also
suggested that NDVI could be used with accuracy to extract water features and also the
spread area.
reservoir
management
is
concerned,
monitoring of temporal and spatial variation
of water spread is important for proper
management of irrigation and hydroelectric
generation.
Introduction
Water is an indispensable part of ecosystem
for the sustainability of life. Surface water is a
critical resource in semi-arid areas. Inland
surface water include sea, rivers, ponds, lakes,
reservoirs and canals. It is important to
monitor water bodies for adequate ecosystem
balance and for maintaining climate variation,
hydrological cycle, carbon cycle etc. It is not
only important for human, rather it is equally
important for all other forms of life. As per as
Identification of water bodies are equally
important for agriculture scheduling, flood
estimation, wetland, drought land estimation
of ground water and many more. Accurate
mapping of surface water is significant to
describe its spatial – temporal variation.
775
Int.J.Curr.Microbiol.App.Sci (2019) 8(5): 775-783
Landsat imagery are widely used by
researcher for various studies on earth surface
(Roy et al., 2014; Li et al., 2014; Santos et
al., 2017; Abdelaziz et al., 2018) coupled
with remote sensing and geographical
information system.
and NDWI are out do for spectral signature of
different objects such as vegetation index and
water body classification presented in the
satellite image. Kavyashree M.P (2016) used
NDVI to detect wetland mapping and change
detection. They compare Landsat images of
1998 with LISS III images of 2008-09 to
detect the changes in land cover and wetland
changes in that area. Yang Shao et al., (2016)
used NDVI to detect land cover classification.
Tri Dev Acharya et al., (2016) used Landsat 8
imagery to detect change in water using a J48
decision tree which is an open source and
identify water bodies using reflectance band
of Landsat-8 images.
Since, the resolution of Landsat-8 is more
than that of Landsat-7, hence for natural
resource estimation and management, it is
better to use the formal (Jarchow et al., 2018;
Baumann et al., 2018).
Remote sensing technology is used to monitor
water resources also. Remote sensing
application in water resource includes change
in surface water resource, water quality
assessment
and
monitoring
flood
hazard/damage assessment and management
and water-borne disease epidemiology.
The objective of present study is to map
yearly change in Ramganga reservoir of
Uttarakhand. This study include detecting
changes in water spread area of Ramganga
reservoir in pre-monsoon and post-monsoon
period by incorporating NDVI index on
Landsat 8 imagery using QGIS platform for 5
years from 2013 to 2018.
Till now, there is number of technique for
water extraction using satellite imagery.
Among these, spectral index technique has
been widely using because it is easy to use. In
spectral technique, normalized difference
vegetation index (NDVI), normalized
difference water index (NDWI), water ratio
index (WRI), are mostly used indexes.
Materials and Methods
Study location and data collection
The study was conducted for Ramganga
reservoir. It has latitude of 29033’ N and
longitude of 78045’ E located in Cordate
Nation Park range near Ramnagar city of
Uttarakhand state of India (Fig. 1). The study
area is located in Tarai region of Uttarakhand
in the foothills of Himalaya with an elevation
of 347m above mean sea level.
Change detection in water bodies has been
examined extensively by different researchers
from all over the words. Ross S. Lunetta et
al., (2006) detected land cover changes by
NDVI index. Authors suggested NDVI index
with no cost Landsat data provide high quality
continuous time series data to monitoring land
cover change detection and monitoring water
bodies. Bhandari et al., (2012) used
normalized difference vegetation index
(NDVI) for feature extraction. They suggest
NDVI is a highly useful to detect features in
earth surface. A. K. Bhandari (2014)
successfully worked on improved feature
extraction by satellite imagery using NDVI
and NDWI index. They suggested that NDVI
The temporal Landsat-8 imagery of this
region has been taken from Earth Explorer
website. Landsat-8 imagery which was cloud
free has been taken from December 2013 to
June 2018. For every year, two raster images
have been taken, one for pre- monsoon and
another for post monsoon. In pre- monsoon,
raster images of the study area have been
776
Int.J.Curr.Microbiol.App.Sci (2019) 8(5): 775-783
taken in month of May or June and for postmonsoon session images, it has been taken in
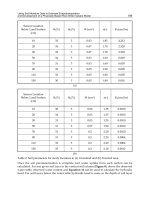
month of November or December. Table 1
shows acquisition date of Landsat-8 imagery
taken for this study. The specification of
collected Landsat-8 imagery is given in Table
2.
Results and Discussion
In this section, the results obtained for spatial
variation of water spread area for the duration
from 2013 to 2018 of Ramganga reservoir has
been discussed. The results of the spatial
variability in reservoir water spread area has
been studied both for pre monsoon as well as
post monsoon period. Since NDVI is one of
the well-established index to extract features
on the earth, the same has been used for water
body extraction.
NDVI index for mapping water body
For mapping of water body, different ratios
can be used for raster calculation to extract
information. In this study, NDVI technique is
used to extract reservoir. Firstly, radiometric
calibration was performed to converting
images in different Landsat-8 bands. After
pre-processing, the images were used to
calculate NDVI, which were than reclassified
based on threshold for water and non-water.
A model was developed in Q-GIS software
for change detection as shown in Figure 2.
The mapping of water body for pre monsoon
season using NDVI index has been shown in
Figure 3. Since the images of pre monsoon
months of 2013 has full of cloud, thus, for
2013, the results of the same has not been
shown in Figure 3. From this figure, it might
be suggested that the water spread area during
the pre-monsoon period from 2014 to 2017
has decreased. Table 3 suggested that the
decrease in water spread area from 2014 to
2015 was 3.11 km2, while the decrease in
water spread for 2016 was further reduced to
36.14 Km2 as compared to 2014. The lowest
water spread area for the study period was
observed during 2017. During 2017, the water
spread was only 3.18 km2. This might be due
to less rainfall in 2017 as compared to other
years under study.
Normalized Difference Vegetation Index
(NDVI) is a technique used to estimate land
cover area, built-up area, water cover area,
open area, forest by combination of few band
of satellite imagery.
The value of NDVI varies from -1 to +1.
Generally negative values including zero
value of NDVI represent water cover area and
positive values of NDVI stand for non-water
cover area. In general, NDVI is calculated as
per Equation 1.
The spatial water spread mapping of postmonsoon period is shown in Figure 4. The
estimated water spread area of the same has
also been numerically shown in Table 3. The
calculated surface area of the reservoir in post
monsoon session were 67.01 km2, 68.53 km2,
59 km2, 53.97 km2 and 60.67 km2 for years
2013, 2014, 2015, 2016 and 2017
respectively. From the post monsoonal results
of Figure 2 and Table 1, it might be suggested
that the water spread area was lowest during
2016 and highest during 2014. The variation
in water spread area might be due to weak
monsoon in that period and also due to excess
… (1)
Where, NIR stand for Near Infra-Red; RED
represent the red spectrum. In the present
study, Landsat-8 imagery has been used, and
thus, band 5 represents NIR and Band 4
represents RED. Thus, Equation 2 has been
used for NDVI estimation in the present
study.
… (2)
777
Int.J.Curr.Microbiol.App.Sci (2019) 8(5): 775-783
demand of reservoir water in downstream of
the reservoir.
minimum water spread area. In summer
session the calculated surface area of the
reservoir were 59.81 km2, 56.7 km2, 23.67
km2, 3.18 km2 and 56.7 km2 for years 2014,
2015, 2016, 2017 and 2018 respectively. In
summer year 2014 shows maximum water
surface area where as in year 2017 water
surface area was very low.
From result based on satellite Landsat-8
imagery it is also clear that in both, premonsoon and post monsoon the average water
surface area of the Ramganga reservoir is
decreasing. Year 2014 shows maximum water
spread area where as in year 2016 shows
Table.1 Acquisition dates of Landsat 8 imagery for the study period
Year
2013
2014
2015
2016
2017
2018
Pre-monsoon
10-06-2014
28-05-2015
14-05-2016
02-06-2017
20-05-2018
Post-monsoon
16-12-2013
03-12-2014
22-12-2015
24-12-2016
11-12-2017
12-11-2018
Table.2 Specification of Landsat-8 Imagery
Band
1
2
3
4
5
6
7
8
9
10
11
Description
Violet-Deep Blue
Blue
Green
Red
Near Infrared
Shortwave Infrared
Shortwave Infrared
Panchromatic
Cirrus Clouds
Thermal Infrared
Thermal Infrared
Wavelength(micro meters)
0.43-0.45
0.45-0.51
0.53-0.59
0.64-0.67
0.85-0.88
1.57-1.65
2.11-2.29
0.50-0.68
1.36-1.38
10.62-11.19
11.50-12.51
Resolution(meters)
30
30
30
30
30
30
30
15
30
30
30
Table.3 Calculated water spread area (km-2) for the study period for Ramganga reservoir
Year
2013
2014
2015
2016
2017
2018
Pre-monsoon (km2)
-59.81
56.7
23.67
3.18
56.7
778
Post-monsoon (km2)
67.01
68.53
59
53.97
60.67
61.1
Int.J.Curr.Microbiol.App.Sci (2019) 8(5): 775-783
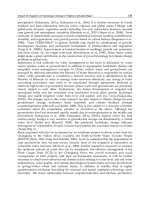
Fig.1 Location of Ramganga Reservoir
Fig.2 Flow chart for water body mapping using QGIS
779
Int.J.Curr.Microbiol.App.Sci (2019) 8(5): 775-783
Fig.3 Water spread mapping of Ramganga reservoir during pre-monsoon period
2015
2014
2016
2017
2018
780
Int.J.Curr.Microbiol.App.Sci (2019) 8(5): 775-783
Fig.4 Water spread mapping of Ramganga reservoir during Post-monsoon period
2013
2014
2
2015
016
2017
2018
781
Int.J.Curr.Microbiol.App.Sci (2019) 8(5): 775-783
In conclusion, in this study, unsupervised
index method was used to detect the change
of Ramganga Reservoir in Ramnagar city
using Landsat-8 data of 5 years from 2013 to
2018. For mapping of water body, NDVI has
been used and the same has been incorporated
in digital image to find the water spread area
of Ram Ganga reservoir using QGIS. It could
be concluded from the results that during the
study period, the water spread area was
maximum during 2014 for both pre and post
monsoon. For pre-monsoon, the water spread
area was 58.81 km2, while for post-monsoon,
the water spread area was 68.53 km2. The
results suggested that NDVI could be used
with accuracy to extract water features and
also the spread area.
sensing of environment, 216, 201-211.
Jarchow, C. J., Didan, K., Barreto-Muñoz, A.,
Nagler, P. L., and Glenn, E. P. (2018).
Application and Comparison of the
MODIS-Derived Enhanced Vegetation
Index to VIIRS, Landsat 5 TM and
Landsat 8 OLI Platforms: A Case Study
in the Arid Colorado River Delta,
Mexico. Sensors, 18(5), 1546.
Kavyashree, M., and Ramesh, H. (2016).
Wetland mapping and change detection
using remote sensing and GIS.
International Journal of Engineering
Science, 6(8), 2356.
Li, P., Jiang, L., and Feng, Z. (2014). Crosscomparison of vegetation indices
derived from Landsat-7 enhanced
thematic mapper plus (ETM+) and
Landsat-8 operational land imager
(OLI) sensors. Remote Sensing, 6(1),
310-329.
Lunetta, R. S., Knight, J. F., Ediriwickrema,
J., Lyon, J. G., and Worthy, L. D.
(2006). Land-cover change detection
using multi-temporal MODIS NDVI
data. Remote sensing of environment,
105(2), 142-154.
Roy, D. P., Wulder, M. A., Loveland, T. R.,
Woodcock, C. E., Allen, R. G.,
Anderson, M. C., and Scambos, T. A.
(2014). Landsat-8: Science and product
vision for terrestrial global change
research.
Remote
sensing
of
Environment, 145, 154-172.
Santos, M. M., Machado, I. E. S., Carvalho,
E. V., Viola, M. R., and Giongo, M.
(2017). Estimation of forest parameters
in Cerrado area from OLI Landsat 8
sensor. Floresta, 47(1), 75-83.
Shao, Y., Lunetta, R. S., Wheeler, B., Iiames,
J. S., and Campbell, J. B. (2016). An
evaluation of time-series smoothing
algorithms for land-cover classifications
using MODIS-NDVI multi-temporal
data. Remote Sensing of Environment,
174, 258-265.
References
Abdelaziz, R., El-Rahman, Y. A., and
Wilhelm, S. (2018). Landsat-8 data for
chromite prospecting in the Logar
Massif, Afghanistan. Heliyon, 4(2),
e00542.
Acharya, T. D., Lee, D. H., Yang, I. T., and
Lee, J. K. (2016). Identification of water
bodies in a Landsat 8 OLI image using a
j48 decision tree. Sensors, 16(7), 1075.
Bhandari, A. K., Kumar, A., and Singh, G. K.
(2012). Feature extraction using
Normalized Difference Vegetation
Index (NDVI): A case study of Jabalpur
city. Procedia technology, 6, 612-621.
Bhandari, A. K., Kumar, A., and Singh, G. K.
(2015). Improved feature extraction
scheme for satellite images using NDVI
and NDWI technique based on DWT
and SVD. Arabian Journal of
Geosciences, 8(9), 6949-6966.
Baumann, M., Levers, C., Macchi, L., Bluhm,
H., Waske, B., Gasparri, N. I., and
Kuemmerle, T. (2018). Mapping
continuous fields of tree and shrub
cover across the Gran Chaco using
Landsat 8 and Sentinel-1 data. Remote
782
Int.J.Curr.Microbiol.App.Sci (2019) 8(5): 775-783
Xu, D., and Guo, X. (2014). Compare NDVI
extracted from Landsat 8 imagery with
that from Landsat 7 imagery. American
Journal of Remote Sensing, 2(2), 10-14.
How to cite this article:
Vaibhav Deoli and Deepak Kumar. 2019. Remote Sensing and GIS Approach for
Spatiotemporal Mapping of Ramganga Reservoir. Int.J.Curr.Microbiol.App.Sci. 8(05): 775783. doi: />
783