Remote sensing and Gis based mapping of clay soilsa case study of Patna district, Bihar, India
Bạn đang xem bản rút gọn của tài liệu. Xem và tải ngay bản đầy đủ của tài liệu tại đây (694.15 KB, 9 trang )
Int.J.Curr.Microbiol.App.Sci (2019) 8(4): 346-354
International Journal of Current Microbiology and Applied Sciences
ISSN: 2319-7706 Volume 8 Number 04 (2019)
Journal homepage:
Original Research Article
/>
Remote Sensing and GIS based Mapping of Clay SoilsA Case Study of Patna District, Bihar, India
Binod Kumar Vimal1, Sunil Kumar1*, Amit Kumar Pradhan1, Ragini Kumari1,
Hena Parveen1 and Sanjeev Kumar Gupta2
1
Department of Soil Science and Agricultural Chemistry, Bihar Agricultural University,
Sabour-813210, Bhagalpur, Bihar, India
2
Department of Agronomy, Bihar Agricultural University, Sabour-813210, Bhagalpur,
Bihar, India
*Corresponding author
ABSTRACT
Keywords
Clay soils, NDVI,
NIR band, Tal and
RS-GIS
Article Info
Accepted:
04 March 2019
Available Online:
10 April 2019
Developed model is based on digital image processing techniques under RS-GIS domain,
in which conversion of Intensity, Hue and Saturation to RGB image of SWIR, NIR and red
spectral bands has been applied for the signature capture of clay soils. To achieve this
target, spectral enhancement process was initiated by using of AWiFS data (May, 2015).
Clear cut demarcation of clay soil patches from surrounding was observed in blue tone of
the converted RGB image. Out of the total geographical area, the maximum coverage of
clay soils was observed in Mokama (12.79%) followed by Pandarakh (11.12%), Ghoswari
(10.48%), Pali (10.46%) and Bakhtiyarpur (9.90%) blocks. However, in context of physicchemical status of soils, the clay content varied from 57 to 66%, soil pH neutral to slightly
alkaline (7.02.-8.62), EC normal, available nitrogen low, available phosphate medium and
available potash medium to high were recorded. Research findings may be helpful for the
confirmation of heavy texture soils under low land topography of Bihar.
for the sustainability of agriculture practices.
(Manchanda et al., 2002) reported that survey
data provided adequate information in terms
of land forms; natural vegetation as well as
characteristics of soils which can be utilized
for
management
of
land
resource
management. In case of soil resource
mapping, mid-IR soil spectra has a stronger
signal that is built in portable instrumentation
and can be easily used in the field and direct
links can be made with hyper-spectral remote
Introduction
The soils are valuable natural resources which
are directly associated with agricultural
production. In low land ecology of river
Ganga basins, clay soils are locally known as
Tal, and Chour may be perceived. Tree less
ecology and Rabi cropping system are the
general features found in heavy clay soils. In
this context, soil survey towards agricultural
land use planning is an important parameter
346
Int.J.Curr.Microbiol.App.Sci (2019) 8(4): 346-354
sensing (Gomez et al.,2008). Similarly,
(Kristof et al., 1980) reported that the spectral
reflectance response is the result of numerous
soil properties and that the spectrally-derived
maps may delineate important information
about surface soil conditions. Viscarra et al.,
(2009) reported that iron oxides, clay minerals
and soil colour can be measured directly from
the spectra which are governed by incident or
reflected energy. Spectral response based
technologies like remote sensing, allowed the
data discrimination between crop residues and
soil, distinguishing iron oxides, iron
hydroxides and iron sulphates, and
distinguishing between clay and sulphate
mineral species (Hubbard et al., 2003). In
order to obtain a more accurate interpretation
using satellite data, several empirical
radiometric indices have been proposed, such
as, a „redness index‟, a „colour index‟ and a
„texture index‟ (Pouget et al.,1990). Present
day, signature capture of perfect tone of the
soils or spectral responses of the target from
satellite images is a researchable issue, and
keeping this in view; the main objective of the
present study was to capture the perfect tone
of clay soils by using conversion of Intensity
Hue and Saturation to RGB under spectral
enhancement techniques of satellite data for
Patna district of Bihar.
extracted more accurately by visual
interpretation than by digital classification.
Field survey was done during the month of
February, 2015 and randomly ten locations
that was directly associated with heavy clay
soil patches (>65% clay) were selected in
Maranchi Tal with GPS reading for the
collection of soil samples and their textural
analysis, visual interpretation and image
enhancement of the satellite image. Remotely
sensed data require certain amount of field
observation called “ground truth” in order to
convert it into meaningful information. Such
work involved visiting a number of test sites,
usually taking the satellite data and its derived
data. Different locations of Ghoswari, Barh,
Bakhatiyarpur and Paliganj blocks were
selected for the validation of results. Over this
concern, GPS receiver and derived data with
respect to confirm the clay soils by using
developed tone, interpreted digital values and
analysed report of soils samples were used.
Topographical maps, documented soil survey
reports and ancillary data were also used for
reference purposes during validation of
research findings.IRS, AWiFS (2015) data
having four spectral bands; green (0.520.59μm), red (0.62-0.68 μm), Near Infra Red
(0.77-0.86μm) and Short Wave Infra Red
(1.55-1.70μm) and having 56 m spatial
resolution (Singh et al., 2009) was used for
the visual interpretation and spectral
enhancement towards signature capture of
clay soils. Geospatial software viz. TNT Mips,
Erdas Imagine, ENVI 5.1 and Arc GIS10.1
were used for digital image processing and
mapping.
Materials and Methods
The Patna district falls between 25° 12‟ to 25
°44' N latitudes and 84° 40‟ to 86° 04' E
longitudes in Bihar. As reported in the
administrative atlas of Bihar (2001), the
district encompasses a total geographical area
of 3130 km2 and is divided into 23 blocks.
Due to well concentration of heavy textured
soils in Maranchi Tal, Mokameh block was
selected for field survey, soil sampling and
visual interpretation of the satellite image
with respect to appearance of clay (Tal)
soils.(Zhang et al., 2014) reported that
mapping of land use/land cover pattern are
The Normalized Difference Vegetation Index
(NDVI) was used to measure the vegetative
cover on the land surface over wide areas and
confirmation of the tree less ecology under
clay soils. The NDVI, introduced in the early
seventies by (Rouse et al., 1973) is expressed
as the difference between the near infrared
(NIR) and red bands (RED) normalized by the
347
Int.J.Curr.Microbiol.App.Sci (2019) 8(4): 346-354
sum of those bands. Normalised Difference
Vegetation Index (NDVI) = (NIR - Red) /
(NIR + Red) where R-NIR is the reflectance
in the Near Infra Red (NIR) and G-RED is the
reflectance in the RED part of the
electromagnetic
spectrum.
Mechanical
analysis of collected soil samples from clay
soil environment was done using standard
procedure. The mechanical analysis of soil
separates followed by International pipette
method. The pH and EC was analyzed as per
the standard procedure (Jackson, 1973). The
available nitrogen, P and the available K were
extracted by using Normal ammonium acetate
and the content was determined by aspirating
the extract into flame photometer. Details of
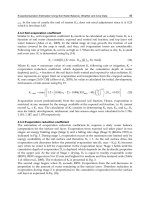
methodology towards visual interpretation
and spectral enhancement processes are being
summarised in given flow chart (Fig. 1).
saturation than the solid crimson. RGB+IHS
yielded values provided very high accuracies
for the calculation of the texture of the objects
(Laliberte and Rango,2008),means the
spectral information of the target is separated
into the hue and saturation components under
three-color composite image from the original
image data using Multispectral transformation
(Carper et al.,1990)..When light hits the
object, some wavelengths (energy) are
reflected and received by satellite sensors
means if the radiation arriving at the sensor, is
measured at many wavelengths and that
variation of spectrum can be used to identify
the materials in a scene and discriminate
among different classes of material (Gary et
al.,2003). Randomly ten soil samples with
GPS reading (latitudes and longitudes) from
well known patches of clay soils of Maranchi,
Mokameh and Bakhtiarpur tal were taken for
the analysis of soil texture, pH and EC.
Similarly, False Colour Composite image
(IRS- AWiFS) for the same locations was also
interpreted for the spectral analysis of clay
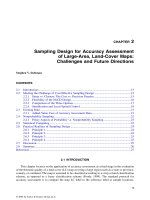
soil patches (Fig. 3). Digital values having
spectral graphs of layer stacked MIR, NIR;
red and green bands corresponding to
comparative study of the clay soils, sand
patches and water bodies were analysed (Fig.
4). As per analyzed reflectance curve,
reflectance of clay soils comparison to water
bodies was high in MIR and NIR bands but
low in case of sand patch (Fig. 4). In both
cases, distinction in spectral responses
provided a clue for the separation of clay soils
from surrounding. Based on interpretation of
NDVI, appearance of vegetation (Range <0.1)
was very low under clay soils that indicated
the tree less ecology (Fig. 5). Spectral
enhancement technique was applied for the
conversion of IHS to RGB by using digital
image processing software and finally natural
blue tone (distinct result of clay soil patches)
was came out (Fig. 5).
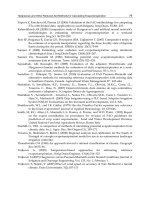
Results and Discussion
Clay soils appeared dark bluish and healthy
vegetation red in false colour composite
(FCC) image of NIR, red and green bands
(Fig. 2). Healthy vegetation appears green in
layer stacked blue, green and red bands due to
high reflectance of green energy comparison
to blue and red (Lillesand et al.,2005), means
red objects appeared red in same layer stacked
bands. Over this concern, variation of tone in
different bands provided a clue for the
signature capture of the target and conversion
of Intensity, Hue and Saturation (IHS) to Red,
Green and Blue (RGB) image by using of
MIR, NIR and red bands was applied to trace
out the distinct tone (blue) for those pixels
that were directly associated with clay soil
patches (Fig. 5). RGB colours and their mixed
components in the image are associated with
Intensity Hue-Saturation (IHS) system where
Intensity relates to the total brightness of a
colour, Hue refers to the dominant or average
wavelength of light contributing to a colour
and Saturation specifies the purity of colour
relative to gray e.g. solid pink has low
348
Int.J.Curr.Microbiol.App.Sci (2019) 8(4): 346-354
Table.1 The physico-chemical properties of clay soils
S.No.
Latitudes
Longitudes
Observed data
(Based on visual interpretation of the satellite data and textural analysis of the soil samples)
Sand Silt Clay Soil Texture
pH
EC
Avail. N Avail.P2O5
Avail.K2O
class
(1:2.5)
(dSm-1)
(Kg/ha)
(Kg/ha)
(Kg/ha)
(%)
250 19' 15''
250 20' 09''
250 21' 08''
250 21' 51''
25022' 38''
250 22' 65''
250 24' 46''
250 28'36''
250 25 '01''
250 23 '40''
850 58‟ 56”
850 58‟ 46”
850 57‟ 55”
850 57‟ 28”
850 22‟ 10”
850 52‟ 22”
850 51‟ 13”
850 30‟ 27”
850 49‟ 09”
850 49‟ 28”
9.21
9.66
8.97
9.89
10.18
9.34
9.24
10.19
9.27
9.61
65.16
Clayey
7.79
0.18
150.52
36.00
369.01
63.71
Clayey
8.16
0.23
163.07
38.00
327.22
65.94
Clayey
7.58
0.17
175.62
42.99
324.56
62.96
Clayey
8.16
0.21
138.00
48.00
381.44
62.01
Clayey
8.21
0.23
163.07
35.00
286.83
64.74
Clayey
7.89
0.19
150.52
29.00
341.36
65.08
Clayey
7.81
0.18
163.07
44.27
369.48
61.97
Clayey
8.62
0.24
150.52
34.00
357.06
64.95
Clayey
7.84
0.18
175.62
44.46
296.19
63.87
Clayey
8.12
0.20
175.62
46.05
316.28
Ground truth data
(Based on conversion of IHS to RGB image of the satellite data, prediction of distinct tone and textural analysis of the soil samples)
250 26' 18''
850 30‟ 59”
7.43 31.32 61.25
Clayey
7.21
0.15
175.62
32.04
301.05
1
0
0
25 26'34''
85 31‟ 16”
5.24 32.32 62.44
Clayey
7.56
0.17
188.16
33.82
309.15
2
0
0
25 26' 31''
85 30‟ 40”
9.42 30.78 59.80
Clayey
7.02
0.15
163.07
38.26
319.95
3
0
0
25 25'47''
85 27‟ 32”
7.97 32.84 59.19
Clayey
7.74
0.18
150.52
42.72
295.65
4
0
0
25 27' 16''
85 26‟ 59”
8.21 33.50 58.29
Clayey
7.97
0.19
163.07
31.15
287.55
5
0
0
25 17' 43"
84 48‟ 12”
6.54 31.61 61.85
Clayey
7.31
0.16
188.16
25.81
291.6
6
0
0
25 17' 59"
84 47‟ 48”
8.60 31.38 60.02
Clayey
7.23
0.16
163.07
39.40
322.65
7
0
0
25 19' 54"
84 51‟ 06”
8.22 33.53 58.25
Clayey
7.98
0.21
175.62
30.26
301.05
8
0
0
25 21' 01"
84 49‟ 13” 11.24 31.47 57.29
Clayey
7.26
0.16
138.00
39.57
322.65
9
0
0
25 21' 07"
84 48‟ 53”
7.75 32.21 60.04
Clayey
7.52
0.17
150.52
40.98
332.10
10
1
2
3
4
5
6
7
8
9
10
25.63
26.63
25.09
27.15
27.81
25.92
25.69
27.83
25.77
26.52
349
Int.J.Curr.Microbiol.App.Sci (2019) 8(4): 346-354
Table.2 The percentage distribution of clay soils under different blocks in Patna district
Different CD blocks under
Patna district of Bihar
Maner
Dinapur-Cum-Khagaul
Patna – Rural
Sampat
Phulwari
Bihta
Naubatpur
Bikram
Dulhin Bazar
Paliganj
Masaurhi
Dhanarua
Punpun
Fatuha
Daniawan
Khusrupur
Bakhtiyarpur
Athmalgola
Belchhi
Barh
Pandarakh
Ghoswari
Mokama
Total
Geog. Area
(km2)
170.7
124.46
156.66
65.35
106.47
193.92
167.74
148.15
110.68
237.75
202.43
185.55
128.75
126.36
65.1
63.39
196.83
40.25
68.67
109.59
204.89
139.83
191.32
3204.84
Area under clay soil
patches(km2)
44.25
2.75
3.14
8.54
7.43
8.01
36.38
12.78
23.94
66.04
30.02
14.54
26.4
11.09
7.49
3.71
62.51
7.72
8.61
28.85
70.23
66.17
80.78
631.38
Percentage of clay
soil patches
7.01
0.44
0.50
1.35
1.18
1.27
5.76
2.02
3.79
10.46
4.75
2.30
4.18
1.76
1.19
0.59
9.90
1.22
1.36
4.57
11.12
10.48
12.79
100.00
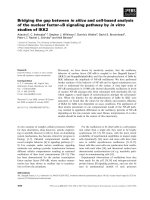
Graph.1 Percentage of sand, silt and clay in observed and predicted soil samples
350
Int.J.Curr.Microbiol.App.Sci (2019) 8(4): 346-354
Fig.1 Flow chart showing detailed methodology
Fig.2 False Colour Composite image of Patna district
351
Int.J.Curr.Microbiol.App.Sci (2019) 8(4): 346-354
Fig.3 Spectral graph of heavy clay soils, sand patches and water bodies
Fig.4 Tree less ecology under heavy clay soils
Fig.5 Signature of clay soils in blue tone
352
Int.J.Curr.Microbiol.App.Sci (2019) 8(4): 346-354
Fig.6 Geographical area of clay soils
Based on distinct blue tone that was associated
with signature of clay soils in Maranchi,
Mokameh and Bakhtiarpur Tal, randomly ten
soils samples with GPS reading from different
locations of Paliganj block were collected to
cross check the availability of clay soils in new
locations. In continuation of cross checking the
tone and validation the data was plotted (Table
1). (Weber and Dunno, 2001) reported that
displayed as a map of classified values or
results may be helpful for resource managers or
scientists for the evaluation the landscape in an
accurate and cost effective manner. Soil texture,
Soil pH and EC were also analyzed in the
laboratory of the cross checked data and their
results were summarized for their comparative
study. Result towards percentage of sand, silt
and clay in both cases was demonstrated on bar
diagram (Graph 1). Blue tone (fallen under clay
soils) was digitized in GIS domain for the
calculation of geographical area (Fig. 6). Based
on research finding, only 631.38 km2 (19.7%)
of the total geographical area (3204.84km2) was
traced out under clay soils which are neutral to
slightly alkaline range of soil pH and
percentage of total geographical area under clay
soil patches was marked in Mokameh (12.79%)
consequently Pandarakh (11.12%), Ghoswari
(10.48%), Pali (10.46%) and Bakhtiyarpur
(9.90%) blocks. However, low geographical
coverage of clay soil patches was traced out in
Patna rural (0.50%), Danapur-Khagaul (0.44%),
Khusrupur (0.59%), Daniyawan (1.19%) and
Bihta (1.27%) blocks (Table 2).
In conclusion, model is based on digital image
processing
technique,
whereas
spectral
enhancement process by using of AWiFS data
was initiated to fulfil the objective. Converted
RGB image indicated the clear cut demarcation
of clay soil patches from surrounding in blue
tone which was governed by spectral bands.
Research findings may be helpful for clay soil
inventory and mapping under low land
topography.
Acknowledgements
Department of Science and Technology, New
Delhi is thankfully acknowledged for the
financial assistance of the research project
(SB/EMEQ-173/2013). Chairman, Department
of Soil Science & Agricultural Chemistry,
BAC, Sabour is acknowledged for his valuable
suggestions, providing laboratory facilities and
B.A.U. communication number 584/2019.
References
Carper, W.J., Lillesand, T.M. and Kiefer, R.W.
1990. The Use of Intensity-HueSaturation Transformations for Merging
SPOT Panchromatic and Multispectral
Image
Data,
Photo-grammetric
353
Int.J.Curr.Microbiol.App.Sci (2019) 8(4): 346-354
Engineering Remote Sensing 56(4): 459467
Gary Shaw, A., and Hsiao-hua Burke, K. 2003.
Spectral Imaging for Remote Sensing,
Lincon Laboratory Journal, Volume 14
Gomez Viscarra, C.R., Rossel, A. and Mc
Bratney, A.B. 2008. Soil organic carbon
prediction by hyper-spectral remote
sensing and field vis–NIR spectroscopy:
an Australian case study. Geoderma 146,
403–411.
Hubbard, B.E., Crowle, J.K. and Zimbelman,
D.R. 2003. Comparative alteration
mineral mapping using visible to
shortwave
infrared
(0.4-2.4
μm)
Hyperion, ALI, and ASTER imagery,
IEEE, Transactions on geo science and
remote sensing, 41(6 PART I), 14011410.
Jackson, M.L. 1973. Soil Chemical Analysis,
Prentice- hall of India Pvt. Ltd, New
Delhi, pp.40.
Kristof, S.J., Baumgardner, M.F., Weismiller,
K.A. and Davis, S. 1980. Application of
multispectral reflectance studies of soils.
In: Proceedings of 6th Annual
Symposium: Machinery Processing of
Remotely Sensed Data and Soil
Informational Systems, Remote Sensing
and Soil Survey, 52–62. West Laffayette,
Indiana.
Laliberte, S.A. and Rango, A. 2008. Monitoring
with Unmanned Aircraft Imagery
Incorporation of Texture, Intensity, Hue,
and Saturation for Range land, New
Mexico State University, USDA ARS,
GEOBIA, Calgary, AB, Aug 6-7.
Lillesand, M., Ralph, T., Kiefer, W., Jonathan,
W. and Chipman. 2005. Remote Sensing
and Image Interpretation, Fifth edition.
Wiley, New York.
Manchanda, M.L., Mand, K. and Tiwari, A.K.
2002. Soil survey and mapping using
remote sensing, Tropical Ecology, 43; 6174.
Pouget, J.M., Madeira, E., Floch, L. and Kamal.
S. 1990. Caracteristiques spectrales des
surfaces sableuses de la region cot&e
Nord-Ouest de I‟Egypte: Application aux
don&es satellitaires SPOT. In: 2eme
Joum
Ces
de
T&detection:
Caracterisation et suivi des milieux
terrestres en regions arides et tropicales.
4-6/12/1990. Ed. ORSTOM, Collection
Colloques et Seminaires, Paris, pp.27-38.
Rouse, J.W. 1973. Monitoring vegetation
systems in the Great Plains with ERTS. In
Third ERTS, Symposium.
Singh, R.B., Mahtab, A. and Ajai. 2009. Target
reparability analysis for resourcesat1AWiFS data. Journal of Geomatics, 19:
19-22.
Viscarra, R.A., Rossel, S., Cattle, A. and Fouad,
Y.O. 2009. In situ measurements of soil
colour, mineral composition and clay
content by vis–NIR spectroscopy.
Geoderma, 150: 253–266
Weber, M.R. and Dunno, G.A. 2001. Riparian
vegetation mapping and image processing
techniques, Hopi Indian reservation,
Arizona, Photogrammetric Engineering
and remote sensing, 67(2): 179-186
Zhang, Z., Wang, X., Zhao, X., Liu, B., Yi, L.,
Zuo, L., Wen, Q., Liu, F., Xu, J. and Hu,
S. 2014. A 2010 update of national land
use/cover database of china at 1:100000
scale using medium spatial resolution
satellite images. Remote Sensing of
Environment, 149(0): 142 – 154.
How to cite this article:
Binod Kumar Vimal, Sunil Kumar, Amit Kumar Pradhan, Ragini Kumari, Hena Parveen and
Sanjeev Kumar Gupta. 2019. Remote Sensing and GIS based Mapping of Clay Soils-A Case Study
of Patna District, Bihar, India. Int.J.Curr.Microbiol.App.Sci. 8(04): 346-354.
doi: />
354