Geophysical characterization of an alluvial plain: Case of Karfiguela in Burkina Faso
Bạn đang xem bản rút gọn của tài liệu. Xem và tải ngay bản đầy đủ của tài liệu tại đây (1.26 MB, 17 trang )
Int.J.Curr.Microbiol.App.Sci (2019) 8(1): 725-741
International Journal of Current Microbiology and Applied Sciences
ISSN: 2319-7706 Volume 8 Number 01 (2019)
Journal homepage:
Original Research Article
/>
Geophysical Characterization of an Alluvial Plain: Case of Karfiguela in
Burkina Faso
Nestor Fiacre Compaore and Samuel Nakolendousse*
Department of Earth Sciences, Georesources Laboratory, Ouaga1 University, Burkina Faso
*Corresponding author
ABSTRACT
Keywords
Characterization,
Alluvial plain,
Electrical
tomography,
Hydraulic
conductivity,
Karfiguela
floodplain
(Banfora), Burkina
faso (West Africa)
Article Info
Accepted:
07 December 2018
Available Online:
10 January 2019
This study was conducted on the alluvial plain of Karfiguela in the extreme southwest part
of Burkina Faso as part of the Support Program for Irrigation Development (PADI). The
main objectives of this study are: (1) the identification and delineation of the alluvial plain
(2) identification and characterization of the geological nature of the of the lithology of the
plain (3) identification and characterization of the average power of the plain and (4) the
determination of the hydrodynamic properties and directions and flow direction of
groundwater in the alluvial plain of Karfiguela. Concerning the characterization of
materials, two investigative techniques were used for this study: (i) the electrical resistivity
tomography (ERT), and (ii) the auger surveys (micro-drilling). The first technique allowed
us to obtain resistivity distribution and to deduct from the nature of geological formations
in place as well as their thicknesses. The second technique leads to a direct observation of
the tabulations and the granulometry of the different layers that constitute the plain on a
given depth. All methods lead to the same results overall, with the only difference that the
second is much more accurate compared to the stratigraphy, and to the real nature of the
geological layers. The results of these studies will enable to identify areas where
accessibility to shallow aquifers is readily available to mobilize groundwater resources to
carry out dry season cropping.
Introduction
The management of water resources is one of
the fundamental issues of the world water
problem. Indeed, the increasing complexity of
the mobilization systems, the use of water
resources linked to the increase of the levies
and the rejections due to the demographic
growth, the economic development, threaten
more and more the quantity and the quality of
this vital resource (Dezetter, 1998) (1). In
Burkina Faso, the assessment of renewable
water resources is estimated at 852 m3 / year /
inhabitant while the scarcity threshold is
estimated at 1000 m3 / year / inhabitant
(DGH, 2001) (2). Burkina is therefore in a
deficit situation with regards to management
of water resources. Of all water-consuming
activities, agriculture accounts for 64% of
Burkina Faso's total water demand, and much
of this demand is met from surface water,
which is threatened by the fast drying up in
the dry season (DGH, 2001) (2).
Our study is part of the activities carried out
725
Int.J.Curr.Microbiol.App.Sci (2019) 8(1): 725-741
by the PADI Project BF101 "Sustainable
Management of Groundwater for Irrigated
Agriculture".
This is indeed a quantitative assessment of the
groundwater resources of the alluvial plain of
Karfiguelathanks to the assessment of the
aquifer through the characterization of
materials and the estimate of its flowpower.
Study area
The study area is the alluvial plain of
Karfiguela. It is located in the extreme southwest of Burkina Faso in the province of
Comoe whose administrative center is Banfora
and in the Cascades region (Figure 1). This
plain is located approximately between 4 °
36'34 "and 4 ° 49'19" west longitude and
between 10 ° 28'36 "and 10 ° 43'20" north
latitude (NESTOR, 2017) (3). The plain has
an area of about 4580.
The Karfiguela plain is characterized by five
(5) geological formations (Figure 2): KawaraSindou
Formation,
Lower
Sandstone
Formation, Shale and Volcano-Sediment
Formation, Granodiorite Formation, and
Tonalitic group.
The sandstones of Kawara-Sindou (60 to
350 m thick) rest on the lower sandstone or
directly on the basement. It is a formation
consisting of very fine quartzite sandstone at
the base and coarse sandstone above (Figure
6). It is characterized by an oblique
stratigraphy and the presence of abundant
wave wrinkles (Hugot, 2002) (4) (Fig. 3).
The lower sandstones (50 to 300 m thick) lie
with discrepencies on the base. The formation
consists successively from the base to the
summit of fine red sandstone, fine quartzite
sandstone and red sandstone with schist flow
(Hugot, 2002)(4).
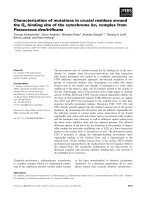
Shales and volcano-sediments These rocks
present a certain complexity. Indeed, at the
weathering, they can be difficult to
differentiate with schistosed and weathered
andesitic rocks. Globally, they are pelites,
sandstone shales, gray-black gloss schists,
tuffaceousschists and rare quartzitic horizons
(Ouédraogo, 2006) (5).
The granodiorites are granular rocks,
mesocratic relatively rich in mafic minerals
and feldspars (Hugot, 2002). (5) They
constitute the major part of the pedestal at the
level of our study site.
The group of Tonalites includes a number of
facies ranging from granodiorite to tonalite
and quartz diorite. These rocks are globally
very close. They are of medium to coarse
grain, presenting a planar mill or a clear
gneissic foliation. Locally, a ribbon is
associated with foliation and gives the rock an
aspect of migmatite. They are usually
intersected by veins of aplite or pegmatite. In
these rocks plagioclase predominates;
Potassium feldspar, quartz, amphibole and
biotite are less abundant (Ouédraogo, 2006)
(5).
The order of magnitude of the total
groundwater resources in the Comoé
watershed where our study area is located is
summarized in Table 1 (Diagnosis of Water
Resources in the Commune Watershed, P12,
RESO, 1998). The distribution of aquifer
reserves is very uneven. In fact, the
sedimentary zone that covers 20% of the basin
contains more than half of the aquifer
reserves. Renewable infiltration water is
estimated at 2530 million m3, or 13.3% of
annual precipitation (GOMBERT, 1998) (6).
Materials and Methods
The collection of the study data required the
use of the material indicated below:
726
Int.J.Curr.Microbiol.App.Sci (2019) 8(1): 725-741
Realization of micro-piezometers
An auger 100 mm in diameter for drilling;
PVC pipes with a thickness of 2 mm and a
diameter of 90 mm for the casing.
Res2Dinv, to invert the geophysical data,
Diver office, for the programming of Divers
probes,
Sedlog, which allowed to build lithological
sections,
Arc Gis and Surfer for mapping
Piezometric surveys
Méthods used
A Leica CS10 Differential GPS for the
determination of TN coordinates and altitudes;
A piezometric sensor and various probes,
respectively for the manual and automatic
measurement of the piezometric level of the
structures.
Geophysical campaign
An acquisition system: the ABEM which
contains measurement protocols;
An ABEM resistivity meter that measures the
apparent resistivity of the medium;
Two (2) 12V batteries;
64 copper electrodes;
4 cables (yellow) to connect the electrodes to
the acquisition system, with their coils (take
care to tidy the cables so that they are easy to
run on the ground and take care not to let the
tips drag);
Two cable connectors;
A black cable to connect the resistivity meter
to the data logger.
There are several methods that can be used on
the characterization of alluvial plains
(gravimetry, the H / V method, tomography).
In the case of our study the characterization
was done by the tomography technique of the
electrical resistivities (ERT) (Maescot,
2008)(8) supported by a series of
granulometric analysis and tactile diagnosis on
several samples coming from the drilling of
the
micropiezometers
of
the
plain.
The ERT measurement sites were chosen
according to the distribution density of the
structures (micropiezometers) as shown in the
map of Figure 4.
The aim of this survey is to inject into the
ground an electric current of intensity I
between two electrodes A and B and to
measure the potential difference V induced
between another pair of electrodes M and N
(Figure 5).
The apparent electrical resistivity of the
subsoil on the basis of Ohm's law is:
Granulometric analysis by sieving
An AFNOR standardized sieve column
comprising sieves of a dimension between
0.08 and 100 millimeters;
Taresto remove the material;
A precision scale
In addition to the field equipment, we used
several technical software. Those are:
SAS4000 Utilities which allowed us to create
measurement protocols,
Where K is a factor dependent on the
geometry of the measuring device
There are several electrode devices used in
practice, but the one we chose is the most
frequently used measuring device in electrical
tomography (GOMBERT, 2008) (8), referred
to as the Wenner device (Figure 5).
727
Int.J.Curr.Microbiol.App.Sci (2019) 8(1): 725-741
With this device, apparent resistivities are less
affected by superficial lateral variations and
give a good vertical resolution for detecting
horizontal layers.
The preceding equation then becomes:
model can be noted: an upper layer of low
resistivity (<90 ohm.m) is observed from the
topographic surface to a depth of about 20 m.
This geological formation is attributed to
heavily clayey alluviums soaked in water.
When going deeper, there is a fairly thin layer
of about 4m thick with a resistivity <150
ohm.m attributed to a sandy arena. This layer
rests on two other cumulative thickness
formations of about 6 m, and resistivity of
between 200 and 400 ohm.m. These layers
could be gravel or gravelly sand. A relatively
resistant zone (800 to 1000 ohm.m) is
observed following the layers mentioned
above
It is necessary, to give a good image of the
basement, a sufficient density of points. The
electrodes, allowing the injection of the
current and the measurement of the potential,
are placed along a profile (Figure 7).
The resistivity values of this zone reflect an
altered rock, probably the cracked horizon; the
base in this zone being granodiorite, there is
then at this point cracked granodiorite and the
whole resting on a healthy granodiorite
resistivity greater than 1000 ohm.m.
In addition it is well suited to sites where
noise is important enough like most of our
sites (Figure 6).
The width between electrodes is constant
(distance a) and the current electrodes
surround
the
potential
electrodes
(measurement) as shown in Figure 7.
Figure 7 shows how data is acquired through a
Wenner device with 28 electrodes. The
principle is the same, regardless of the number
of electrodes.
Results and Discussion
From the variations of the resistivities
obtained by inversion of geophysical data and
relying on the lithological cuttings of our
surrounding boreholes, we have established a
lithological cutting profile of all the power of
the plain in the indicated zone (Figure 10).
This scutting shows three types of formations:
Geological nature of the plain materials
Geophysical data collected in the field has
been inverted to generate geo-electric models.
The results of the inversion show that the
resistivities on our study site are quite varied
(Haladou (2013)) (8), SYMBORO (2016)
(9).This verifies the vertical variation of the
formations in place.
Indeed, for each range of resistivities
corresponds a type of geological formation.
North-west side of the plain
Site N°1 (Karfiguéla)
The following observations on the inverted
A first layer formed of heavily clayed
alluvium, more precisely we have a succession
of pure clay, sandy clay, silty clay, gritty clay
on 20 meters thick.
A second layer of sand and a third layer of
gravel. All based on a fractured granodioritic
base that becomes healthy deeper.The
following figure 10 represents the results of
the micro-drilling near the profile on site N° 1.
These results confirm our conclusions drawn
from geophysics in the first meters (Figure
11). Indeed, the stratigraphic logs of PZRG21
and PZRG22 micro-holes located in the
vicinity of profile LR00093 show a succession
728
Int.J.Curr.Microbiol.App.Sci (2019) 8(1): 725-741
of alluvial layers starting from pure clays to
very clayey alluviums as it has been observed
by geophysics. These alluviums are generally
sands, gravel and silts.
stratification of the plains: at first a deposit of
the densest materials such as gravel, followed
by a deposit of less dense materials such as
sand, to finish with deposits of sand and clay
much less dense.
West side of the plain
Site N°4 et N°5 (Diarabakoko)
The LR106 model of Figure 11 shows a fairly
clear tabulation of the different strata
encountered in the area. Indeed on the first 20
meters we have a low resistivity layer
(<80ohm.m).
This layer consists of clays. From 20 to 27 m
we obtain resistivities characteristic of a sandy
arena and below which is a layer of gravel
(500 to 700 ohm.m) of 11 m thick.Par la suite
nous observons des résistivités caractéristiques
de rochetrèsdure: soclefissuré (1000 à 1500
ohm.m) et soclesain (> 1500ohm.m).
When analyzing the LR107 model, three
distinct zones appear: a top layer of medium
resistivity, a low resistivity intermediate layer
and a lower layer of high resistivity.
The first layer is a mixture of clay sand with
pockets of sand or clay in some places. It is
surmounted by a thin layer of lateritic cuirass
to the southwest. From a depth of 10 m, a clay
formation up to about 22 m deep is observed.
The depth of investigation of the profile does
not allow to see clearly the basement but we
still see that after the clay layer we have a
possible deposition of gravelly sand on the
cracked base.
A lithological cutting taking into account all
the power of the plain in this zone was made
from the resistivity map. This is to obtain the
nature and structure of the different materials
from the topographic surface to the bedrock.
These sections (Figure 12) show a typical
When analyzing the micropiezometer sections
made in the vicinity of the profiles used to
draw these logs, we see that the results are
almost identical except that the drilling cuts
are much more precise because these sections
show the heterogeneities that often go
unnoticed with geophysics (Figure 13).
Assessment and characterization of the
power
Furthermore, in addition to help us
determining the nature of materials,
geophysical models allow us to determine the
power of the plain. Indeed these models are
built in a reference (X, Z). This allows to see
the depth investigated by the profile. Also,
from these models we have built lithological
sections that show the thickness of each of the
layers encountered up to the bedrock. Thus we
can directly estimate the total power of the
plain. This power varies according to the sites
as shown in Figure 14; 15; 16 and 17.
In the North-West zone the power of the plain
varies between 30; 25 and 23 meters (Figure
14; 15). Towards the south and towards the
west the power is also estimated at about
twenty meters but it reaches 38 meters in some
places (Figure 16; 17). Table 2 gives the
thickness of each of the main geological layers
as well as the power of the plain per
measurement site.
The following diagrams (Figure 18) allow us
to better appreciate the distribution of
materials at each level of the plain; but it
should be noted that these diagrams have been
plotted with the results of the profiles which
gave better images of the basement
729
Int.J.Curr.Microbiol.App.Sci (2019) 8(1): 725-741
respectively the LR00093, the LR106 and the
LR102 for the North West, West and South
zones; knowing that the other profiles in the
same zones give more or less the same
proportions.
The northwestern and western zones show
dominance in clay alluvium compared to the
southern zone where gravel and sandy arena
take up a considerable proportion.
Saturated and unsaturated thicknesses in
the plain
Knowing the piezometry on the different
studied sites, we can obtain the saturated and
unsaturated zones knowing that the
piezometric level constitutes the veil between
the two.
However, the piezometry as well as the
thickness of the plain varies from one place to
another; which will also bring to vary the
desired thicknesses. Table 3 shows this
variation for a sample of seven (7)
piezometers chosen in the vicinity of our ERT
profiles.
Plain’s conceptual model
As shown in the conceptual model (Figure
19), the greatest thicknesses are in the
southern part of the plain towards
Diarabakoko and Tangrela probably due to a
basement depression in this area.
embankment level, in order to directly deduce
the geological nature of the boundaries. We
will use rectangular models for interpretation
because these types of models are extended on
the sides and therefore provide much more
information about the boundaries.
At both sites represented by the above models,
the slope of the valley is located at the
electrodes No. 64.
For the LR98 model, the limit is made of
materials with resistivities greater than 1000
ohm.m. These materials are in accordance
with the geology in place, subsurface
limestone and deep crystalline rock
(granodiorite).
The LR102 model also represents the limit of
the plain by materials with a resistivity higher
than 1000 ohm.m but the field observations
show that these materials are of the
consolidated lateritic grave. This limit formed
thereof becomes in depth the basement.
Inverted models of the other profiles gave
similar results. Thus, in the same logic, we
have been able to determine on all sites the
geological nature of the materials that
constitute the limit of the plain. The results are
shown in Table 3.
The results in Table 4 show that on the studied
sites, the limits of the plain are generally zero
flow limits except in the case of LR00096
where we have a limit with variable potential.
Nature of the plain‘s limits
The nature of the slopes of the Karfiguela
plain has been determined by the combination
of geophysical investigations and field
observations of rocky outcrops.
But from our studies, we cannot determine the
extension of each of the limits encountered,
this would be possible if we had done photointerpretation to ensure a certain correlation
between formations. So the results we have at
this level are only relatively punctual.
The interpretation of the electrical resistivity
models that will follow will allow us to
determine the nature of the materials at the
730
Int.J.Curr.Microbiol.App.Sci (2019) 8(1): 725-741
Table.1 Total groundwater resources in the Comoé basin in million m3 (GOMBERT, 1998)
Sub-basin
Upper Comoé
Leraba
Koudoun
Baoué
Iroungou
Total
Sedimentary area
25635
19985
0
0
0
45620
Basement zone
12370
5295
1560
2000
1170
22395
Alluvium
90
40
10
10
10
160
Alterites
96945
6910
0
1480
1870
19905
Total
47740
32230
1570
3490
3050
88080
Table.2 Thicknesses of the main geological layers and power of the plain per site
zone
profile
designation
(site))
LR00093
North-west
LR00094
LR00096
LR106
West
LR107
LR00098
South
LR102
Nature of the main geological layers
Thickness of the
layers (m)
Plain ’s power
(site)
Clay materials
Sand
Gravel
Cracked and weathered granodiorite
Clay materials
Sand
Gravel
Craked and weathered granodiorite
Clay materials
Sand
Gravel
Craked and weathered granodiorite
20
4
6
21
23
2
22
1
-
30
Clay materials
Sand
Gravel
Cracked and weathered granodiorite
20
7
11
20
38
22
1
-
23
Clay materials
Sand
Gravel
Cracked and weathered granodiorite
20
2
-
22
Clay materials
Sand
Gravel
Cracked and weathered granodiorite
12
15
11
13
38
Clay materials
Sand
Gravel
Cracked and weathered granodiorite
731
25
23
Int.J.Curr.Microbiol.App.Sci (2019) 8(1): 725-741
Table.3 Saturated and unsaturated thicknesses of the plain
Table.4 Geological nature of the limits of the plain
Profil
LR00093
LR00094
LR00096
LR00098
LR00102
LR00106
Geological nature of the plain
Deep lateritic consolidated in subsurface, deep granodiorite
Poorly consolidated sandstone
Deep lateritic consolidated in subsurface
Limestone
Consolidated sandstone
Limestone
Fig.1 Map of the geographical location of the study area (SIG VREO, 2008, NESTOR 2017)
732
Int.J.Curr.Microbiol.App.Sci (2019) 8(1): 725-741
Fig.2 Geology of the study site (NESTOR 2017
Figure.3 Kawara sandstone Sindou foliated (A), Kawara sandstone Sindou healthy (B)
Figure.4 Distribution map of ERT profiles
733
Int.J.Curr.Microbiol.App.Sci (2019) 8(1): 725-741
Figure.5 Measuring site n ° 7 in Tengrela (A); measurement site n ° 2 located at the level of the
cascades (B), presence of high voltage pound (noise)
High
tension
Fig.1 Wenner Configuration
Fig.7 Representation of the electrode arrangement for a Wenner device acquisition with different
acquisition levels
Fig.2 Inverted model of electrical resistivity of LR00093 profile
734
Int.J.Curr.Microbiol.App.Sci (2019) 8(1): 725-741
Fig.3 Lithological cutting of profile LR00093
Fig.4 Stratigraphic section of PZRG21 and PZRG22 boreholes
Fig.5 Electrical resistivity model of the LR106 and LR107 profiles
North-east
South-west
South-west
North-east
735
Int.J.Curr.Microbiol.App.Sci (2019) 8(1): 725-741
Fig.6 Lithological sections of the LR106 and LR107 models
Fig.7 Stratigraphic cut of PZRDG and PZRDF boreholes
Clay
+silt
Cla
y
Very fine
sand +
clay
Clay
+sand
Fine
sand
Cla
y
Cla
y
Silt+
sand
Clay +
silt
Fine
sand
Cla
y+s
ilt
Fine
sand
Cla
y+s
ilt
Fig.8 Lithological section of profile LR00093
736
Int.J.Curr.Microbiol.App.Sci (2019) 8(1): 725-741
Fig.9 Lithological sections of models LR00094 and LR00096
Fig.10 Lithological cut of models LR106 and 107
737
Int.J.Curr.Microbiol.App.Sci (2019) 8(1): 725-741
Fig.11 Lithological sections of models LR00098 and LR102
Fig.12 Vertical distribution of materials in the plain
738
Int.J.Curr.Microbiol.App.Sci (2019) 8(1): 725-741
Fig.13 3D Conceptual model of the plain
Fig.14 Extended models of LR102 profiles at the top and LR98 at the bottom
739
Int.J.Curr.Microbiol.App.Sci (2019) 8(1): 725-741
In conclusion the soils of the alluvial plain of
Karfiguela are generally very suitable for
agriculture. However, the considerable
decrease of the flow of the river in the dry
season that has spread to the large plain is
problematic. To overcome this, a solution has
been found.
ohm.m) for the highly conductive materials,
through the averages (100 to 1000 ohm.m) to
finish at the strongest (> 1000 ohm.m).
These resistivity values show a heterogeneity
of the materials at the level of the studied
plain and can be classified in three main
groups according to the geology: The very
clayey alluvium constituting the majority of
the plain with proportions up to 67%
according to the sites; sand and gravel
occupying relatively small proportions. The
power of the plain varies considerably
according to the sites, it reaches 38 meters in
the west and south zones, with saturated
thicknesses varying between 19 and 37 meters
Indeed, the solution adopted was to study the
alluvial aquifer so that it could be a source of
water complementary to the peasants, thus
enabling them to carry out agro-pastoral
activities in the wet season as well as in the
dry season.
The aim of the study was to know not only
the nature of the constituent materials of the
alluvial aquifer but also to know its power
knowing that these two parameters play an
important role in quantifying the underground
water resource.
Today, we know the tabulation, the nature and
the granulometry of the different materials of
the plain from the topographic surface to the
bedrock. We know what any potential
reservoirs, their powers, their saturated and
unsaturated thicknesses and their localization
depths. This could therefore be a solid
database for future implementation of
productive works. Among the objectives, it
was also a question of knowing the geological
nature of the limits of the plain. This was
determined by geophysics and field
observations. Overall on the studied sites we
have impermeable limits because constituted
of crystalline rocks and / or compact
sedimentary rocks. But this information is
only punctual, to define the extent of these
limits, a photo-interpretation study is
necessary because it will make some
geological correlation.
The tomography of electrical resistivity
associated with the wenner protocol was the
geophysical technique that we used for this
study. It is well suited for the characterization
and vertical highlighting of horizontal layers.
To support and confirm our geophysical
results, we carried out forty nine (49)
destructive probes (micro piezometers) auger,
6 meters deep, each with its stratigraphic log
designed by tactile diagnosis from a one-step
sampling. 0.5 meters. These samples were
also subjected to a granulometric analysis in
order to support the tactile diagnosis and to
have an idea on the weight distribution of the
grains of different diameters.
At the end of this analysis the overall picture
that could be drawn was that particle size
curves spread with grain diameter between 16
mm and less than 0.08 mm. All the methods
led to the same results, which testify to the
reliability of these studies. Geophysical
measurements allowed us to detect ranges of
resistivities ranging from the weakest (<100
References
1. Dezelter Alain, 1998 water resources
variability in Africa during the 20th
century. Wallingford: AISH; (252)
387-394
2. DGH. (2001), État des lieux des
ressources en eau du Burkina Faso et
740
Int.J.Curr.Microbiol.App.Sci (2019) 8(1): 725-741
de leur cadre de gestion, programme
gire, version finale, 251P. Ministère
de l’Environnement et de l’Eau,
Secretatriat Général de l’Hydraulique,
Direction Général de l’Hydraulique,
Gestion Intégrée des Ressources en
Eau
3. Nestor F. COMPAORE, Amagana E.
DARA, Mahamadou KOITA, Hamma
Fabien YONLI 2017 Assessment of
the Exploitation and Sustainability of
an Alluvial Plain in Southwestern
Burkina Faso. Journal of Natural
Sciences (2): 16-22.
4. HUGOT G. (2002), In search of lost
Gondwana: at the origins of the world
U.M.R. 6012 of C.N.R.S (espace)
5. Ouedraogo. C. (2006), geological
synthesis of the western region of
Burkina Faso, VREO program, PP 2035.toRESO, 1998
6. GOMBERT
7. MARESCOT L. Imagerie électrique
pour géologue. 2008 version 2008a
73pp
8. Haladou
Laouali
(2013)
Caractérisation des matériaux et de la
puissance de la plaine de Kafiguéla
par
investigations
géophysiques;
mémoire Master. Institut International
de l’Ingénierie de l’eau et de
l’Environnement
9. SYMBORO Aly et Compaoré Nestor
Fiacre (2016), Gestion quantitative et
qualitative des ressources en eau dans
la plaine alluviale de Kafirguéla à
l’aide d’un SIG: Etude de la recharge
induite de la nappe et sa vulnérabilité.
7th RWSN Forum « Water Eveyone
29 nov. – 2 déc. 2016 Abidjan RCI
How to cite this article:
Nestor Fiacre Compaore and Samuel Nakolendousse. 2019. Geophysical Characterization of an
Alluvial Plain: Case of Karfiguela in Burkina Faso. Int.J.Curr.Microbiol.App.Sci. 8(01): 725741. doi: />
741