Gene and protein expression profiles in a mouse model of collagen-induced arthritis
Bạn đang xem bản rút gọn của tài liệu. Xem và tải ngay bản đầy đủ của tài liệu tại đây (950.69 KB, 9 trang )
Int. J. Med. Sci. 2018, Vol. 15
Ivyspring
International Publisher
77
International Journal of Medical Sciences
2018; 15(1): 77-85. doi: 10.7150/ijms.22345
Research Paper
Gene and Protein Expression Profiles in a Mouse Model
of Collagen-Induced Arthritis
Sun-Yeong Gwon1, 3, Ki-Jong Rhee3 and Ho Joong Sung1, 2
1.
2.
3.
Department of Biomedical Laboratory Science, College of Health Science, Eulji University, Seongnam-si, Gyeonggi-do, 13135, Republic of Korea;
Department of Senior Healthcare, BK21 plus Program, Graduated School, Eulji University, Daejeon, 34824, Republic of Korea;
Department of Biomedical Laboratory Science, College of Health Sciences, Yonsei University at Wonju, Wonju, Gangwon-do 26493, Republic of Korea.
Corresponding author: Tel.: +82-31-740-7108; Fax: +82-31-740-7425; E-mail:
© Ivyspring International Publisher. This is an open access article distributed under the terms of the Creative Commons Attribution (CC BY-NC) license
( See for full terms and conditions.
Received: 2017.08.12; Accepted: 2017.10.12; Published: 2018.01.01
Abstract
The risk of rheumatoid arthritis (RA), an autoimmune disease, in the elderly population increases along
with that of atherosclerosis, cardiovascular disease, type 2 diabetes, and Alzheimer’s disease. Identifying
specific biomarkers for RA can clarify the underlying molecular mechanisms and can aid diagnosis and
patient care. To this end, the present study investigated the genes and proteins that are differentially
expressed in RA using a mouse collagen-induced arthritis (CIA) model. We performed gene microarray
and proteome array analyses using blood samples from the mice and found that 50 genes and 24
proteins were upregulated and 48 genes were downregulated by more than 2-fold in the CIA model
relative to the control. The gene microarray and proteome array results were validated by evaluating
the expression levels of select genes and proteins by real-time PCR and western blotting, respectively.
We found that the level of integrin α2, which has not been previously reported as a biomarker of RA,
was significantly increased in CIA mice as compared to controls. These findings provide a set of novel
biomarkers that can be useful for diagnosing and evaluating the progression of RA.
Key words: collagen-induced arthritis; microarray; proteome analysis; biomarker; integrin α2.
Introduction
The incidence of rheumatoid arthritis (RA) is
rising in the elderly population; according to a report
by the National Institutes of Health, approximately
1.3 million adults are afflicted with RA [1]. It is
estimated that up to 1% of the global population has
been diagnosed with RA. The symptoms include
swelling, pain, and joint stiffness from the knuckles to
the knees. RA can also affect other organs such as
lungs and heart, and is a progressively debilitating
disease that can dramatically reduce the quality of
life. The exact cause of RA is unknown, although it is
assumed that both genetic and environmental factors
are involved [2, 3]. It has been reported that RA is
related to the binding of autoantibodies to the host
synovium [4], qualifying RA as an autoimmune
disease. The incidence of RA is higher in women,
suggesting that sex hormones influence disease
etiology [5]. Cigarette smoking and dust are also
proposed risk factors for RA [6, 7]. Similar to
atherosclerosis,
cardiovascular
disease,
and
non-insulin-dependent
diabetes,
RA
is
an
age-associated disease [8, 9]. Rheumatoid factor (RF)
and circulating anti-cyclic citrullinated peptide levels
are biomarkers for RA diagnosis; however, only a
subset of patients expresses both factors [4, 10].
Patients are also diagnosed based on symptoms and
family history [11].
A DBA1/J mouse model of collagen-induced
arthritis (CIA) is widely used for the study of RA [12,
13]. These mice exhibit the pathological features of
RA, including synovial hyperplasia, inflammatory cell
infiltration, and cartilage erosion [14]. Transferring
CIA mouse serum to healthy mice induces arthritis
via passive immunity [15, 16].
Tumor necrosis factor (TNF)-α is a key cytokine
involved in RA. Transgenic mice overexpressin
human TNF-α develop RA, and treatment of arthritic
mice with anti-TNF-α antibody prevents disease
Int. J. Med. Sci. 2018, Vol. 15
development [17, 18]. Interleukin (IL)-1, a component
of TNF-α signaling, plays an important role in
cartilage erosion [18, 19]. Several genes have been
linked to RA susceptibility [20, 21], including signal
transducer and activator of transcription (STAT)4,
which is a risk factor for systemic lupus
erythematosus [22] and is associated with IL-12/23
and interferon (IFN)-α/β in T cell signaling [23].
Despite these findings, there are few specific
biomarkers that are useful for diagnosing and
monitoring the progression of RA.
To address this issue, we analyzed the gene and
protein expression profiles of RA using the CIA
model. A previous gene expression profiling study
using
CIA
mice
reported
that
major
histocompatibility complex class I, II, basigin,
fibroblast activation protein, cathepsin K, cluster of
differentiation (CD)53, RAF-1, glucagon, and retinal
taurine transporter contribute to CIA susceptibility or
severity [24]. In the present study, we identified the
integrin α2 gene (Itga2) as an additional and novel
biomarker for RA.
Materials and Methods
Materials
Antibodies for western blotting were purchased
from
Bio-Rad
(Hercules,
CA,
USA).
The
ProteomeProfiler Mouse Cytokine Array Panel A
(ARY006) was from R&D Systems (Minneapolis, MN,
USA). Collagen (Chondrex, 20022) and complete
(Chondrex, 7001) and incomplete (Chondrex, 7002)
Freund’s adjuvant were purchased from Central Lab.
Animal Inc. (Seoul, Korea).
Animals
Male DBA1/J mice (6–8 weeks old) were
purchased from Central Lab. Animal Inc. and Orient
Bio (Seongnam, Korea). Animal maintenance and
experiments were in accordance with the guidelines
of the Eulji University Institutional Animal Care and
Use Committee (approval No. EUIACUC16-17,
approval date 10 August 2016).
In vivo experiments
Bovine type II collagen was used to induce
arthritis in mice as previously described [16]. Briefly,
bovine type II collagen (2 mg/ml) was mixed at a 1:1
volume ratio with complete Freund’s adjuvant. Each
mouse was injected with 100 mg of bovine type II
collagen in 0.1 ml of emulsion. A booster injection of
100 mg of bovine type II collagen was administered
subcutaneously as a solution in 0.1 ml of incomplete
Freund’s adjuvant 14 days later. Mice were
continuously observed for swelling of the distal joints
after the primary immunization. Arthritis developed
78
between 34 and 40 days after the primary
immunization based on the arthritis score [16] (data
not shown). At the end of the experiment, blood and
paws were collected from each mouse. Whole blood
was stored in a PAXgene tube (Qiagen, Valencia, CA,
USA) at −80°C until RNA and protein extraction.
Paws were fixed in 10% buffered formalin, decalcified
in 10% formic acid, and then embedded in paraffin.
Sagittal serial sections of the whole paws were cut and
stained with hematoxylin and eosin for light
microscopy examination.
RNA extraction, cDNA synthesis, and
quantitative real-time (qRT-)PCR
Total RNA was extracted using the QIAamp
RNA Blood Mini kit (Qiagen) according to the
manufacturer’s protocols, and 1 µg was used for
cDNA synthesis with the SensiFAST cDNA Synthesis
kit (Bioline, Taunton, MA, USA), with a primer
annealing step at 25°C for 10 min, followed by reverse
transcription at 42°C for 15 min, inactivation at 85°C
for 10 min, and storage at 4°C. qRT-PCR was
performed on an ABI StepOnePlus system (Applied
Biosystems, Foster City, CA, USA). Forward and
reverse primer sequences were as follows: IL-1β,
5'-GCTCATCTGGGATCCTCTCC-3' and 5'-CCTGCC
TGAAGCTCTTGTTG-3' [54]; IL-6, 5'-ACGGCCTTCC
CTACTTCACA-3' and 5'-CATTTCCACGATTTCCCA
GA-3' [55]; TNF-α, 5'-GCCTCTTCTCATTCCTGCTT
G-3' and 5'-CTGATGAGAGGGAGGCCATT-3' [55];
integrin α2, 5'-CGCTCCTTCTGTCATCAAGAGTGT
C-3' and 5'-GGAATGTGGATAGTCACCAATGCC-3'
[56]; and β-actin, 5'- CGTGCGTGACATCAAAGAGA
A-3' and 5'- TGGATGCCACAGGATTCCAT-3' [55].
β-Actin was used as an internal control to normalize
target gene expression levels, which were determined
with the 2−ΔΔCT method [57].
Protein extraction and western blotting
Blood from control and CIA mice was mixed
with radioimmunoprecipitation assay buffer (Thermo
Fisher Scientific, Waltham, MA, USA) containing
protease inhibitor (GE Healthcare, Little Chalfont,
UK). After incubation on ice for 20 min, samples were
centrifuged at 15,000 × g and 4°C for 15 min. The
supernatant was used to determine the protein
concentration with the Quick start Bradford reagent
(Bio-Rad). A total of 100 µg of extracted protein was
used for immunoblotting. Samples were separated by
sodium dodecyl sulfate polyacrylamide gel
electrophoresis and transferred to a polyvinylidene
difluoride membrane. After incubation with 5% skim
milk in Tris-buffered saline with Tween 20 (TBST)
composed of 10 mM Tris (pH 8.0), 150 mM NaCl, and
0.05% Tween 20 for 1 h, the membrane was incubated
Int. J. Med. Sci. 2018, Vol. 15
overnight at 4°C with antibodies against the following
proteins: IL-1β (#12242) and glyceraldehyde
3-phosphate dehydrogenase (GAPDH; #5174) (both
from Cell Signaling Technology, Danvers, MA, USA);
TNF-α (ab66579) and integrin α2 (ab133557) (both
from Abcam, Cambridge, MA, USA); IL-6 (sc-1265-R)
(Santa Cruz Biotechnology, Santa Cruz, CA, USA).
The membrane was washed four times for 5 min and
incubated for 2 h with a 1:10,000 dilution of
horseradish peroxidase-conjugated anti-mouse or
-rabbit antibody. The membrane was washed six
times with TBST for 10 min and developed with the
enhanced chemiluminescence system (GE Healthcare)
and blue X-ray film (Agfa HealthCare NV, Mortsel,
Belgium) according to the manufacturer’s protocols.
After the transfer, the gel was stained with Coomassie
Blue reagent (Bio-Rad). GAPDH was used as the
loading control. The membrane was stained with
Ponceau S (Sigma-Aldrich, St. Louis, MO, USA) after
immunoblotting.
79
was determined with the independent Student’s t test
based on fold change, where the null hypothesis was
that no difference existed between the two groups.
Gene enrichment analysis and functional annotation
were performed based on Kyoto Encyclopedia of
Genes and Genomes (KEGG) pathways.
Proteome array
The ProteomeProfiler Mouse Cytokine Array
Panel A (R&D Systems) was used according to the
manufacturer’s protocols to obtain protein expression
profiles using 50-μl blood samples. Spot density was
determined using HLImage software (Western Vision
Software, Salt Lake City, UT, USA).
Statistical analysis
Differences between groups were evaluated with
the Student’s t test using Excel software (Microsoft,
Redmond, WA, USA). P < 0.05 was considered
statistically significant.
Microarray
Results
Blood was collected from mice in a PAXgene
blood RNA tube (PreAnalytiX, Hombrechtikon,
Switzerland) and RNA was isolated using the
PAXgene Blood RNA kit (PreAnalytiX) according to
the manufacturer’s protocol. RNA purity and
integrity were determined based on the optical
density 260/280 ratio on an Agilent 2100 Bioanalyzer
(Agilent Technologies, Palo Alto, CA, USA).
Microarray analysis with a GeneChip Mouse Gene 2.0
ST Array was performed Macrogen Co. (Seoul,
Korea). Raw data were extracted using Affymetrix
Expression Console software and were filtered when
P < 0.05. The statistical significance of expression data
Murine model of arthritis
To identify potential biomarkers of RA, we
established a mouse CIA model by injecting male
DBA1/J mice with bovine type II collagen.
Pathological changes were observed after 49 days; the
mice had swollen paws and ankles typical of arthritis
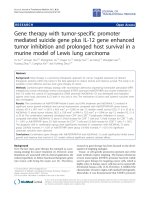
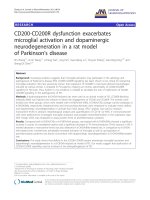
(Figure 1A). Histological examination of the mouse
foot revealed increased inflammation and immune
cell infiltration (Figure 1B), and the cartilage
boundaries appeared crushed. These results confirm
that RA was induced in the CIA mice after 49 days.
Figure 1. Gross morphological and histological examination of CIA. (A) Gross observation of mouse paws. Shown are the fore paws (top) and hind paws (bottom)
of control (n = 12) and CIA (n = 14) mice at 14 weeks of age. Scale bars = 10 mm. (B) H&E staining of sagittal sections of control and CIA mouse joints. Lower panels
show enlarged views of the areas delineated by a box in the upper panels. Arrows indicate cartilage boundaries. Scale bars = 1 mm.
Int. J. Med. Sci. 2018, Vol. 15
80
Table 1. Genes differentially expressed in the blood of control and CIA mice
Increased genes
No. Gene symbol
Irf7
1
Isg15
2
Ifit1
3
Oas3
4
Mir107
5
H2-Q8
6
Fn1
7
C1ra
8
Ifih1
9
Fpr2
10
Clca3a1
11
Olfr774
12
Hist1h2bj
13
Ifi204
14
Fads2
15
Plxna4
16
Sp100
17
Vcl
18
Tuba3b
19
Dusp3
20
Hist1h2aa
21
H2-T24
22
Rps6ka2
23
Itga2
24
Sort1
25
Fold change
24.7
6.6
6.1
4.9
4.2
3.4
3.2
3.0
2.9
2.9
2.7
2.7
2.7
2.6
2.6
2.5
2.5
2.3
2.3
2.3
2.3
2.3
2.3
2.3
2.2
No.
26
27
28
29
30
31
32
33
34
35
36
37
38
39
40
41
42
43
44
45
46
47
48
49
50
Gene symbol
Olfr1386
Olfr1502
Cyp2d26
Mir423
Ppp1r15a
Spta1
Rps15
Vwf
Pla2g2a
Cmpk2
F5
Fos
Olfr917
Ptpn11
C3
Hist2h4
Flna
Cks1b
Olfr1057
Olfr726
Olfr1298
Igtp
Mir7-1
Thbs1
Olfr38
Fold change
2.2
2.2
2.2
2.2
2.2
2.2
2.2
2.2
2.2
2.1
2.1
2.1
2.1
2.0
2.0
2.0
2.0
2.0
2.0
2.0
2.0
2.0
2.0
2.0
2.0
Gene expression profiling
Gene expression analysis was performed using
RNA from blood samples from control and CIA mice.
In total, 98 genes showed ≥ 2-fold change in blood
mRNA expression in CIA as compared to control mice
(Table 1 and Table S1). Of these genes, 50 were
upregulated and 48 were downregulated. The
expression levels of eight genes [interferon regulatory
factor (Irf)7; interferon-stimulated gene 15; interferon
induced protein with tetratricopeptide repeats 1;
2'-5'-oligoadenylate synthetase 3; microRNA 107;
histocompatibility 2, Q region locus 8; fibronectin 1; and
complement component 1, r subcomponent A] were >
3-fold higher in CIA than in control mice, with the
level of Irf7 showing a > 24-fold difference. The
expression of five genes [Sec24a, Cd27, Cd8b1,
chemokine (C-C motif) ligand (Ccl)5, and Cd3g] was
decreased by > 3 fold in CIA as compared to control
mice. A KEGG pathway analysis of 98 genes whose
expression differed by ≥ 2-fold between the two
groups revealed that Cd4 was associated with seven
different KEGG pathways (Tables 1 and 2). Genes in
five of nine analyzed pathways were downregulated
in CIA. For example, Th1 and Th2 cell differentiation
in
the
immune
system
category
showed
downregulation of seven genes. Of the 26 analyzed
pathways, five contained only genes that were
upregulated in CIA, such as those related to
mitogen-activated
protein
kinase
signaling,
extracellular matrix (ECM), and focal adhesion. All of
Decreased genes
No. Gene symbol
Sec24a
1
Cd27
2
Cd8b1
3
Ccl5
4
Cd3g
5
Cd3e
6
Lat
7
Hist1h2ba
8
Ncr1
9
Eif4a1
10
Rps8
11
Cd4
12
Il2rb
13
Ddx5
14
Rpl30
15
Mirlet7f-2
16
Ppp2r2d
17
Atp1b3
18
Ube3c
19
Olfr875
20
Rmrp
21
Ctsw
22
Slc40a1
23
Sec61b
24
Fold change
-3.9
-3.3
-3.3
-3.2
-3.2
-2.9
-2.7
-2.7
-2.7
-2.6
-2.6
-2.6
-2.5
-2.5
-2.5
-2.5
-2.5
-2.4
-2.4
-2.4
-2.3
-2.3
-2.3
-2.2
No.
25
26
27
28
29
30
31
32
33
34
35
36
37
38
39
40
41
42
43
44
45
46
47
48
Gene symbol
Rps2
Il7r
Ccnd2
Rgs14
Pck2
Cd59a
Tcf7
Rps11
Ugcg
Rpl6
Olfr373
Olfr705
Cd209a
Lck
Klrd1
Olfr1501
Rpl37a
Mir103-2
Ppil2
Ddx46
Stat4
Itgb7
Bcl2a1c
Olfr1299
Fold change
-2.2
-2.2
-2.2
-2.2
-2.2
-2.2
-2.2
-2.2
-2.1
-2.1
-2.1
-2.1
-2.1
-2.1
-2.1
-2.1
-2.1
-2.0
-2.0
-2.0
-2.0
-2.0
-2.0
-2.0
the analyzed pathways had P < 0.05.
Protein expression profiling
Changes in protein levels in CIA mice were
evaluated with a proteome array using whole blood.
Because most genes identified by the KEGG pathway
analysis were related to the immune system and
immune-related
diseases,
we
used
the
ProteomeProfiler Mouse Cytokine Array Panel A for
protein expression profiling. We found that the levels
of all 40 cytokines were slightly increased in the blood
of CIA as compared to control mice (Table S2), with 24
showing a > 2-fold increase (Table 3B). These genes
were grouped into 18 categories based on the KEGG
classification scheme (Table 3A). Most of the
upregulated cytokines were associated with
cytokine-cytokine
receptor
interaction,
Janus
kinase-STAT signaling, and helper T cell (Th)17
differentiation pathways, whereas seven were
associated with RA and the hematopoietic cell
lineage. The cytokines associated with the RA
pathway included IL-17; IL-23; IL-1β; monocyte
chemoattractant protein (MCP)-5; TNF-α; regulated
upon activation, normally T-expressed, and
presumably secreted (RANTES); IL-6; and IL-16. IL-2
expression showed the greatest difference between
CIA and control mice. The levels of IL-1β, TNF-α, and
IL-6, which are the major pro-inflammatory cytokines
[25], were 6.41, 3.35, and 2.41-fold higher,
respectively; IL-17 and -23, which are involved in
Th17 cell differentiation [26], were upregulated by
Int. J. Med. Sci. 2018, Vol. 15
81
13.09- and 7.21-fold, respectively; and RANTES, also
known as Ccl5 [27, 28], was upregulated 2.5-fold in
the RA model.
Validation of differentially expressed genes and
proteins
The results from the gene expression microarray
and proteome array were validated by qRT-PCR and
western blot analysis of selected genes and proteins,
including integrin α2, IL-1β, TNF-α, and IL-6, that
showed ≥ 2-fold difference in expression relative to
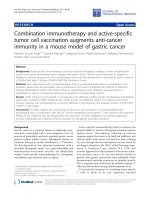
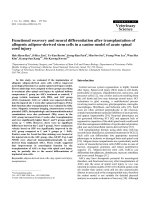
the control. Consistent with the gene microarray
results, Itga2 expression was significantly higher in
CIA than in control mice by qRT-PCR (Figure 2). A
similar result was obtained for the genes encoding
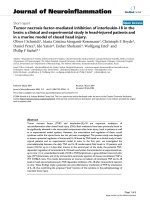
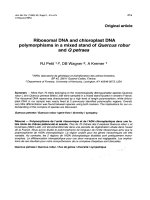
IL-1β, TNF-α, and IL-6. Western blot analysis revealed
that blood protein levels of integrin α2, IL-1β, TNF-α,
and IL-6 were increased in CIA as compared to
control mice (Figure 3). Thus, the qRT-PCR and
western blotting results support the validity of the
microarray and protein array data.
Table 2. KEGG pathway analysis of differentially expressed genes identified by microarray analysis
No. KEGG classification
1
2
3
4
5
6
Immune system
7
8
9
10
11
12
13
14
15
16
17
Immune diseases
Signal transduction
Signaling molecules and
interaction
18
19
Pathway
Number of
Increased genes
significant genes
Th1 and Th2 cell differentiation
7
Th17 cell differentiation
6
T cell receptor signaling pathway
6
H2-Q8, H2-T24
Antigen processing and presentation 5
Hematopoietic cell lineage
5
C1ra, Vwf, F5, C3
Complement and coagulation
5
cascades
Natural killer cell mediated
4
cytotoxicity
Irf7, Oas3, Ifi204
NOD-like receptor signaling pathway 4
Irf7, Isg15, Ifih1
RIG-I-like receptor signaling pathway 3
Primary immunodeficiency
5
Hist1h2bj, Hist1h2aa, C3,
Systemic lupus erythematosus
5
Hist2h4
H2-Q8, H2-T24
Graft-versus-host disease
3
Fn1, Itga2, Vwf, Thbs1
PI3K-Akt signaling pathway
10
Decreased genes
P value
Stat4, Lck, Il2rb, Cd4, Lat, Cd3e, Cd3g
Lck, Il2rb, Cd4, Lat, Cd3e, Cd3g
Lck, Cd4, Lat, Cd3e, Cd3g, Cd8b1
Klrd1, Cd4, Cd8b1
Il7r, Cd4, Cd3e, Cd3g, Cd8b1
Cd59a
< 0.001
< 0.001
< 0.001
< 0.001
< 0.001
< 0.001
Klrd1, Lck, Ncr1, Lat
< 0.001
Ccl5
< 0.01
< 0.01
< 0.001
< 0.001
Lck, Il7r, Cd4, Cd3e, Cd8b1
Hist1h2ba
Klrd1
Pck2, Ppp2r2d, Itgb7, Ccnd2, Il7r,
Il2rb
Stat4, Ccnd2, Il7r, Il2rb
Jak-STAT signaling pathway
MAPK signaling pathway
NF-kappa B signaling pathway
Cell adhesion molecules (CAMs)
4
4
3
5
ECM-receptor interaction
Cytokine-cytokine receptor
interaction
Focal adhesion
4
4
Fn1, Itga2, Vwf, Thbs1
6
Fn1, Vcl, Itga2, Vwf, Flna,
Thbs1
Tuba3b, Spta1
Bcl2a1c, Ctsw
H2-Q8, C1ra, Tuba3b,
Sec61b, Cd209a
H2-T24, Itga2, C3, Thbs1
Fads2, Pla2g2a
Rps15
Rps2, Rpl30,Rpl37a, Rpl6, Rps11,
Rps8
Rps6ka2, Sort1, Ptpn11
Clca3a1, Olfr774,
Olfr1299,Olfr1501, Olfr705, Olfr373,
Olfr1386, Olfr1502,
Olfr875
Olfr726, Olfr1298, Olfr38
20
Cellular community
21
22
Cell growth and death
Apoptosis
Transport and catabolism Phagosome
4
9
23
24
Lipid metabolism
Translation
alpha-Linolenic acid metabolism
Ribosome
2
7
25
26
Nervous system
Sensory system
Neurotrophin signaling pathway
Olfactory transduction
3
12
Bcl2a1c, Lck, Lat
Itgb7, Cd4, Cd8b1
< 0.01
< 0.01
< 0.05
< 0.001
Il7r, Il2rb, Ccl5, Cd27
< 0.001
< 0.01
Dusp3, Rps6ka2, Fos, Flna
H2-Q8, H2-T24
< 0.01
< 0.001
< 0.001
< 0.01
< 0.01
< 0.05
< 0.01
< 0.05
< 0.001
Figure 2. Validation of microarray and proteome array results by qRT-PCR. The expression of each gene shown in the figure was confirmed by qRT-PCR using
specific primers. β-Actin served as an internal control. Data represent the mean ± SEM. *P < 0.05, **P < 0.01
Int. J. Med. Sci. 2018, Vol. 15
82
Table 3A. Proteins differentially expressed in the blood of control and CIA mice. (A) Classification of upregulated proteins
No. Classification
1
Cytokine-cytokine receptor interaction
2
3
4
5
6
7
8
9
10
11
12
13
14
15
16
17
18
Jak-STAT signaling pathway
Th17 cell differentiation
Rheumatoid arthritis
Hematopoietic cell lineage
NOD-like receptor signaling pathway
Graft-versus-host disease
NF-kappa B signaling pathway
T cell receptor signaling pathway
PI3K-Akt signaling pathway
Th1 and Th2 cell differentiation
MAPK signaling pathway
Systemic lupus erythematosus
HIF-1 signaling pathway
RIG-I-like receptor signaling pathway
Apoptosis
Natural killer cell mediated cytotoxicity
Antigen processing and presentation
Identified proteins
IL-2, IL-27, IL-17, MIP-1beta, IL-23, IL-1beta, IL-1ra, MIP-2, MCP-5, TARC, IL-3,
TNF-alpha, IP-10, MIG, BLC, I-TAC, RANTES, IL-4, IL-6, IL-5, IL-10
IL-2, IL-27, IL-23, IL-3, IL-4, IL-6, IL-5, IL-10
IL-2, IL-27, IL-17, IL-23, IL-1beta, IL-1ra, IL-4, IL-6
IL-17, IL-23, IL-1beta, MCP-5, TNF-alpha, RANTES, IL-6, IL-16
IL-1beta, IL-1ra, IL-3, TNF-alpha, IL-4, IL-6, IL-5
IL-1beta, MIP-2, MCP-5, TNF-alpha, RANTES, IL-6
IL-2, IL-1beta, TNF-alpha, IL-6, IL-10
MIP-1beta, IL-1beta, IL-1ra, TNF-alpha, BLC
IL-2, TNF-alpha, IL-4, IL-5, IL-10
IL-2, IL-3, IL-4, IL-6
IL-2, IL-4, IL-5
IL-1beta, IL-1ra, TNF-alpha
TNF-alpha, IL-10
TIMP-1, IL-6
TNF-alpha, IP-10
IL-3, TNF-alpha
TNF-alpha
TNF-alpha
Table 3B. Densitometry analysis of upregulated proteins (n = 24)
No.
1
2
3
4
5
6
7
8
9
10
11
12
13
14
15
16
17
18
19
20
21
22
23
24
Protein name
IL-2
IL-27
IL-17
MIP-1beta
IL-23
IL-1beta
IL-1ra
MIP-2
MCP-5
TIMP-1
TARC
IL-3
TREM-1
TNF-alpha
IP-10
MIG
BLC
I-TAC
RANTES
IL-4
IL-6
IL-16
IL-5
IL-10
Relative fold change
27.4
19.3
13.1
10.2
7.2
6.4
4.6
4.2
4.1
4.0
3.9
3.9
3.8
3.4
2.9
2.9
2.7
2.5
2.5
2.4
2.4
2.2
2.2
2.0
Discussion
RA initially occurs as non-specific inflammation
in the joints; however, other organs are also affected
in 15%–25% of individuals [29]. Following T cell
activation, chronic inflammation occurs accompanied
by tissue injury due to activation of the
pro-inflammatory cytokines IL-1 and -6 and TNF-α.
Our microarray results showed that Itga2 and Irf7
were upregulated, whereas cd4 was downregulated in
CIA mice. A KEGG pathway analysis indicated that
pathways related to the immune system were highly
Number of proteins
21
8
8
7
7
6
5
5
5
4
3
3
2
2
2
2
1
1
represented among the differentially expressed genes.
Accordingly, IL-2, -27, -17, IL-1β, -6, and TNF-α levels
were > 2-fold higher in the RA model relative to
control mice, which was confirmed by qRT-PCR and
western blotting.
Integrin α2 is a component of the very
late-activation antigen 2 complex (integrin α2β1) [30]
and binds to collagen via the I-domain [31, 32].
Integrin α2β1 is expressed only by effector Th1 and
Th17 cells and attaches to collagen I/II-expressing
cells of the synovial matrix [32, 33], resulting in the
stimulation of T cell receptor-dependent IL-17
production [34]. IL-17 secreted by Th17 cells induces
the production of pro-inflammatory cytokines such as
IL-1 and -6 and TNF-α by macrophages,
chondrocytes, and fibroblast-like synoviocytes, and
was found to cause bone erosion via expression of
receptor activator of nuclear factor-κB ligand
(RANKL) in fibroblast-like synoviocytes and
osteoclasts [35]. Blockade of integrin α2β1 reduced
synovial inflammation, cartilage destruction, and
bone loss in the joints of CIA mice [36]. According to
the RNA microarray results and KEGG pathway
analysis, integrin α2 is involved in phosphoinositide
3-kinase (PI3K)-Akt signaling, ECM receptor
interaction, focal adhesion, and phagosome
formation. PI3K-Akt signaling maintains basics
cellular functions such as proliferation and
differentiation [37], and inhibition of this pathway is a
therapeutic strategy for RA treatment. Although the
exact role of integrin α2 in the pathways identified by
KEGG analysis is unclear, our results suggest that
integrin α2 plays an important role in RA etiology,
and is thus a candidate biomarker for RA diagnosis.
Int. J. Med. Sci. 2018, Vol. 15
83
Figure 3. Validation of microarray and proteome array results by western blotting. (A) Western blotting was performed using blood samples from control and CIA
mice. GAPDH served as an internal control. (B) Relative fold change in band intensity of target proteins normalized to GAPDH level. Data represent the mean ± SEM.
*P < 0.05
Irf7 was another gene that was identified by
microarray analysis as being upregulated in RA. IRF7
regulates the transcription of IFN-stimulated genes
such as IFN-β, RANTES, and IFN-γ-inducible protein
10 that are expressed in the joints of RA patients
[38-40]. Irf7 knockdown was found to decrease
IFN-stimulated response element promoter activity
[41], resulting in a decrease in the expression of genes
associated with Th17 cell differentiation; however,
this was accompanied by an increase in IL-17
secretion by Th17 cells. Further research is needed to
resolve this discrepancy.
IL-1 and TNF-α are involved in joint
inflammation and erosion in RA [42]. TNF-α-induced
upregulation by TNF-α in synovial T cells was shown
to increase RANKL expression and stimulate
osteoclastogenesis in RA [43]. IL-27 is produced by
antigen-presenting cells and regulates T cell
differentiation and function [44]; it has pro- or
anti-inflammatory functions depending on the disease
stage [45, 46]. IL-27 levels were found to be higher in
RA patients than in healthy individuals [47].
IL-27Ra−/− mice showed reduced severity of
proteoglycan-induced arthritis [46], whereas injection
of exogenous IL-27 improved RA symptoms in the
CIA model [45]. Consistent with these earlier studies,
we found here that IL-27 was upregulated in CIA as
compared to control mice. In contrast, we observed
that IL-2 expression was also increased in the RA
model, although previous reports suggest that the
IL-2 level is lower in rheumatoid synovial fluid,
synovial tissue, and peripheral blood of RA patients
than in those of control subjects [48, 49]. This
discrepancy may be due to differences between
species.
Our proteome array results showed that
RANTES (or CCL5) was upregulated in CIA as
compared to control mice. In contrast, the Ccl5
transcript (encoding RANTES) showed the opposite
trend. RANTES is a chemotactic factor that recruits
monocytes, memory T cells, and natural killer cells
[50-52]. Others have reported higher RANTES levels
in CIA mice relative to controls [53]. Therefore,
additional research is necessary to clarify the exact
role of RANTES in RA.
In summary, we found that integrin α2, IL-1β
and -6, and TNF-α were upregulated in a mouse
model of RA. In particular, integrin α2 was identified
for the first time as a potential biomarker that can
expedite RA diagnosis and be used to monitor disease
progression.
Abbreviations
RA, rheumatoid arthritis; CIA, collagen-induced
arthritis; RF, rheumatoid factor; TNF, tumor necrosis
factor; IL, interleukin; STAT, signal transducer and
activator of transcription; IFN, interferon; CD, cluster
of differentiation; Itga2, integrin α2 gene; KEGG,
Int. J. Med. Sci. 2018, Vol. 15
Kyoto encyclopedia of genes and genomes; GAPDH,
glyceraldehyde 3-phosphate dehydrogenase; ECM,
extracellular matrix; CAMs, cell adhesion molecules;
Th cell, helper T cell; MCP, monocyte chemoattractant
protein; RANTES, regulated upon activation,
normally T-expressed, and presumably secreted;
integrin α2β1, very late-activation antigen 2 complex;
RANKL, receptor activator of nuclear factor-κB
ligand; PI3K, phosphoinositide 3-kinase.
Supplementary Material
Supplementary tables.
/>
Acknowledgment
84
12.
13.
14.
15.
16.
17.
18.
19.
20.
This research was supported by the Bio &
Medical Technology Development Program of the
National Research Foundation (NRF) & funded by the
Korean
government
(MSIP&MOHW)
(No.
2016M3A9B6904244).
22.
Authors’ Contributions
24.
Sun-Yeong Gwon and Ho Joong Sung conceived
and designed the experiments; Sun-Yeong Gwon
performed the experiments; Sun-Yeong Gwon and Ho
Joong Sung analyzed the data; Ho Joong Sung
contributed
reagents/materials/analysis
tools;
Sun-Yeong Gwon, Ki-Jong Rhee and Ho Joong Sung
wrote the paper.
25.
Competing Interests
The authors have declared that no competing
interest exists.
References
Helmick CG, Felson DT, Lawrence RC, Gabriel S, Hirsch R, Kwoh CK, et al.
Estimates of the prevalence of arthritis and other rheumatic conditions in the
United States. Part I. Arthritis and rheumatism. 2008; 58: 15-25.
2. Raychaudhuri S. Recent advances in the genetics of rheumatoid arthritis.
Current opinion in rheumatology. 2010; 22: 109-18.
3. Edwards CJ, Cooper C. Early environmental factors and rheumatoid arthritis.
Clinical and experimental immunology. 2006; 143: 1-5.
4. van Gaalen F, Ioan-Facsinay A, Huizinga TW, Toes RE. The devil in the
details: the emerging role of anticitrulline autoimmunity in rheumatoid
arthritis. J Immunol. 2005; 175: 5575-80.
5. Valentino R, Savastano S, Tommaselli AP, Riccio A, Mariniello P, Pronesti G,
et al. Hormonal pattern in women affected by rheumatoid arthritis. Journal of
endocrinological investigation. 1993; 16: 619-24.
6. Källberg H, Ding B, Padyukov L, Bengtsson C, Rönnelid J, Klareskog L, et al.
Smoking is a major preventable risk factor for rheumatoid arthritis:
estimations of risks after various exposures to cigarette smoke. Annals of the
rheumatic diseases. 2011; 70: 508-11.
7. Lundström E, Källberg H, Alfredsson L, Klareskog L, Padyukov L.
Gene–environment interaction between the DRB1 shared epitope and
smoking in the risk of anti–citrullinated protein antibody–positive rheumatoid
arthritis: All alleles are important. Arthritis & Rheumatism. 2009; 60: 1597-603.
8. Chung HY, Cesari M, Anton S, Marzetti E, Giovannini S, Seo AY, et al.
Molecular Inflammation: Underpinnings of Aging and Age-related Diseases.
Ageing research reviews. 2009; 8: 18-30.
9. Tamil Iniyan G, Takbum O. MicroRNAs as Novel Biomarkers for the
Diagnosis of Alzheimer`s Disease and Modern Advancements in the
Treatment. Biomedical Science Letters. 2015; 21: 1-8.
10. Park CE. Comparison of the Usefulness of Diagnostic Tests for Rheumatoid
Arthritis. Korean Journal of Clinical Laboratory Science. 2015; 47: 168-74.
11. Aletaha D, Neogi T, Silman AJ, Funovits J, Felson DT, Bingham CO, et al. 2010
Rheumatoid arthritis classification criteria: an American College of
21.
23.
26.
27.
28.
29.
30.
31.
1.
32.
33.
34.
35.
36.
37.
38.
39.
Rheumatology/European League Against Rheumatism collaborative
initiative. Annals of the rheumatic diseases. 2010; 69: 1580-8.
Asquith DL, Miller AM, McInnes IB, Liew FY. Animal models of rheumatoid
arthritis. European journal of immunology. 2009; 39: 2040-4.
Caplazi P, Baca M, Barck K, Carano RAD, DeVoss J, Lee WP, et al. Mouse
Models of Rheumatoid Arthritis. Veterinary pathology. 2015.
Williams RO. Collagen-induced arthritis in mice. Methods in molecular
medicine. 2007; 136: 191-9.
Holmdahl R, Rubin K, Klareskog L, Larsson E, Wigzell H. Characterization of
the antibody response in mice with type II collagen-induced arthritis, using
monoclonal anti-type II collagen antibodies. Arthritis and rheumatism. 1986;
29: 400-10.
Brand DD, Latham KA, Rosloniec EF. Collagen-induced arthritis. Nat
Protocols. 2007; 2: 1269-75.
Keffer J, Probert L, Cazlaris H, Georgopoulos S, Kaslaris E, Kioussis D, et al.
Transgenic mice expressing human tumour necrosis factor: a predictive
genetic model of arthritis. The EMBO journal. 1991; 10: 4025-31.
Berg WBvd. Lessons from animal models of arthritis over the past decade.
Arthritis Research & Therapy. 2009; 11: 250-.
Niki Y, Yamada H, Seki S, Kikuchi T, Takaishi H, Toyama Y, et al.
Macrophage- and neutrophil-dominant arthritis in human IL-1 alpha
transgenic mice. The Journal of clinical investigation. 2001; 107: 1127-35.
Plenge RM, Cotsapas C, Davies L, Price AL, de Bakker PI, Maller J, et al. Two
independent alleles at 6q23 associated with risk of rheumatoid arthritis.
Nature genetics. 2007; 39: 1477-82.
Lee S-Y, Yu J-I, Chae S-C. Associations of IFITM3 haplotypes with rheumatoid
arthritis in a Korean population. Genes & Genomics. 2012; 34: 493-8.
Remmers EF, Plenge RM, Lee AT, Graham RR, Hom G, Behrens TW, et al.
STAT4 and the risk of rheumatoid arthritis and systemic lupus erythematosus.
The New England journal of medicine. 2007; 357: 977-86.
Kaplan MH. STAT4: a critical regulator of inflammation in vivo. Immunol Res.
2005; 31: 231-42.
Ibrahim SM, Koczan D, Thiesen HJ. Gene-expression profile of
collagen-induced arthritis. Journal of autoimmunity. 2002; 18: 159-67.
Zhang J-M, An J. Cytokines, Inflammation and Pain. International
anesthesiology clinics. 2007; 45: 27-37.
Fossiez F, Djossou O, Chomarat P, Flores-Romo L, Ait-Yahia S, Maat C, et al. T
cell interleukin-17 induces stromal cells to produce proinflammatory and
hematopoietic cytokines. The Journal of experimental medicine. 1996; 183:
2593-603.
Adler EP, Lemken CA, Katchen NS, Kurt RA. A dual role for tumor-derived
chemokine RANTES (CCL5). Immunology Letters. 2003; 90: 187-94.
Schall TJ, Jongstra J, Dyer BJ, Jorgensen J, Clayberger C, Davis MM, et al. A
human T cell-specific molecule is a member of a new gene family. J Immunol.
1988; 141: 1018-25.
Turesson C, O'Fallon WM, Crowson CS, Gabriel SE, Matteson EL.
Extra-articular disease manifestations in rheumatoid arthritis: incidence
trends and risk factors over 46 years. Annals of the rheumatic diseases. 2003;
62: 722-7.
Takada Y, Hemler ME. The primary structure of the VLA-2/collagen receptor
alpha 2 subunit (platelet GPIa): homology to other integrins and the presence
of a possible collagen-binding domain. The Journal of cell biology. 1989; 109:
397-407.
Tuckwell D, Calderwood DA, Green LJ, Humphries MJ. Integrin alpha 2
I-domain is a binding site for collagens. Journal of cell science. 1995; 108:
1629-37.
Heino J. The collagen receptor integrins have distinct ligand recognition and
signaling functions. Matrix biology : journal of the International Society for
Matrix Biology. 2000; 19: 319-23.
Chan BM, Wong JG, Rao A, Hemler ME. T cell receptor-dependent,
antigen-specific stimulation of a murine T cell clone induces a transient, VLA
protein-mediated binding to extracellular matrix. J Immunol. 1991; 147:
398-404.
Boisvert M, Chetoui N, Gendron S, Aoudjit F. Alpha2beta1 integrin is the
major collagen-binding integrin expressed on human Th17 cells. European
journal of immunology. 2010; 40: 2710-9.
Komatsu N, Takayanagi H. Autoimmune arthritis: the interface between the
immune system and joints. Advances in immunology. 2012; 115: 45-71.
El Azreq M-A, Boisvert M, Cesaro A, Pagé N, Loubaki L, Allaeys I, et al. α2β1
Integrin Regulates Th17 Cell Activity and Its Neutralization Decreases the
Severity of Collagen-Induced Arthritis. The Journal of Immunology. 2013; 191:
5941-50.
Willems L, Tamburini J, Chapuis N, Lacombe C, Mayeux P, Bouscary D. PI3K
and mTOR signaling pathways in cancer: new data on targeted therapies.
Current oncology reports. 2012; 14: 129-38.
Haringman JJ, Smeets TJ, Reinders-Blankert P, Tak PP. Chemokine and
chemokine receptor expression in paired peripheral blood mononuclear cells
and synovial tissue of patients with rheumatoid arthritis, osteoarthritis, and
reactive arthritis. Annals of the rheumatic diseases. 2006; 65: 294-300.
Garcia-Vicuna R, Gomez-Gaviro MV, Dominguez-Luis MJ, Pec MK,
Gonzalez-Alvaro I, Alvaro-Gracia JM, et al. CC and CXC chemokine receptors
mediate migration, proliferation, and matrix metalloproteinase production by
fibroblast-like synoviocytes from rheumatoid arthritis patients. Arthritis and
rheumatism. 2004; 50: 3866-77.
Int. J. Med. Sci. 2018, Vol. 15
85
40. van Holten J, Smeets TJ, Blankert P, Tak PP. Expression of interferon beta in
synovial tissue from patients with rheumatoid arthritis: comparison with
patients with osteoarthritis and reactive arthritis. Annals of the rheumatic
diseases. 2005; 64: 1780-2.
41. Sweeney SE, Kimbler TB, Firestein GS. Synoviocyte innate responses: II.
Pivotal role of interferon regulatory factor 3. Journal of immunology
(Baltimore, Md : 1950). 2010; 184: 7162-8.
42. Mosmann TR, Coffman RL. Heterogeneity of cytokine secretion patterns and
functions of helper T cells. Advances in immunology. 1989; 46: 111-47.
43. Wei S, Kitaura H, Zhou P, Ross FP, Teitelbaum SL. IL-1 mediates TNF-induced
osteoclastogenesis. The Journal of clinical investigation. 2005; 115: 282-90.
44. Kastelein RA, Hunter CA, Cua DJ. Discovery and biology of IL-23 and IL-27:
related but functionally distinct regulators of inflammation. Annu Rev
Immunol. 2007; 25.
45. Niedbala W, Cai B, Wei X, Patakas A, Leung BP, McInnes IB, et al. Interleukin
27 attenuates collagen-induced arthritis. Annals of the rheumatic diseases.
2008; 67: 1474-9.
46. Cao Y, Doodes PD, Glant TT, Finnegan A. IL-27 induces a Th1 immune
response and susceptibility to experimental arthritis. J Immunol. 2008; 180:
922-30.
47. Lai X, Wang H, Cao J, Li Y, Dai Y, Xiang Y, et al. Circulating IL-27 Is Elevated
in Rheumatoid Arthritis Patients. Molecules (Basel, Switzerland). 2016; 21.
48. Combe B, Pope RM, Fischbach M, Darnell B, Baron S, Talal N. Interleukin-2 in
rheumatoid arthritis: production of and response to interleukin-2 in
rheumatoid synovial fluid, synovial tissue and peripheral blood. Clinical and
experimental immunology. 1985; 59: 520-8.
49. Kitas GD, Salmon M, Farr M, Gaston JS, Bacon PA. Deficient interleukin 2
production in rheumatoid arthritis: association with active disease and
systemic complications. Clinical and experimental immunology. 1988; 73:
242-9.
50. Wogensen L, Lee MS, Sarvetnick N. Production of interleukin 10 by islet cells
accelerates immune-mediated destruction of beta cells in nonobese diabetic
mice. The Journal of experimental medicine. 1994; 179: 1379-84.
51. Grewal IS, Grewal KD, Wong FS, Picarella DE, Janeway CA, Jr., Flavell RA.
Local expression of transgene encoded TNF alpha in islets prevents
autoimmune diabetes in nonobese diabetic (NOD) mice by preventing the
development of auto-reactive islet-specific T cells. The Journal of experimental
medicine. 1996; 184: 1963-74.
52. Moritani M, Yoshimoto K, Wong SF, Tanaka C, Yamaoka T, Sano T, et al.
Abrogation of autoimmune diabetes in nonobese diabetic mice and protection
against effector lymphocytes by transgenic paracrine TGF-beta1. The Journal
of clinical investigation. 1998; 102: 499-506.
53. Thornton S, Duwel LE, Boivin GP, Ma Y, Hirsch R. Association of the course of
collagen-induced arthritis with distinct patterns of cytokine and chemokine
messenger RNA expression. Arthritis and rheumatism. 1999; 42: 1109-18.
54. Meador BM, Krzyszton CP, Johnson RW, Huey KA. Effects of IL-10 and age on
IL-6, IL-1β, and TNF-α responses in mouse skeletal and cardiac muscle to an
acute inflammatory insult. Journal of Applied Physiology. 2008; 104: 991-7.
55. Yamakawa I, Kojima H, Terashima T, Katagi M, Oi J, Urabe H, et al.
Inactivation of TNF-α ameliorates diabetic neuropathy in mice. American
Journal of Physiology - Endocrinology and Metabolism. 2011; 301: E844-E52.
56. Jafri M, Donnelly B, Allen S, Bondoc A, McNeal M, Rennert PD, et al.
Cholangiocyte expression of α<sub>2</sub>β<sub>1</sub>-integrin confers
susceptibility to rotavirus-induced experimental biliary atresia. American
Journal of Physiology - Gastrointestinal and Liver Physiology. 2008; 295:
G16-G26.
57. Livak KJ, Schmittgen TD. Analysis of relative gene expression data using
real-time quantitative PCR and the 2(-Delta Delta C(T)) Method. Methods.
2001; 25: 402-8.