Increased levels of serum protein complexes are associated with type 2 diabetes
Bạn đang xem bản rút gọn của tài liệu. Xem và tải ngay bản đầy đủ của tài liệu tại đây (632.57 KB, 7 trang )
Int. J. Med. Sci. 2018, Vol. 15
Ivyspring
International Publisher
210
International Journal of Medical Sciences
2018; 15(3): 210-216. doi: 10.7150/ijms.22517
Research Paper
Increased Levels of Serum Protein Complexes Are
Associated with Type 2 Diabetes
Yujie Liu1, Yunpeng Wu1, Yanmin Wang2, Mo Zhang1, and Zhili Li1
1.
2.
Department of Biophysics and Structural Biology, Institute of Basic Medical Sciences, Chinese Academy of Medical Sciences & School of Basic Medicine,
Peking Union Medical College, Beijing 100005, PR China
Department of Clinical Laboratory, Heze Municipal Hospital, Shandong 274031, PR China
Corresponding author: Zhili Li, Department of Biophysics and Structural Biology, Institute of Basic Medical Sciences, Chinese Academy of Medical Sciences
& School of Basic Medicine, Peking Union Medical College, 5 Dongdan San Tiao, Beijing 100005, PR China. Tel/Fax: +86 10 69156479; E-mail:
© Ivyspring International Publisher. This is an open access article distributed under the terms of the Creative Commons Attribution (CC BY-NC) license
( See for full terms and conditions.
Received: 2017.08.24; Accepted: 2017.11.23; Published: 2018.01.01
Abstract
Objective: To screen novel biomarkers in the levels of protein complexes for type 2 diabetes
mellitus (T2DM).
Methods: Serum immunoinflammation-related protein complexes (IIRPCs) and diabetes-related
protein complexes (DRPCs) in 1537 serum samples including 504 healthy controls, 320 patients
with prediabetes, and 713 patients with T2DM were analyzed using an optimized native
polyacrylamide gel electrophoresis (native-PAGE).
Results: Seven patterns of serum IIRPCs and four patterns of serum DRPCs were observed in the
study population, respectively. Significant increase in the levels of serum IIRPCs in T2DM was
detected relative to healthy controls. Change trends of serum DRPCs are as below: patients with
T2DM>patients with prediabetes> healthy controls.
Conclusion: Our findings suggest that increased levels of serum IIRPCs and DRPCs were
associated with T2DM.
Key words: protein complex; diabetes-related protein complex; type 2 diabetes
Introduction
Diabetes mellitus, especially for type 2 diabetes
mellitus(T2DM), is a chronic, incurable disease, and
the efforts of a number of investigators have been
made to probe pathogenetic mechanisms and therapy
of T2DM [1]. Major factors, such as obesity, pancreas
β-cell dysfunction, mitochondrial dysfunction, and
oxidative stress, are closely associated with T2DM [2].
It is found that low-grade inflammation and the
activation of innate immune system are closely related
to the pathogenesis of T2DM[3-5].The levels of
circulating inflammatory markers, such as C reactive
protein(CRP), α-1 acid glycoprotein, amyloid A, IL-6,
and IL-1Ra, significantly elevated in patients with
T2DM[6-8].
Previous studies have shown that protein
complexes are potential indicators of many diseases.
Trypsin 2–α 1 antitrypsin complex displayed a better
diagnostic performance than trypsinogen 2 and CRP
in differentiating acute pancreatitis from extrapancreatic disease [9], and myeloid-related protein 8/14
complex is a sensitive indicator of disease activity
[10].
Circulating
immunoinflammation-related
protein complexes (IIRPCs) are closely associated
with chronic diseases [11]. To date, the correlations
between serum IIRPCs and T2DM have not been
investigated.
Quantification of known protein complexes is
usually
performed
using
radioimmunoassy,
immunofluorescence assay, or enzyme-linked
immunosorbent assay [12-14]. Blue native gel and
high resolution clear native gel are powerful
approaches to isolate protein complexes [15, 16].
Herein, an optimized native polyacrylamide gel
electrophoresis (native-PAGE) was employed to
Int. J. Med. Sci. 2018, Vol. 15
isolate protein complexes of interest in 1537 serum
samples. Based on the position distributions of the gel
bands of the protein complexes of interest in gel, two
types of serum protein complexes are observed in this
study, i.e., IIRPCs [11, 17] and diabetes-related protein
complexes (DRPCs).
Materials and Methods
Participants
In this study, 1537 participants were recruited
from the medical examination center, Heze Municipal
Hospital (Shandong, China). These participants were
classified into three groups (i.e., healthy controls,
patients with prediabetes, and patients with T2DM)
based on the levels of the overnight fasting plasma
glucose (FPG) as described by the criteria of the
American Diabetes Association[18]. Informed consent
was obtained from each participant. Serum was
collected according to a previously described
standard procedure [11]. This study was approved by
the Ethics Review Committee at the Institute of Basic
Medical Sciences, Chinese Academy of Medical
Sciences within which the work was undertaken and
that it conforms to the provisions of the Declaration of
Helsinki.
Native-PAGE separation
The protein complexes of interest were isolated
using our own previous procedure with slight
modifications [11, 19]. Briefly, 4%-10% linear gradient
acrylamide gel and 4% acrylamide gel were used as
separating gel and stacking gel, respectively. 2 μL of
serum sample mixed with 8 μL 1×native loading
buffer (25% v/v 50 mM Tris-HCl pH 7.5; 50% v/v
glycerol; 0.1% w/v XYlenecyanol FF) was loaded into
one lane of gel. Each gel was run at 10 mA for 1.5 h,
followed by 25 mA for 3 h. The gels were stained with
Coomassie brilliant blue G-250, and then the
background was destained in deionized water.
Optical image was obtained using an UMAX
PowerLook 2100XL scanner (UMAX Technologies,
Dallas, TX, USA) for optical densitometry-based
quantification, and then the optical densitometry (i.e.,
gray value) was quantified using Quantity One
software (version 4.6.3, Bio-Rad).
Quantification of serum protein complexes of
interest
Nine serum samples and one quality control
(QC) serum sample were loaded into ten lanes of one
native-PAGE gel, respectively. The QC sample was a
mixture of three control sera. The gel image was
introduced into Quantity One software, and the levels
of serum protein complexes of interest were
calculated using the following formula: the level of
211
protein complex= gray value of gel band-gray value
of gel background. The level of serum
transferrin-related protein complex (TRPC) in each
serum sample was quantified relative to that of the
QC sample. The levels of serum protein complexes of
interest were quantified relative to that of serum
TRPC which is normalized to 100[11]. To evaluate the
reproducibility of this method, four serum samples
(i.e., the QC sample, one control, one patient with
prediabetes, and one patient with T2DM) were used
to examine intraday and interday precision of the
method.
Identification of serum protein complexes of
interest
Each gel band in native-PAGE gel was
transferred into a 0.6 mL eppendorf tube, followed by
the incubation for 45 min at room temperature in the
equilibrium buffer (93.8 mM Tris-HCl, pH 6.8, 10%
v/v glycerol, 2% w/v sodium dodecyl sulfate)
including 3% (w/v) dithiothreitol, and then the band
was incubated for 35 min at room temperature in the
above-mentioned equilibrium buffer with 10% (w/v)
iodoracetamide. The gel band was further separated
using sodium dodecyl sulfate-PAGE. Each gel was
run at 60 V for 1 h, followed by 120 V for 2 h. Gel
bands from the sodium dodecyl sulfate-PAGE gel
were excised and digested followed by the
identification of the proteins of interest as described
previously [11].
Statistical analysis
Normal distribution of variables was evaluated
by Shapiro-Wilk test, and categorical variables were
analyzed using Pearson χ2 test. Student’s t test or
Mann−Whitney U test was used to compare the
differences between two groups. The variables of
subjects were compared among three groups using
Kruskal-Wallis test. Receiver operating characteristic
(ROC) curve analysis was performed to evaluate
diagnostic performance. Statistical analysis was
performed using the SAS software (version 9.2, SAS
Institute Inc., Cary, NC, USA). A p-value less than 0.05
was considered to be statistically significant based on
two-tailed tests.
Results
Linear dynamic range and reproducibility
To explore an appropriate loading volume of
serum sample, different volumes of serum from 0.2
μL to 3 μL were loaded into different lanes in one
native-PAGE gel to evaluate linear dynamic range.
Finally, linear correlation coefficient (R2=0.977) was
found over the range of 0.2 μL to 2.5 μL, and for
thyroglobulin (Sigma-Aldrich, St, Louis, MO), linear
Int. J. Med. Sci. 2018, Vol. 15
correlation coefficient (R2=0.981) was detected over
the range of 0.1μg to 2.5μg. The reproducibility of the
method was also assessed based on the four serum
samples, with relative standard deviations (RSDs) of
intraday precision from 4.3% to 17.5% and of interday
precision from 5.0% to 19.3% for serum protein
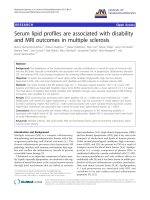
complexes: TRPC, a3, b4, T1, and T2 (Figure 1).
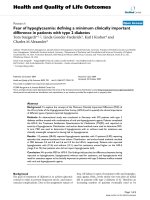
Figure 1. Serum protein complex separation by the optimized
native-PAGE gel. (A) Seven patterns (i.e., a, b, c, d, e, f, and g) of serum
immunoinflammation-related protein complexes (IIRPCs). (B) Six patterns (i.e.,
1, 2, 3, 4, 5, and 6) of serum diabetes-related protein complexes (DRPCs).
Quantification of serum TRPC
Ninety one serum samples (i.e., 20 healthy
controls, 20 patients with prediabetes, and 51 patients
with T2DM) were excluded due to the aberrant
expression of serum TRPC. Finally, 1446 serum
samples were used for further analysis, including 484
controls, 300 patients with prediabetes, and 662
patients with T2DM (Table 1). To investigate whether
serum TRPC is an internal reference to quantify serum
protein complexes of interest, the relationships
between its level and several other variables (i.e., sex,
age, patterns, and health status) were analyzed.
Statistical analysis indicated that the level of serum
TRPC in 1446 serum samples has no statistical
significance (p>0.05, Table 2), indicating that serum
TRPC could be used as an internal reference to
quantify serum protein complexes of interest.
Association of serum IIRPCs with pathological
status
Seven major patterns (a, b, c, d, e, f, and g) of
serum IIRPCs in 1446 serum samples were observed
based on their native-PAGE gels (Figure 1A), which is
212
consistent with our previous study [11]. Each of these
patterns accounts for approximately 34% (n=498), 32%
(n =456), 17% (n=244), 8% (n=110), 2% (n=36), 5%
(n=71), and 2% (n=31), respectively (Figure 1A). For
pattern a, we assigned four specific IIPRCs (a1, a2, a3,
and a4); for pattern b, five specific IIRPCs (b1, b2, b3,
b4, and b5); for pattern c, no specific IIRPCs; for
pattern d, three specific IIRPCs (d1, d2, and d3); for
pattern e, three specific IIRPCs (e1, e2, and e3); for
pattern f, five specific IIRPCs (f1, f2, f3, f4, and f5); for
pattern g, seven specific IIRPCs (g1, g2, g3, g4, g5, g6,
and g7). Due to limited sample sizes of patterns d, e, f,
and g, as well as pattern c without specific IIRPCs, we
only selected patterns a and b for further analysis in
this study. Representative protein complex a3 in
pattern a and b4 in pattern b were selected to
investigate the relationships between their levels and
pathological status (Table 3). Statistical analysis
indicated that the levels of a3 and b4 in T2DM patients
significantly
increased
compared
with
the
corresponding controls (p<0.05). However, no
difference was detected between patients with
prediabetes and controls (Figure 2A &2B). In
addition, the components of serum IIRPCs were
separated by SDS-PAGE, followed by the
identification using mass spectrometry, and they are
immunoglobulin
G1,
immunoglobulin
A1,
haptoglobin, complement C3, complement C4A,
complement C5, complement C7, complement factor
H, transferrin, and apolipoprotein A-I, which is
consistent with our previous study[11].
Table 1. Characteristics of the participants in this study
Characteristics
Sex(M/F)
Age(years)
Glucose(mmol/L)
Patterns of serum DRPCs
1
2
3
4
Controls
n=484
227/257
46.6±16.4
4.9±0.4
Prediabetes
n=300
172/128
50.9±13.9
6.4±0.4
T2DM
n=662
326/336
53.4±12.7
9.8±3.1
193
53
218
20
102
64
127
7
214
181
250
17
Data are described as mean ± SD (standard deviation) or numbers.
Association of serum DRPCs with pathological
status
Six major patterns (1, 2, 3, 4, 5, and 6) of serum
DRPCs in 1446 serum samples were detected based on
their native-PAGE gels (Figure 1B). For patterns 1, 2,
3, 5, and 6, two gel bands corresponding to serum
protein complexes (T1 and T2) were clearly observed
with slight differences in their gray values, while for
pattern 4 both T1 and T2 were not detected. In order
to simplify statistical analysis, we redefined these
Int. J. Med. Sci. 2018, Vol. 15
213
patterns based on the ratio of T2 to T1 (T2/T1).
According to the following ratio values: 0.5<T2/T1<
2, T2/T1≧2, and T2/T1≦0.5, the patterns of serum
DRPCs were reclassified into patterns 1, 2, and 3.
Finally, the six patterns were reclassified into
patterns1, 2, 3, and 4 (Figure 1B and Table 1). The
detailed information on the age- and sex-matched
participants is listed in Table 4.
Table 2. Association of serum TRPC level with health status, sex, age, and patterns of serum DRPCs
Characteristics
Health status
Sex
Female
Male
Age(years)
<60
>=60
Patterns of serum DRPCs
1
2
3
4
Level
1.02±0.07
Controls(n=484)
p value¶
Level
1.01±0.07
Prediabetes(n=300)
P value¶
0.608
Level
1.01±0.07
T2DM (n=662)
P value¶
0.362
1.02±0.07
1.02±0.07
0.992
1.01±0.07
1.02±0.07
0.771
1.01±0.07
1.01±0.07
0.133
1.02±0.07
1.02±0.07
0.280
1.01±0.06
1.02±0.07
0.143
1.01±0.07
1.02±0.07
0.495
1.02±0.08
1.04±0.08
1.02±0.07
1.02±0.07
0.571
1.00±0.05
1.02±0.05
1.01±0.07
1.02±0.07
0.861
1.05±0.10
0.01±0.06
1.01±0.07
1.03±0.08
0.131
Data are described as mean ± SD (standard deviation); TRPC, transferrin-related protein complex.
¶ Pearson χ2 test for sex variable and Kruskal-Wallis test for types and age variables. All statistical tests were two-sided.
Table 3. Characteristics of the age- and sex-matched participants in patterns a and b of serum IIRPCs
Controls
n=148
75/73
49.7±15.9
4.9±0.5
20.8±13.1
ND
Characteristics
Sex(M/F)
Age(years)
Glucose(mmol/L)
a3
b4
Prediabetes
n=108
64/44
50.7±14.3
6.4±0.4
23.3±13.3
ND
Pattern a
p value¶
0.102
P value¶
T2DM
n=185
93/92
51.5±12.8
9.8±2.9
26.0±16.8
ND
0.212
0.338
0.004
Controls
n=131
58/73
49.6±14.8
4.9±0.5
ND
17.2±11.3
Pattern b
p value¶
Prediabetes
n=97
45/52
51.0±15.1
6.4±0.4
ND
21.3±17.3
0.090
T2DM
n=173
80/93
52.0±12.7
9.8±3.4
ND
21.7±14.5
p value¶
0.574
0.266
0.013
Data are described as mean ± SD or numbers.
¶ Pearson χ2 test for sex and Kruskal-Wallis test for age and Mann-Whitney U test for serum protein complexes a3 and b4 of prediabetes and diabetes and controls. All
statistical tests are two-sided.
ND, no data.
Table 4. Characteristics of the age- and sex-matched participants in patterns 1, 2, and 3 of serum DRPCs
Controls
Characteristics
n=180
Sex(M/F)
92/88
Age(years)
51.2±15.3
Glucose(mmol/L) 4.9±0.4
T1
11.7±7.6
T2
10.3±7.6
Pattern 1
Prediabetes
T2DM
n=102
n=185
55/47
92/93
51.5±14.1
53.9±13.4
6.4±0.4
9.8±3.0
18.0±9.6
23.7±13.9
15.5±9.4
21.7±15.6
P value¶
0.744
0.082
<0.001
<0.001
Controls
n=50
20/30
53.1±16.6
5.0±0.4
ND
16.5±9.3
Pattern 2
Prediabetes
T2DM
n=59
n=181
34/25
86/95
54.6±11.4
53.7±10.5
6.6±0.2
10.0±3.0
ND
ND
40.7±17.1
51.8±20.7
p value¶
0.517
0.961
<0.001
Controls
n=165
78/87
47.3±15.3
4.9±0.4
13.1±6.2
ND
Pattern 3
Prediabetes
T2DM
n=127
n=210
72/55
105/105
47.7±14.3
48.9±13.4
6.3±0.4
9.9±3.5
22.3±10.6
25.5±12.9
ND
ND
P value¶
0.268
0.313
<0.001
Data are described as mean ± SD or numbers.
¶ Pearson χ2 test for sex and Kruskal-Wallis test for age and serum protein complexes T1 and T2. All statistical tests are two-sided.
ND, no data.
Table 5. Diagnostic performance of serum DRPCs in different patterns
Patterns
DRPCs
Groups
1
T1
1
T2
2
T2
3
T1
Controls vs. prediabetes
Controls vs. T2DM
Prediabetes vs. T2DM
Controls vs. prediabetes
Controls vs. T2DM
Prediabetes vs. T2DM
Controls vs. prediabetes
Controls vs. T2DM
Prediabetes vs. T2DM
Controls vs. prediabetes
Controls vs. T2DM
Prediabetes vs. T2DM
AUC
0.71
0.77
0.61
0.70
0.78
0.61
0.93
0.94
0.59
0.76
0.82
0.57
95% CI
0.65-0.77
0.73-0.82
0.54-0.67
0.64-0.76
0.73-0.82
0.54-0.68
0.88-0.98
0.91-0.97
0.50-0.67
0.70-0.81
0.78-0.86
0.51-0.63
Cut-off
value
11.79
42.14
37.35
7.89
6.73
11.61
11.52
65.91
55.97
40.10
8.61
11.75
Sensitivity
Specificity
70.00%
87.78%
64.71%
68.33%
71.11%
68.63%
86.00%
94.00%
86.28%
89.70%
89.09%
34.29%
63.73%
58.38%
57.84%
64.71%
72.43%
50.81%
92.16%
80.66%
32.04%
53.54%
64.29%
65.71%
AUC, area under the receiver operating characteristic curve; CI, confidence interval.
Int. J. Med. Sci. 2018, Vol. 15
214
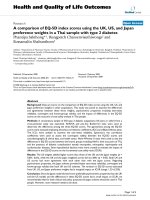
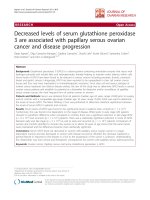
Figure 2. Scatter plots of protein complexes: a3, b4, T1, and T2 in serum samples from healthy controls, patients with prediabetes, and patients
with T2DM. (A) The level of a3; (B) The level of b4; (C) The level of T1 in pattern 1; (D) The level of T2 in pattern 1; (E) The level of T2 in pattern 2; (F) The level
of T1 in pattern 3.* **, p < 0.001; **, p < 0.01; *, p <0.05.
As shown in Figure 2C-D, for pattern 1, the
levels of serum T1 and T2 in patients with T2DM
remarkably increased compared with patients with
prediabetes and controls, and significant increase in
the levels of serum T1 and T2 in patients with
prediabetes were detected compared with controls.
For pattern 2, significantly increased level of serum T2
in patients with prediabetes and patients with T2DM
was observed compared with controls (Figure 2E),
and no difference was detected between prediabetes
and T2DM. For pattern 3, the level of serum T1 in
patients with T2DM significantly increased relative to
patients with prediabetes and controls. Additionally,
significant difference was also observed between
patients with prediabetes and controls (Figure 2F).
ROC curve analysis indicated that serum T2 in pattern
2 had an excellent diagnostic performance on
distinguishing patients with prediabetes and T2DM
from controls, with the area under the ROC curve
(AUC) of 0.93 and 0.94, respectively. It is worth noting
that T1 and/or T2 from patterns 1, 2, or 3 had a similar
capability of distinguishing prediabetes from T2DM,
with the AUC values from 0.57 to 0.61. More
information of ROC analysis is shown in Table 5. In
addition, the components of serum T1 and T2 were
separated using the sodium dodecyl sulfate-PAGE,
followed by identification using mass spectrometry.
The components are inter-alpha-trypsin inhibitor
Int. J. Med. Sci. 2018, Vol. 15
heavy chain H1 and H2, complement C3 β-subunit,
haptoglobin β-subunit, and apolipoprotein A-I.
Discussion
In this study, serum protein complexes of
interest were isolated using the optimized
native-PAGE approach. According to the linear
dynamic range of the loading serum volume, it was
found that 2 μL of serum is an appropriate loading
volume for electrophoresis separation. The RSDs of
intraday and interday precision were less than 20%,
indicating that the method is acceptable for complex
biological sample analysis. It should be noted that
serum TRPC is an internal reference to quantify serum
protein complexes of interest.
The main components of serum IIRPCs are
immunoglobulin
G1,
immunoglobulin
A1,
haptoglobin, complement C3, complement C4A,
complement C5, complement C7, complement factor
H, transferrin, and apolipoprotein A-I, which are
immunity-related proteins, inflammation-related
proteins, and complement-related proteins. Previous
studies have indicated that serum IIRPCs are closely
associated with cancers, chronic diseases, and the
development of lung cancer [11, 17], suggesting that
they may be excellent indicators of humoral immune
responses and inflammatory responses. In this study,
serum IIRPCs in patients with T2DM also increased
compared with controls, but no difference in between
controls and patients with prediabetes and in between
prediabetes and T2DM was detected, suggesting that
serum IIRPCs may be closely associated with T2DM.
The main components of serum DRPCs are
complement C3-β subunit, inter-alpha-trypsin
inhibitor heavy chain H1 and H2, haptoglobin β
subunit, and apolipoprotein A-I. Some of them are
inflammation-related
proteins
and
complement-related proteins. All serum samples from
1446 participants were classified into four patterns
based on the position distributions of serum DRPCs
(T1 andT2) in their native-PAGE gels. The levels of
serum DRPCs had a positive correlation with blood
glucose levels in an order of patients with T2DM>
patients with prediabetes>healthy controls. More
importantly, significant increase in the levels of serum
DRPCs may be closely associated with the
development of T2DM. Previous studies have shown
that circulating inflammatory factors and innate
immune cells-related activated factors elevated in
patients with T2DM[4, 20-22], including α-1 acid
glycoprotein, sialic acid, IL-6, and urinary albumin,
especially for CRP, which plays an important role in
diabetes mellitus and diabetic complications[23-25].
Complement C3, a central component of complement
system, is closely associated with inflammatory
215
response, and the incorporation of C3 into clot from
diabetic fibrinogen is enhanced in patients with type 1
diabetes [26]. A large cohort study has indicated that
complement C3 is a risk factor to develop diabetes
[27]. Inter-alpha-trypsin inhibitor (ITI or IαI) is
composed of one light chain and six heavy chains (H1,
H2, H3, H4, H5, and H5L) [28]. In this study, H1 and
H2 were detected. IαI is involved in inflammation and
complement activation [29-31]. Haptoglobin is one of
the most important acute phase proteins, the
genotype of which might play a very important role in
diabetes and diabetic complications [32-36].
Apolipoprotein A-I, a principal protein in
high-density
lipoprotein
(HDL),
has
an
anti-inflammatory function [37]. In addition,
apolipoprotein A-I can interact with haptoglobin to
form protein complex [38, 39]. All above-mentioned
studies indicate that serum DRPCs may be associated
with inflammatory responses and may play a crucial
role in the development of T2DM.
There were some meaningful findings and
limitations in this study. First, we used a simple and
economic gel separation method to obtain
diabetes-related protein complexes in serum. Second,
serum IIRPCs are not only associated with cancers,
chronic diseases, and the development of lung cancer,
but also closely associated with T2DM. Third, all
serum samples could be classified into four types
based on the patterns of serum DRPCs. Significantly
increased levels of serum DRPCs were correlated with
prediabetes and T2DM, indicating that serum DRPCs
may be unique, personalized biomarkers for T2DM.
In addition, it should be noted that the mechanisms
need to be further confirmed, and that the factors,
such as height, weight, waist circumference, hip
circumference, and blood pressure should be included
in the future study.
Conclusions
The optimized native-PAGE approach combined
with mass spectrometry was used to separate and
identify serum protein complexes from controls,
patients with prediabetes, and patients with T2DM.
All participants could be classified into four and seven
groups based on serum DRPCs and IIRPCs,
respectively. The levels of serum DRPCs in patients
with prediabetes and T2DM increased compared with
controls. Our findings suggest that increased levels of
serum IIRPCs and DRPCs were associated with
T2DM.
Abbreviations
IIRPCs: immunoinflammation-related protein
complexes;
DRPCs:
diabetes-related
protein
complexes;
TRPC:
transferrin-related
protein
Int. J. Med. Sci. 2018, Vol. 15
216
complex; T2DM: type 2 diabetes mellitus; FPG: fasting
plasma glucose; QC: quality control; CRP: C reactive
protein; PAGE: polyacrylamide gel electrophoresis;
ROC: receiver operating characteristic.
Acknowledgement
Competing Interests
References
3.
4.
5.
6.
8.
.
.
.
.
.
.
.
9.
.
10.
.
11.
.
12.
13.
.
.
.
.
Stumvoll M, Goldstein BJ, van Haeften TW Type 2 diabetes: principles of
pathogenesis and therapy. Lancet 2005,365: 1333-1346.
Stumvoll M, Goldstein BJ, van Haeften TW Pathogenesis of type 2 diabetes.
Endocr Res 2007,32: 19-37.
Pickup JC Inflammation and activated innate immunity in the pathogenesis of
type 2 diabetes. Diabetes Care 2004,27: 813-823.
Donath MY, Shoelson SE Type 2 diabetes as an inflammatory disease. Nat Rev
Immunol 2011,11: 98-107.
Akash MS, Rehman K, Chen S Role of inflammatory mechanisms in
pathogenesis of type 2 diabetes mellitus. J Cell Biochem 2013,114: 525-531.
Dehghan A, Kardys I, de Maat MP, Uitterlinden AG, Sijbrands EJ, Bootsma
AH, Stijnen T, Hofman A, Schram MT, Witteman JC Genetic variation,
C-reactive protein levels, and incidence of diabetes. Diabetes 2007,56: 872-878.
Pickup JC, Mattock MB, Chusney GD, Burt D NIDDM as a disease of the
innate immune system: association of acute-phase reactants and interleukin-6
with metabolic syndrome X. Diabetologia 1997,40: 1286-1292.
Herder C, Brunner EJ, Rathmann W, Strassburger K, Tabak AG, Schloot NC,
Witte DR Elevated levels of the anti-inflammatory interleukin-1 receptor
antagonist precede the onset of type 2 diabetes: the Whitehall II study.
Diabetes Care 2009,32: 421-423.
Hedstrom J, Sainio V, Kemppainen E, Haapiainen R, Kivilaakso E, Schroder T,
Leinonen J, Stenman U-H Serum complex of trypsin 2 and (alpha)(sub 1)
antitrypsin as diagnostic and prognostic marker of acute pancreatitis: clinical
study in consecutive patients. BMJ 1996,313: 333-337.
Holzinger D, Frosch M, Kastrup A, Prince FHM, Otten MH, Van
Suijlekom-Smit LWA, Cate Rt, Hoppenreijs EPAH, Hansmann S, Moncrieffe
H, Ursu S, Wedderburn LR, Roth J, Foell D, Wittkowski H The Toll-like
receptor 4 agonist MRP8/14 protein complex is a sensitive indicator for
disease activity and predicts relapses in systemic-onset juvenile idiopathic
arthritis. Ann Rheu Dis 2012,71: 974-980.
Wang Y, Song G, Wang Y, Qiu L, Qin X, Liu H, Li F, Wang X, Li F, Guo S,
Elevated
serum
levels
of
circulating
Zhang
Y,
Li
Z
immunoinflammation-related protein complexes are associated with cancer. J
Proteome Res 2014,13: 710-719.
Teitel J, Bauer K, Lau H, Rosenberg R Studies of the prothrombin activation
pathway utilizing radioimmunoassays for the F2/F1 + 2 fragment and
thrombin--antithrombin complex. Blood 1982,59: 1086-1097.
Lempinen M, Stenman UH, Halttunen J, Puolakkainen P, Haapiainen R,
Kemppainen E Early sequential changes in serum markers of acute
pancreatitis induced by endoscopic retrograde cholangiopancreatography.
Pancreatology 2005,5: 157-164.
Kim J, Bhattacharjee R, Snow AB, Capdevila OS, Kheirandish-Gozal L, Gozal
D Myeloid-related protein 8/14 levels in children with obstructive sleep
apnoea. Eur Respir J 2010,35: 843-850.
Schagger H, von Jagow G Blue native electrophoresis for isolation of
membrane protein complexes in enzymatically active form. Anal Biochem
1991,199: 223-231.
Wittig I, Karas M, Schagger H High resolution clear native electrophoresis for
in-gel functional assays and fluorescence studies of membrane protein
complexes. Mol Cell Proteomics 2007,6: 1215-1225.
Song G, Liu Y, Wang Y, Ren G, Guo S, Ren J, Zhang L, Li Z Personalized
biomarkers to monitor disease progression in advanced non-small-cell lung
cancer patients treated with icotinib. Clin Chim Acta 2015,440: 44-48.
Santos CR, Schulze A Lipid metabolism in cancer. Febs Journal 2012,279:
2610-2623.
Chen G, Luo Y, Wang X, Zhao Z, Liu H, Zhang H, Li Z A relatively simple and
economical protocol for proteomic analyses of human 20S proteasome:
Compatible with both scaled-up and scaled-down purifications.
Electrophoresis 2009,30: 2422-2430.
Pickup JC, Crook MA Is Type II diabetes mellitus a disease of the innate
immune system? Diabetologia 1998,41: 1241-1248.
.
7.
.
.
The authors have declared that no competing
interest exists.
2.
.
.
This study was funded by the Capital Medical
Research Development Found of China (Grant No.
2016-1-2031).
1.
21. Lontchi-Yimagou E, Sobngwi E, Matsha T, Kengne A Diabetes Mellitus and
Inflammation. Current Diabetes Reports 2013,13: 435-444.
22. Kolb H, Mandrup-Poulsen T An immune origin of type 2 diabetes?
Diabetologia 2005,48: 1038-1050.
23. Pradhan AD, Manson JE, Rifai N, Buring JE, Ridker PM C-reactive protein,
interleukin 6, and risk of developing type 2 diabetes mellitus. JAMA 2001,286:
327-334.
24. Linnemann B, Voigt W, Nobel W, Janka HU C-Reactive Protein is a Strong
Independent Predictor of Death in Type 2 Diabetes: Association with Multiple
Facets of the Metabolic Syndrome. Exp Clin Endocrinol Diabetes 2006,114:
127-134.
25. Freeman DJ, Norrie J, Caslake MJ, Gaw A, Ford I, Lowe GDO, O’Reilly DSJ,
Packard CJ, Sattar N C-Reactive Protein Is an Independent Predictor of Risk
for the Development of Diabetes in the West of Scotland Coronary Prevention
Study. Diabetes 2002,51: 1596-1600.
26. Hess K, Alzahrani SH, Mathai M, Schroeder V, Carter AM, Howell G, Koko T,
Strachan MWJ, Price JF, Smith KA, Grant PJ, Ajjan RA A novel mechanism for
hypofibrinolysis in diabetes: the role of complement C3. Diabetologia 2012,55:
1103-1113.
27. Engström G, Hedblad B, Eriksson K-F, Janzon L, Lindgärde F Complement C3
Is a Risk Factor for the Development of Diabetes: A Population-Based Cohort
Study. Diabetes 2005,54: 570-575.
28. Zhuo L, Kimata K Structure and Function of Inter-α-Trypsin Inhibitor Heavy
Chains. Connective Tissue Research 2008,49: 311-320.
29. Garantziotis S, Hollingsworth JW, Ghanayem RB, Timberlake S, Zhuo L,
Kimata K, Schwartz DA Inter-alpha-trypsin inhibitor attenuates complement
activation and complement-induced lung injury. J Immunol 2007,179:
4187-4192.
30. Daveau M, Rouet P, Scotte M, Faye L, Hiron M, Lebreton JP, Salier JP Human
inter-alpha-inhibitor family in inflammation: simultaneous synthesis of
positive and negative acute-phase proteins. Biochem J 1993,292 ( Pt 2): 485-492.
31. Choi-Miura NH, Takahashi K, Yoda M, Saito K, Hori M, Ozaki H, Mazda T,
Tomita M The novel acute phase protein, IHRP, inhibits actin polymerization
and phagocytosis of polymorphonuclear cells. Inflammation Research 2000,49:
305-310.
32. Xiaohong Shi LS, Li Wang, Feng Jin, Junfeng Sun, Xiaoquan Zhu, Lei Tang,
Yanchun Qu, and Ze Yang Haptoglobin 2-2 Genotype Is Associated with
Increased Risk of Type 2 Diabetes Mellitus in Northern Chinese. Genetic
Testing and Molecular Biomarkers 2012,16: 563-568.
33. Mustafa S, Vukovich T, Prikoszovich T, Winzer C, Schneider B, Esterbauer H,
Wagner O, Kautzky-Willer A Haptoglobin phenotype and gestational
diabetes. Diabetes Care 2004,27: 2103-2107.
34. Kruger AJ, Yang C, Tam SW, Hinerfeld D, Evans JE, Green KM, Leszyk J, Yang
K, Guberski DL, Mordes JP, Greiner DL, Rossini AA, Bortell R Haptoglobin as
an early serum biomarker of virus-induced autoimmune type 1 diabetes in
biobreeding diabetes resistant and LEW1.WR1 rats. Experimental Biology and
Medicine 2010,235: 1328-1337.
35. Costacou T, Levy AP Haptoglobin genotype and its role in diabetic
cardiovascular disease. J Cardiovasc Transl Res 2012,5: 423-435.
36. Costacou T, Ferrell RE, Ellis D, Orchard TJ Haptoglobin genotype and renal
function decline in type 1 diabetes. Diabetes 2009,58: 2904-2909.
37. Murphy AJ, Hoang A, Aprico A, Sviridov D, Chin-Dusting J
Anti-Inflammatory Functions of Apolipoprotein A-I and High-Density
Lipoprotein Are Preserved in Trimeric Apolipoprotein A-I. Journal of
Pharmacology and Experimental Therapeutics 2013,344: 41-49.
38. Spagnuolo MS, Cigliano L, Abrescia P The binding of haptoglobin to
apolipoprotein AI: influence of hemoglobin and concanavalin A. Biol Chem
2003,384: 1593-1596.
39. Salvatore A, Cigliano L, Bucci EM, Corpillo D, Velasco S, Carlucci A, Pedone
C, Abrescia P Haptoglobin Binding to Apolipoprotein A-I Prevents Damage
from Hydroxyl Radicals on Its Stimulatory Activity of the Enzyme
Lecithin-Cholesterol Acyl-Transferase†. Biochemistry 2007,46: 11158-11168.
.
.
.
.
.
.
.
.
.
.
.
.
.
14.
.
15.
16.
17.
18.
19.
20.
.
.
.
.
.
.