Forecasting Value at Risk: Evidence from Emerging Economies in Asia
Bạn đang xem bản rút gọn của tài liệu. Xem và tải ngay bản đầy đủ của tài liệu tại đây (1.37 MB, 14 trang )
TẠP CHÍ PHÁT TRIỂN KHOA HỌC & CÔNG NGHỆ:
CHUYÊN SAN KINH TẾ - LUẬT VÀ QUẢN LÝ, TẬP 2, SỐ 1, 2018
77
Forecasting Value at Risk: Evidence from
Emerging Economies in Asia
Le Trung Thanh, Nguyen Thi Ngan, Hoang Trung Nghia
Abstract—In this paper, various Value-at-Risk
techniques are applied to stock indices of 9 Asian
emerging financial markets. The results from our
selected models are then backtested by Unconditional
Coverage,
Independence,
Joint
Tests
of
Unconditional Coverage and Independence and Basel
tests to ensure the quality of Value-at-Risk (VaR)
estimates. The main conclusions are: (1) Timevarying volatility is the most important characteristic
of stock returns when modelling VaR; (2) Financial
data is not normally distributed, indicating that the
normality assumption of VaR is not relevant; (3)
Among VAR forecasting approaches, the backtesting
based on in- and out-of-sample evaluations confirms
its superiority in the class of GARCH models;
Historical Simulation (HS), Filtered Historical
Simulation (FHS), RiskMetrics and Monte Carlo
were rejected because of its underestimation (for HS
and RiskMetrics) or overestimation (for the FHS and
Monte Carlo); (4) Models under student’s t and skew
student’s t distribution are better in taking into
account financial data’s characters; and (5)
Forecasting VaR for futures index is harder than for
stock index. Moreover, results show that there is no
evidence to recommend the use of GARCH (1,1) to
estimate VaR for all markets. In practice, the HS and
RiskMetrics are popularly used by banks for large
portfolios, despite of its serious underestimations of
actual losses. These findings would be helpful for
financial managers, investors and regulators dealing
with stock markets in Asian emerging economies.
Keywords—Value at Risk, Forecast, Univariate
GARCH, Emerging Financial Markets.
Received: 21-8-2017, Accepted: 13-10-2017, Published: 157-2018.
Author Lê Trung Thành, Viet Duc University (email:
)
Author Nguyen Thi Ngan, University of Economics and
Law, VNUHCM, Viet Nam (e-mail: ).
Tác giả Hoàng Trung Nghĩa University of Economics and
Law, VNUHCM, Viet Nam (e-mail: ).
1 INTRODUCTION
A
FTER the market failure in 2008, the demand
for reliable quantitative measures in financial
sector becomes greater than ever. Not only
financial institutions but also investors are more
cautious in their investment decisions, leading to
an increased need for a more careful study of risk
measurements in stock markets. Value at Risk
(VaR) is currently the most popular and important
tool for evaluating market risk – one of major
threats to the global financial system. This tool
was developed and popularized in the early 1990s
by JPMorgan’s scientists and mathematicians
(“quants”). The VaR of portfolio is defined as the
dollar loss that is expected to be exceeded (100 –
X)% of the time over a fixed time interval. It is not
only considered as an acceptable risk measure by
corporations, asset managers but also the basis for
the estimation of capital requirements as regulated
by the Basel Committee on Banking Supervision
(BCBS). However, the VaR has received a great
deal of criticism after the outbreak of the 2008
global financial crisis owing to its inability in risk
forecasting [29]. The BCBS, in its 2011 review of
academic literature concerning risk measurement,
submitted the incoherence of VaR as a risk
measurement [12] and proposed expected shortfall
(ES) to replace VaR [13] on the third Basel
Accord. Nevertheless, none of these measures are
without drawbacks. The principal shortcoming of
ES is that it cannot be reliably backtested in the
sense that forecasts of expected shortfall cannot be
verified through comparison with historical
observations, while VaR is easily backtested. In
other words, expected shortfall is coherent but not
“elicitable”, while VaR is “elicitable” but not
coherent. This makes VaR hold a regulatory
advantage in measuring of risk relative to expected
shortfall. VaR allows investors to make investment
decisions by examining directions of market risk
by comparing the two VaR’s portfolios. The
78
SCIENCE & TECHNOLOGY DEVELOPMENT JOURNAL:
ECONOMICS - LAW AND MANAGEMENT, VOL 2, NO 1, 2018
Goldman Sachs’ success in avoiding impacts of
the 2007 subprime crisis is supposed to be owing
to the using of VaR [49]. VaR, therefore, is still
considered as the most important tool for
evaluation of market risk. The European
Commission (2014) has endorsed VaR, either as a
regulatory standard or as the best practice. Many
banks and financial institutions employ the
concept of “value at risk” as a way to measure the
risks of their portfolios.
There are multiple VaR methods used to
estimate possible losses of a portfolio whose
difference lies in calculating the density function
of those losses. The first one is Historical
Simulation (HS) which is non-parametric and
based on historical returns. This method contains
several critical disadvantages such as its
inconsistency in allocation of past shocks while
financial returns are highly influenced by time
dependence which can cause volatility clustering.
The error terms may reasonably be expected to be
larger for some points or ranges of the data than
for others (i.e. heteroskedasticity). Due to the
presence
of
heteroskedasticity,
regression
coefficients for an OSL regression are no longer
exact. To deal with this problem, a parametric
approach has been introduced. In the pioneering
paper, Engle introduced a method called the
ARCH model [30]. This methodology was later
developed by Bollerslev into GARCH (generalized
ARCH) (1986) and Student’s t-GARCH [16]. The
former is proved to be better in capturing the
inherent features of financial time series, namely
fat tailed returns or volatility clustering while the
latter shows that non-normalities can also be
captured by the GARCH models with a flexible
parametric error distribution. Despite the apparent
success of these simple parameterizations, the
initial GARCH model fails to capture an important
feature of the data. French et al, Nelson, Grouard
et al. and many others discovered this normal
model does not address the leverage or asymmetric
effect [35; 48; 37]. In particular, an unexpected
drop in price (bad news) increases predictable
volatility more than an unexpected increase in
price (good news) of similar magnitude. The
normal GARCH model over-predicts the amount
of volatility following good news and underpredicts the amount of volatility following bad
news. In addition, if large return shocks cause
more volatility than a quadratic function allows,
the standard GARCH model over-predicts
volatility after a small return shock and underpredicts volatility after a large return shock. As a
result, the GARCH model has been extended in
various directions in order to overcome these
characteristics of financial time series and to
increase the flexibility of the original model.
Among many extensions of GARCH, the most
widely used is that of Bollerslev, namely
GARCH(1,1) [16]. The survey by Bollerslev et al.
and the study of Engle and Ng. also supported that
the GARCH (1,1) is adequate for modeling many
high frequency time series data [17; 31].
To assess the risk of financial transactions,
estimates of asset return volatility is an important
factor and therefore the center of attention of risk
management techniques. Many VaR models for
measuring market risk require the estimation or
forecast of a volatility parameter. Since whoever
could forecast volatility changes more precisely
will be likely to better control the market risk,
accurate measures and reliable forecasts of
volatility are essential to numerous aspects of
finance and economics. Nowadays, the GARCH
model has become a widespread tool for
measuring volatility in financial decisions
concerning risk analysis, portfolio selection and
derivative pricing. Besides, a new generation of
VaR models which is based on the combination of
GARCH modelling (parametric) and historical
portfolio returns (non-parametric) is increasingly
used in risk management. Barone-Adesi et al. and
Barone-Adesi et al. propose FHS that can take into
account changes in past and current volatilities of
historical returns. Another increasingly popular
model is Monte Carlo [9; 10; 11].
Our study investigates the relative performance of
the different models in estimating and forecasting
VaR which appear to yield reliable results for the
US market as well as the emerging markets in
Asia. Because of the different nature of emerging
markets in relation to developed markets, one
could expect different results. Moreover, the
enormous growth of financial markets in the
emerging countries in recent years has prompted
the financial regulators and supervisory
committees to look for well-justified methods to
quantify risks. The aim of our study is to seek a
conclusion on the performance of the methods for
Asian emerging markets. The rest of this paper is
organized as follows. Section 2 reviews the
TẠP CHÍ PHÁT TRIỂN KHOA HỌC & CÔNG NGHỆ:
CHUYÊN SAN KINH TẾ - LUẬT VÀ QUẢN LÝ, TẬP 2, SỐ 1, 2018
literature on this subject. In Section 3 we will
explain concepts and theories of methodology
employed in this paper. We present details of the
data and empirical results obtained in Section 4
and conclusions are given in Section 5.
2 LITERATURE REVIEW
Because of its popularity, most empirical studies
use VaR as risk measure. In order to calculate the
VaR, one can choose HS, FHS, variancecovariance techniques and Monte Carlo
simulation. Following the pioneering papers of
Engle and Bollerslev, the use of VaR models is
increasing [30; 16]. A vast financial literature has
attempted to compare the accuracy of various
models for producing out-of-sample volatility
forecasts. However, those paper do not provide
conclusive results. For example, when comparing
VaR methodologies, the studies by Hendricks,
Beder, among others [39; 15], concluded that the
HS performed at least as well as more complex
methodologies, namely the parametric approach
(i.e. RiskMetrics, GARCH-normal, EGARCH, and
Student’s-t EGARCH) and the Monte Carlo
simulation. By considering the three most common
categories of VaR models (i.e. equally weighted
moving average, exponentially weighted moving
average, and HS), Hendricks
found these
approaches tend to produce risk estimates that do
not differ greatly in average size and none appears
to be superior [39]. Similar result in the study of
Beder who employed variance-covariance,
historical [15], and simulation VaRs suggests that
different VaR methodologies are appropriate for
different firms and depend on many factors. Study
by Le and Nguyen employed parametric [55], nonparametric and semi-parametric to estimate VaR
on 8 portfolios representative to emerging and
developed markets. They found that all models are
significant at 1% and 5% level and models with
normal distribution assuptioms fail in predicting
VaR. Ngo and Le used HS, GARCH and Cornish
Fisher to estimate VaR and ES on 9 portfolios of
Vietnam’s listed banks [56]. Results show that the
three models have equal performance. On the other
hand, more recent papers have reported that the HS
provides poor VaR estimates compared with other
recently developed methodologies. In particular,
Abad and Benito who compared several VaR
methods: HS, Monte Carlo simulation, parametric
methods and extreme value theory found that the
parametric methods estimate VaR at least as well
79
as other VaR methods that have been developed
recently (e.g. the models based on extreme value
theory), especially under an asymmetric
specification for the conditional volatility and the
Student’s-t innovations [2; 3]. This result is robust
with another sample and the confidence level of
VaR [1]). Additional studies that find evidence in
favor of parametric methods are Ñíguez, Sarma et
al., Daníelsson, Akgiray, West and Cho, Pagan and
Schwert, among others [38; 51; 26; 4; 58; 50].
Ñíguez provided an empirical study to assess the
forecasting performance of a wide range of models
in predicting volatility and VaR on Madrid Stock
Exchange and find that FIAPARCH and Studen’s-t
distribution (or another suitable heavy-tailed
distribution) should be considered when deciding
the models to include in the pool [38]. Daníelsson
investigated parametric approach (in particular the
normal and student’s-t GARCH) [26], HS and
extreme value theory models and find evidence in
favor of parametric methods. Akgiray compares
GARCH, ARCH, exponentially weighted moving
average and historical mean models in forecasting
monthly US stock index volatility and finds
GARCH model superior to the others [4]. The
study of West and Cho using one-step-ahead
forecasts of dollar exchange rate volatility
provided a similar result concerning the apparent
superiority of GARCH, although for longer
horizons, the model behaves no better than its
alternatives [58]. In another study, Pagan and
Schwert compared GARCH, EGARCH, Markov
switching regime and three non-parametric models
in forecasting volatilities on monthly US stock
returns. Results indicate that only EGARCH and
GARCH models perform moderately while the
other models produce very poor predictions [50].
When considering only parametric approach, the
results of various studies carried out so far are not
consistent. Drakes et al. modelled the return
volatility of stocks traded in the Athens Stock
Exchange using five classes of GARCH model
with alternative probability density functions for
error terms. They found that normal mixture
asymmetric GARCH (NM-GARCH) with skewed
student-t distribution performs better in modeling
the volatility of stock returns, based on Kupiec’s
Test. A similar result concerning the apparent
superiority of the asymmetric NN-GARCH is
observed by Alexander and Lazar who applies 15
different GARCH models using alternative density
80
SCIENCE & TECHNOLOGY DEVELOPMENT JOURNAL:
ECONOMICS - LAW AND MANAGEMENT, VOL 2, NO 1, 2018
function on three bilateral exchange rates, namely
sterling-dollar, euro-dollar and yen-dollar [6]. In
another study, Su concluded that EGARCH fits the
sample data better than GARCH in modelling the
volatility of China’s stock returns [53]. This
finding is further supported by Alberg et al. who
applied various GARCH models to analyze the
mean return and conditional variance on Tel Aviv
Stock Exchange (TASE) [5]. Results indicate that
asymmetric GARCH models with fat-tailed
densities (especially the EGARCH with skewed
Student-t distribution) are successful in forecasting
TASE indices. By using various European stock
market indices, Franses and Dijk found that nonlinear GARCH models (i.e. QGARCH and the
GJR) fail to outperform the standard GARCH in
forecasting the weekly volatility [34]. On the other
hand, the study of Brailsford and Faff (1996) on
Australian monthly stock index shows that GJR
and GARCH are slightly superior to various
simpler filters in predicting volatility.
In addition, other studies also remarked sound
results obtained from FHS. Barone-Adesi et al.
(2000) backtested VaR generated by FHS model
using three types of portfolios (LIFFE financial
futures and options contracts traded on LIFFE,
interest rate swaps, mixed portfolios consisting of
LIFFE interest rate futures and options as well as
plain vanilla swaps) invested over a period of two
years. In each of their three backtests, they stored
the risk measures of five different VaR horizons
(1, 2, 3, 5 and 10 days) and four different
probability levels (0.95, 0.98, 0.99 and 0.995).
Their findings sustain the validity of FHS as a risk
measurement model and diversification reduces
risk effectively across the markets they study.
Impressive gains in FHS compared with those of
HS in Barone-Adesi and Giannopoulos’ study
(2001) confirm the superiority of FHS.
The above studies focused on stock indices,
whereas few researches were conducted on futures
indices. Market risk of stock index futures have
been measured individually by Kaman (2009) (on
Turkish Index Futures), Dechun et al. (2009) (on
Shanghai Sehnzhen Stock 300 Index futures) [27],
Cotter and Dowd (2006) (on FTSE100, S&P500,
Hang Seng and Nikkei225 index futures) [25],
Tang and Shieh (2006) (on S&P 500, Nasdaq 100,
and Dow Jones stock index futures) [54], Huang
and Lin (2004) (on Taiwan stock index futures)
[41]. Not many empirical studies compare VaR on
spot and futures indices. One of the few is that of
Carchano et al. which compares the predictive
performance of one-day-ahead VaR forecasts
using normal and the CTS ARMA-GARCH
models on S&P 500 [20], DAX 30, and Nikkei 225
spot and futures indices. Their findings show that
in both markets the CTS performs better in
forecasting one-day-ahead VaR than the model
that assumes innovations followed the normal law.
Köseoglu and Ünal analyzed the market risks of
various future stock market indices and the market
risks of their corresponding underlying stock
markets (namely S&P500, DAX30, FTSE100,
Nikkei225, ISE30) for the period between 2005
and 2011, using various approaches, e.g
RiskMetrics, Delta Normal, Cornish Fisher
modified, HS and extreme value theory [45]. They
found that futures market risk is higher than
underlying stock market risk for Nikkei 225 and
S&P 500 while the opposite is true for FTSE,
DAX and ISE 30. RiskMetrics approach is also so
proved to produce the best forecasts to VaR
measures.
In conclusion, above-mentioned studies prove
that none is perfect method. Although a great deal
of studies on risk measurement have been
conducted, most of them mainly focus on
developed countries and stock indices. Because of
the different nature of emerging markets compared
to developed markets, it is crucial to use
alternative models to assess their performance in
risk measurement of the stock returns and evaluate
their forecasting in emerging markets. This paper
aims to consider the out-of-sample forecasting
performance of HS, FHS, GARCH family models
and Monte Carlo in predicting futures markets and
stock markets volatility in Asian emerging
markets. The main differences between our study
and previous literature are as follows: (1) In this
comparison, a more exhaustive set of methods are
employed, such as HS, FHS, Monte Carlo
simulation and the parametric approach (in
particular GARCH family models) in Asian
emerging financial markets. (2) When conditional
variance needs to be modelled, several models are
applied (one of them is asymmetric GARCH under
both a normal, a Student’s-t distribution and SkewStudent’s-t distribution of returns which allow
leverage and fat-tail effect usually observed in
financial returns); and (3) The VaR performance is
analyzed after the periods of the financial crisis in
TẠP CHÍ PHÁT TRIỂN KHOA HỌC & CÔNG NGHỆ:
CHUYÊN SAN KINH TẾ - LUẬT VÀ QUẢN LÝ, TẬP 2, SỐ 1, 2018
2008-2009.
3 METHODOLOGY
Measuring VaR can be classified into three
general categories: Non-parametric (HS, FHS),
parametric (variance-covariance techniques), and
Monte Carlo simulation together with numerous
variations for each approach. The essence of
parametric approach is the distribution assumption,
whereas nonparametric approach makes no
assumption regarding distribution. A priori, it is
not clear which method provides the best results.
In this paper, we will compare three techniques
applied to all stock market indices in emerging
economies in Asia.
In non-parametric approach, the HS and the
FHS are applied. In parametric approach, due to
the great number of variations of GARCH that
have that have been developed over the last 20
years, we restrict our study to a class of 8 GARCH
models using different assumptions of distribution
of innovations in addition to RiskMetrics.
Consequently, we compare the actual values of
those indices with the risk values predicted by the
selected models which are known as backtesting.
This method has been adopted by many financial
institutions for gauging the quality and accuracy of
their risk measurement. Realized day-to-day
returns on the bank’s portfolio are compared to the
VaR of the bank’s portfolio. By counting the
number of times when the actual portfolio result
was worse than the VaR, the performance of a
model in predicting its true market risk exposure
can be assessed. If this number corresponds to
approximately percent of the back-tested trading
days (i.e. prescribed left tail probability), the
model is well specified or is rejected, otherwise.
The simplest model for VaR assessment is the
HS. It is based on the assumption that history is
repeating itself and all occurrences are independent
and identically distributed (i.i.d.). The HS method
accurately measures past returns but can be a poor
estimator of future returns if the market has
shifted. To overcome the shortcomings of
traditional HS, the FHS incorporates conditional
volatility models such as GARCH into the HS
model. The FHS model allows time varying
conditional moments of returns, volatility
clustering and factors that can have an asymmetric
effect on volatility. In addition, it is crucial in
applications and avoids too simplistic assumptions
81
about conditional normality distributions of
returns. The empirical distribution of financial
returns is simulated by considering different
samples with the different lengths of window: k =
30 (1 month), k = 60 (2 months), k = 250 (1 year),
500 (2 years) daily observations for both methods
to take the effect of different sizes of used training
set into account.
The most commonly adopted VaR estimation
method is the variance-covariance approach, which
is based on a volatility forecast rather than a
returns forecast. This paper employs AR(1) and
GARCH(1,1) given their simplicity in estimation
and theoretical properties of interest, such as
tractable moments and stationary conditions.
Furthermore, the distributions are often
asymmetric and fat-tailed, whereas the normal
assumption is found to be inadequate for sample
fitting and forecasting not long after its inception.
In addition, many studies show the fat tails of the
distribution can best be modeled by means of the tdistribution. As a result, student’s t-distribution
and skew student’s t-distribution are also adopted
with additional shape parameters and perform
better than a model with Gaussianity, particularly
for more extreme (1% or less) VaR thresholds. For
parametric approach, we apply nine VaR measures
for each index, namely: EWMA, GARCH,
EGARCH, GJR-GARCH, IGARCH, TGARCH,
AVGARCH, NGARCH, NAGARCH, and
ALLGARCH. Within each model, we have
considered three types of distributions: Normal,
Student’s t and Skew-Student’s t-distribution.
Another popular method is the Monte Carlo
simulation. This is a flexible approach as it allows
users to modify individual risk factors, thereby
providing a more comprehensive picture of
potential risks embedded in the down-side tail of
the distribution by generating large number of
scenarios. In finance, it is a reasonable assumption
that asset prices are mostly unpredictable and
follow a special type of stochastic process known
as geometric Brownian motion [52; 22]. The
following equation describe the geometric
Brownian motion:
S_(t+∆t)=S_t e^(k∆t+σε_t √∆t)
(1)
where S_t is the stock price at time t, e is the
natural logarithm, ∆t is the time increment
(expressed as portion of a year in terms of trading
days), k=μ- σ^2/2 is the expected return and ε_t is
the randomness at time t (random number
82
SCIENCE & TECHNOLOGY DEVELOPMENT JOURNAL:
ECONOMICS - LAW AND MANAGEMENT, VOL 2, NO 1, 2018
generated from a standard normal probability
distribution) introduced to randomise the change in
stock price.
Simulations are computationally intensive and
thus much time-consuming and requiring more
knowledge and experience of the users than both
the parametric methodology and HS. In addition,
number of market risk factors keep increasing and
more complex, while a simulation is only as good
as the probability distribution for the inputs that
are fed into it. Nevertheless, Monte Carlo
simulation can be a valuable tool for forecasting an
unknown future in financial sector.
The VaR calculated with the aforementioned
volatility model should always be accompanied by
validation, i.e. checking whether it is adequate or
how well it predicts risks. This is the key part of
the internal model’s approach to market risk
management in order to evaluate alternative
models, especially when comparing methods. In
backtesting, the historical VaR forecasts and their
associated asset returns are used to check if actual
losses are in line with expected losses. In our
paper,
Unconditional
Coverage
Tests,
Independence Tests and Joint Tests of
Unconditional Coverage and Independence are
applied to compare the accuracy, independence
and the joint performance of each VaR estimation
method.
4 DATA AND EMPIRICAL FINDINGS
4.1 Data
Data employed in this paper is daily adjusted
closing indexes of 8 emerging markets in Asia,
namely Shanghai Composite Index SSE (China),
S&P BSE SENSEX (India), Jakarta Composite
Index JKSE (Indonesia), Kospi Index KS11
(Korea), KLSE (Malaysia), PSEi-Index PSEI.PS
(the Philippines), TSEC weighted index TW
(Taiwan), SET Index (Thailand) and VN-Index
(Vietnam). For index futures, only four markets,
which are Taiwan (FTWII), Korea (FKS11),
Malaysia (FKLCI), India (FBSESN)) are
employed to consider whether stock index futures
are riskier than their underlying assets due to data
unavailability of the other markets. The studied
period is from January 2000 to December 2014.
All data was obtained from Yahoo Finance and
DataStream.
The total sample of stock returns is divided into
estimation and evaluation sub-samples. The out-
of-sample evaluation sample contains 900 last
observations in the total sample for each index.
The indices are transformed to daily rate of
returns, which are defined as the natural
logarithmic returns in two consecutive trading
days:
r_t=ln(p_t )-ln(p_(t-1) )=ln(p_t/p_(t-1) )
where r_t is the daily log return, p_t and p_(t-1)
are the daily adjusted closing price of each stock
indices at time t and t-1.
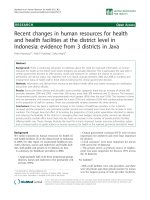
The plots for the daily log returns fluctuate
around a zero mean. Each of all series appears to
show signs of ARCH effects in which the
amplitude of the returns varies over time (see
Figure 1). The p-value of ARCH Test shown in the
last row are all zero, resoundingly rejecting the “no
ARCH” hypothesis (See Table 1). By observing
the time series data set of returns, it can be seen
that there exists heteroskedasticity. However, we
cannot determine whether this is enough to warrant
consideration.
Table 1 shows that the average daily return are
positive (except for TWII about 0%) but negligibly
small compared with the sample standard
deviation. The daily standard deviation of stock
indices of the Korean and Vietnamese markets are
the highest (0.0164), whereas that of the Malaysian
is the lowest (0.0098). For index futures, Korean
market also has the highest standard deviation
(0.0175) and Malaysian market has the lowest
standard deviation (0.0106). Furthermore, stock
index futures are riskier than their underlying
assets as evidenced by their higher standard
deviation compared with stock indices. The reason
is that futures market risk is related not only to
changes in the underlying assets but also many
other speculative trading activities.
The returns series are skewed (either negatively
or positively) and the large returns (either positive
or negative) lead to a large degree of kurtosis. Both
the assets show evidence of fat tails (leptokurtic),
since the kurtosis exceeds 3 (the normal value),
implying that the distribution of these returns has a
much thicker tail than the normal distribution. As
we know, skewness is a measure of symmetry,
which is equal to zero for normal distribution. The
skewnesses of all markets (except for PSEI.PS) are
also negative, which means that the distribution
has an asymmetric tail extending out to the left and
is referred to as “skewed to the left”. This leads the
standard deviation of all markets which presents
the “risk” is underestimated when kurtosis is
TẠP CHÍ PHÁT TRIỂN KHOA HỌC & CÔNG NGHỆ:
CHUYÊN SAN KINH TẾ - LUẬT VÀ QUẢN LÝ, TẬP 2, SỐ 1, 2018
higher and skewness is negative. The Ljung-Box
(LB) Q statistics for daily stock returns of both
assets are highly significant at five-percent level
indicate the presence of serial correlations.
Furthermore, the Ljung-Box Q statistics for
squared returns are much higher than that of raw
returns indicate the time-varying volatility.
83
Furthermore, the presence of serial correlations
and time-varying volatility make the traditional
OLS regression inefficient. These results indicate
that GARCH model would be a more suitable
model than the tradition OSL regression models in
estimating the “true risk”.
(a) The daily returns of stock indices
b) The daily returns of stock index futures
Figure 1. The daily returns of and stock indices and stock index futures
4.2 Empirical Findings
The results of backtesting at VaR 99% and VaR
95% for all indices are presented in Table 2. For
each index, the rejected models are hightlighted in
yellow. Graphical representations are not reported
here because of limited space yet available upon
request.
It can be observed that models provide relatively
similar results for all indices. As presented in
Table 2, FHS appears to be superior to HS for all
indices since results produced by HS are relatively
far away from the threshold in most of the cases.
The backtest results of HS is rather disappointing
as most failure rates considerably exceed the
respective left tail probabilities. HS models also
yield the poorest outcomes as evidenced by the
number of exceptions being distant from the
expected ones. Not surprisingly, three backtests
reject almost all of these models for all left tail
84
SCIENCE & TECHNOLOGY DEVELOPMENT JOURNAL:
ECONOMICS - LAW AND MANAGEMENT, VOL 2, NO 1, 2018
probabilities. In particular, HS models differ
primarily in the span of time they include. The
results also show that the longer the look-back
period is, the lower exceptions the model yields.
This can be explained that in finance and banking
sector, the more derivatives are developed, the
more dangerous the market is. The assumption of
the future repeats the past will lead to inaccurate
result.
It is worth noting that almost all of GARCH
models are rejected at VaR 1% for the Vietnamese
market. Historically, the choice of confidence
interval was dependent on the bank’s risk appetite
and on a specific target the bank had for its rating,
yet regulators require back testing only “on the
99th percentile”. Mehta et al., show that the range
of confidence intervals employed lies between
99.91% and 99.99% [47].
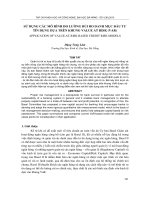
If failure rates only are considered, FHS appears
to be the best method. However, Figure 2 which
illustrates the results of backtesting on daily
returns and VaR exceedences of TWII using FHS
method provides an opposite conclusion.
Estimated lines from FHS method indicates that
the estimated VaR is not responsive to historical
data. This is likely due to the fact that these models
overestimate VaR, resulting in useless VaR
measure and low predicting power. Monte Carlo
simulation also yields similar results.
The research also shows that banks with
significant capital markets activity tend to use
99.98%. Therefore, the fact that almost all models
of GARCH family are rejected indicates that the
Vietnamese markets are riskier and harder to
estimate than others. It is likely because they are
immature and prone to be distorted by multiple
factors compared with other markets. This also
explains why HS seems to be slightly more
effective than others when being applied for
Vietnam.
In variance-covariance approach, RiskMetrics is
the worst model as it yields the highest failure
rates. It is noteworthy that RiskMetrics which
causes VaR underestimation in reality is used as
one of the most popular models by financial
institutions. The underperformance of HS and
RiskMetrics can be attributed to their rigid
structure of adjustment to the volatility process.
Accordingly, their responding adjustment is not
fast enough to capture the vibrant market
dynamics.
Findings also show that futures market forecast
is less accurate than underlying stock market for
almost all markets (except for KS11 and FKLCI at
VaR 5%). As we know that futures markets tend to
be influenced not only by changes in the
underlying assets but also speculative trades. This
feature is supposed to cause difficulties in its VaR
forecasting. In fact, forecasting VaR using these
models proves to be less accurate for the stock
index futures than for the stock market, which
means investors who take part in futures markets
face more risk than those in stock markets. In
addition, HS methods were less accurate for stock
indices. However, the results are more accurate for
index futures. Previous studies on developed
markets have also shown the low accuracy of HS
compared with other approaches in forecasting
VaR. This is likely due to the fact that future
markets in developed countries are more dynamic
and mature than in the emerging countries. As a
result, investors in emerging markets mainly rely
on price history to make investment decisions. HS
approach is slightly superior for index futures.
Backtesting results indicate that models with
student’s and skew student’s distribution
outperform the normal distribution. Possible
reason is they cover all stock’s characteristics
(namely fat tail and skewness) (see Bollerslev and
Heracleous) [16]. As the recommendation of
Hendricks, the t-distribution is significant to
capture outcomes in the tail of the distribution
because extreme outcomes occur more often under
t-distributions than under the normal distribution
[39]. Study by Le and Nguyen also finds that
models with normal distribution assumption failed
to predict VaR at 1% significant level [55].
Another interesting finding is that GARCH models
are rejected because of the lower than expected
failure rate ratios while HS and RiskMetrics yield
the opposite result with high failure rate ratios for
all markets. This suggests that GARCH models
overestimate VaR while the HS and Risk Metrics
approach underestimate VaR in some cases. The
underestimating feature of VaR has been proved in
a plenty of studies in the past 2008 crisis.
Finally, the study confirms that there is no
evidence to propose the best GARCH (1,1) model
for estimating VaR in all markets. Each market
with specific conditions need specialized models
for the estimation of volatility in reality.
5 CONCLUSIONS
In the paper we attempted to examine how well
VaR models perform in Asian emerging markets.
TẠP CHÍ PHÁT TRIỂN KHOA HỌC & CÔNG NGHỆ:
CHUYÊN SAN KINH TẾ - LUẬT VÀ QUẢN LÝ, TẬP 2, SỐ 1, 2018
The first conclusion is that our data are not
normally distributed, indicating that the normality
assumption of VaR is not reliable as discussed in
the methodology part.
For each model, student's t distribution and
skew student's t distribution are considered in
order to model financial returns’ characters. The
performances of the volatility models were
subsequently measured out-of-sample using VaR.
Furthermore, our empirical results are in line with
what we expected to find. We employed the
Unconditional Coverage, Independence, Joint
Tests
of
Unconditional
Coverage
and
Independence to backtest these results to ensure
the quality of our VaR estimates. In estimating
VaR, it seems that for all indices, GARCH family
models are clearly superior to HS, FHS,
RiskMetrics and Monte Carlo simulation since
their results are relatively far away from the
threshold in most of the cases. This is not
surprising because – as argued in lot of studies –
GARCH family models should provide an accurate
estimate of VaR. The results also indicate that
models under student's t and skew student's t
distribution are better in taking into account
financial data's characters. The noticeable finding
is that there is no evidence to choose the best
model in the GARCH (1,1) family which can be
used for estimating VaR in all markets.
Furthermore, the reason that models in the
GARCH family are rejected is the overestimated
VaR which reduces the effectiveness of using
inputs. This paper also shows that forecasting VaR
for stock index futures is harder than for stock
index. Those findings would be helpful for
financial managers, investors and regulators
dealing with stock markets in Asian emerging
economies. Further extension of this work can be a
research of alternative methods to estimate Value
at Risk, e.g. the Conditional Autoregressive Value
at Risk (CAVaR), an Incremental VaR (IVaR),
Marginal VaR, Conditional VaR and Probability of
Shortfall.
REFERENCES
[1] Abad, P., and S. Benito. 2009. A detailed comparison of
value at risk in international stock exchange. FUNCAS
Working Paper 452.
[2] Abad, P., and S. Benito. 2013. A detailed comparison of
value at risk estimates, Mathematics and Computers in
Simulation, 94, 258–276.
85
[3] Abad, P., S. Benito, and C. López. 2013. A comprehensive
review of Value at Risk methodologies. The Spanish
Review of Financial Economics, G Model SRFE-22.
[4] Akgiray, V. 1989. Conditional Heterosceasticity in Time
Series of Stock Returns: Evidence and Forecasts. The
Journal of Business, 62 (1), 55–80.
[5] Alberg, D., H. Shalit, and R. Yosef. 2008. Estimating stock
market volatility using asymmetric GARCH models.
Applied Financial Economics, 18, 1201–1208.
[6] Alexander, C., and E. Lazar. 2008. Normal mixture
GARCH (1,1): Applications to exchange rate modelling.
Journal of Applied Econometrics, 21, 307–336.
[7] Artzner, P., F. Delbaen, J.-M. Eber, and D. Heat. 1999.
Coherent measures of risk. Mathematical Finance, 9 (3),
203–228.
[8] Barone-Adesi, G., and K. Giannopoulos. 2001. Nonparametric VaR techniques. Myths and Realities,
Economic notes, Banca Monte dei Paschi di Siena, Siena.
[9] Barone-Adesi, G., F. Bourgoin, and K. Giannopoulos. 1998.
Don’t look back, Risk, 11, 100–104.
[10] Barone-Adesi, G., K. Giannopoulos, and L. Vosper. 2000.
Filtering historical simulation. backtest analysis.
[11] Barone-Adesi, G., K. Giannopoulos, and L. Vosper. 2000.
Filtering Historical Simulation. Backtest Analysis. Tech.
rep.
[12] Basel. 2011. Messages from the academic literature on risk
measurement for the trading book, Working paper 19.
Basel Committee on Banking Supervision, Basel,
Switzerland.
[13] Basel. 2012. Impact Consultative Document: Fundamental
Review of the Trading Book. Tech. rep., Basel,
Switzerland.
[14] Basle. 1996. Supervisory Framework for the Use of
Backtest in conjunction with the Internal Models
Approach to Market Risk Capital Requirements. Tech.
rep.
[15] Beder, T. S. 1996. Report Card on Value at Risk: High
potential but Slow starter. Bank Accounting & Finance,
14–25.
[16] Bollerslev, T. 1986. Generalized Autoregressive
Conditional
Heteroskedasticity.
Journal
of
Econometrics, 31 (3), 307–327.
[17] Bollerslev, T., R. Y. Chou, and K. F. Kroner. 1992. ARCH
modeling in finance: A Review of the theory and
empirical evidence. Journal of Econometrics, 52, 5–59.
[18] Brailsford, T. J., and R. W. Faff. 1996. An evaluation of
volatility forecasting techniques. Journal of Banking &
Finance, 20 (3), 419–438.
[19] Brooks, C. 2008. Introductory Econometrics for Finance.
Cambridge University Press, New York.
[20] Carchano, O., S. T. Rachev, Y. S. Kim, E. W. Sun, and F.
J. Fabozzi. 2010. Forecasting VaR in Spot and Futures
Equity Markets. Tech. rep. Karlsruhe Institute of
Technology.
[21] Chen, M., J. 2014. Measuring market risk under the Basel
accords: VaR, stressed VaR, and expected shortfall. The
IEB International Journal of Finance, 8, 184–201.
[22] Cheung, Y. H., and R. J. Powell. 2012. Anybody can do
Value at Risk: A Teaching Study using Parametric
Computation and Monte Carlo Simulation. Australasian
Accounting, Business and Finance Journal, 6 (5), 101–
118.
[23] Christoffersen, P., and D. Pelletier. 2003. Backtesting
Value-at-Risk: A Duration-Based Approach. Journal of
Financial Econometrics, 2 (1), 84–108.
[24] Cont, R., Volatility Clustering in Financial Markets:
Empirical Facts and Agent-Based Models, Tech. rep.,
86
SCIENCE & TECHNOLOGY DEVELOPMENT JOURNAL:
ECONOMICS - LAW AND MANAGEMENT, VOL 2, NO 1, 2018
Centre
de
Mathématiques
appliquées,
Ecole
Polytechnique. F-91128 Palaiseau,
[25] Cotter, J., and K. Dowd. 2006. Estimating financial risk
measures for futures positions: a non-parametric
approach. Discussion paper series Geary WP2006/13,
UCD Geary Institute.
[26] Daníelsson, J. 2002. The emperor has no clothes: limits to
risk modelling. Journal Banking of Finance, 26, 1273–
1296.
[27] Dechun, H., G. Hongxiang, and Z. Haochi. 2009. The
Research about Shanghai and Shenzhen Stock 300 Index
Futures Simulation Trading Based on VaR Measurement.
International Conference on Management and Service
Science, 1-5.
[28] Drakos, A. A., G. P. Kouretas, and L. P. Zarangas. 2010.
Forecasting financial volatility of Athens stock exchange
daily returns- An application of the asymmetric normal
mixture GARCH model. International Journal of
Finance & Economics, 15 (4), 331–350.
[29] Embrechts, P., and M. Hofert. 2014. Statistics and
Quantitative Risk Management for Banking and
Insurance. Annual Review of Statistics and Its
Applications, 1 (1), 493–514.
[30]
Engle,
R.
1982.
Autoregressive
conditional
heteroscedasticity with estimates of the variance of
United Kingdom inflation. Econometrica, 50 (4), 987–
1007.
[31] Engle, R. F., and V. K. NG. 1993. Measuring and Testing
the Impact of News on Volatility. The Journal of
Finance, 48 (5), 1749–1778.
[32] European-Commission, Solvency II: Frequently Asked
Questions, Tech. rep., Internal Markets & Services DG.
2014.
[33] Fama, E. F. 1965. The Behavior of Stock-Market Prices.
The Journal of Business, 38 (1), 34–105.
[34] Franses, P. H., and D. V. Dijk. 1996. Forecasting stock
market volatility using (Non-Linear) Garch models.
Journal of Forecasting, 15, 229–235.
[35] French, K. R., G. W. Schwert, and R. F. Stambaugh. 1987.
Expected stock returns and volatility. Journal of
Financial Economics, 19, 3–29.
[36] Freund, S., and S.-H. Chu. 1996. Volatility Estimation for
Stock Index Options: A GARCH Approach. Quarterly
Review of Economics and Finance, 36 (4), 431–450.
[37] Grouard, M. H., S. Levy, and C. Lubochinsky. 2003. Stock
market volatility: From empirical data to their
interpretation. Tech. rep., Banque de France.
[38] Ñíguez, T.-M. 2008. Volatility and VaR forecasting in the
Madrid Stock Exchange. Spanish Economic Review, 10
(3), 169–196.
[39] Hendricks, D. 1996. Evaluation of Value at Risk Models
using Historical Data. Federal Reserve Bank of New
York Economic Police Review, 2 (1), 39–70.
[40] Homescu, C. 2014. Robust and practical estimation for
measures of tail risk. Working paper, United States.
[41] Huang, Y. C., and B.-J. Lin. 2004. Value-at-Risk Analysis
for Taiwan Stock Index Futures: Fat Tails and
Conditional Asymmetries in Return Innovations. Review
of Quantitative Finance and Accounting, 22 (2), 79–95.
[42] Jorion, P. 2004. Value at Risk - The New Benchmark for
Managing Financial Risk. The McGraw-Hill Companies,
Inc.
[43] Jorion, P., VaR Methods, chap. 15, pp. 349–369, Financial
Risk Manager Handbook, fourth ed., Joh Wiley & Sons,
Inc.
[44] Kasman, A. 2009. Estimating Value-at-Risk for the
Turkish Stock Index Futures in the Presence of Long
Memory Volatility, Central Bank Review, 1, 1–14.
[45] Köseoglu, S. D., and G. E. Ünal. 2012. Market Risk of
Index Futures and Stock Indices: Turkey as a Developing
Country vs. Developed Countries, Journal of Business
and Policy Research, 7 (3), 159–177.
46] Mandelbrot, B. 1963. The Variation of Certain Speculative
Prices, The Journal of Business, 36 (4), 394–419.
[47] Mehta, A., M. Neukirchen, S. Pfetsch, and T.
Poppensieker. 2012. Managing market risk: Today and
tomorrow, MCKinsey Working Paper on Risk 32,
McKinsey & Company.
[48] Nelson, D. B. 1991. Conditional Heteroskedasticity in
Asset Returns: A New Approach. Econometrica, 59 (2),
347–370.
[49] Nocera, J. 2009. Risk Mismanagement. New York Times
Magazine.
[50] Pagan, A. R., and G. W. Schwert. 1990. Alternative
models for Conditional Stock volatiltiy. Journal of
Econometrics, 45, 267–290.
[51] Sarma, M., S. Thomas, and A. Shah. 2003. Selection of
Value at Risk Models. Journal of Forecasting, 22 (4),
337–358.
[52] Sengupta, C. 2004. Financial Modeling Using Excel and
VBA, Chap. 11: Simulating Stock Prices, pp. 285–305.
John Wiley & Sons, Inc., Hoboken, New Jersey.
[53] Su, C. 2010. Application of EGARCH Model to Estimate
Financial Volatility of Daily Returns: The empirical case
of China, Master of science in finance. University of
Gothenburg, School of Business, Economics and Law.
[54] Tang, T. L., and S. J. Shieh. 2006. Long memory in stock
index futures markets: A value-at risk approach, Physica
A, 366, 437–448.
[55] Le Phan Thi Dieu Thao and Nguyen Thanh Phu .2016. Xếp
hạng các mô hình VaR trong dự báo rủi ro danh mục,
Banking Technology Review, 120.
[56] Ngo Van Thu va Le Thanh Tam.2015. Đo lường rủi ro
ngân hàng thông qua công cụ giá trị rủi ro (VaR) và tổn
thất kỳ vọng (ES): Trường hợp nghiên cứu Tại Việt
Nam, Journal of Economics and Development, 216, 4353.
[57] van den Goorbergh, R., and P. Vlaar. 1999. Value-at-Risk
Analysis of Stock Returns Historical Simulation,
Variance Techniques or Tail Index Estimation? DNB
Staff Reports 40, Netherlands Central Bank.
[58] West, K. D., and D. Cho. 1995. The predictive ability of
several models of exchange rate volatility. Journal of
Econometrics, 69, 367–391.
TẠP CHÍ PHÁT TRIỂN KHOA HỌC & CÔNG NGHỆ:
CHUYÊN SAN KINH TẾ - LUẬT VÀ QUẢN LÝ, TẬP 2, SỐ 1, 2018
87
Dự báo giá trị chịu rủi ro (VaR):
Nghiên cứu từ các quốc gia Châu Á mới nổi
Lê Trung Thành1, Nguyễn Thị Ngân2,*, Hoàng Trung Nghĩa2
1
Trường Đại học Việt Đức
Trường Đại học Kinh tế - Luật, ĐHQG-HCM
*
Tác giả liên hệ:
2
Ngày nhận bản thảo: 21-8-2017, Ngày chấp nhận đăng: 13-10-2017; Ngày đăng: 15-7-2018
Tóm tắt—Trong bài nghiên cứu này, chúng tôi áp
dụng nhiều kỹ thuật tính giá trị chịu rủi ro (VaR)
của 9 chỉ số chứng khoán của các quốc gia Châu Á
mới nổi. Kết quả từ các mô hình sau đó được kiểm
tra lùi bằng các phương pháp như Unconditional
Coverage,
Independence,
Joint
Tests
of
Unconditional Coverage và Independence, Basel để
đảm bảo chất lượng của các ước tính VaR. Các kết
quả chính của nghiên cứu là: (1) Biến động thay đổi
theo thời gian là đặc điểm quan trọng nhất của tỷ
suất sinh lời chứng khoán khi mô hình hóa VaR; (2)
Các số liệu tài chính không có phân phối chuẩn, hàm
ý rằng giả định phân phối chuẩn của VaR là không
phù hợp; (2) Trong số các phương pháp dự báo
VaR, kết quả kiểm tra lùi trong và ngoài mẫu cho
thấy các mô hình GARCH có độ chính xác vượt trội;
Phương pháp Historical Simulation (HS), Filtered
Historical Simulation (FHS), RiskMetrics và Monte
Carlo bị bác bỏ do dự báo quá cao (HS var
RiskMetrics) hoặc dự báo quá thấp (FHS và Monte
Carlo); (4) Các mô hình có phân phối student’s t và
student’s t lệch tích hợp các đặc điểm của số liệu tài
chính tốt hơn; và (5) Dự báo VaR đối với các chỉ số
tương lai khó hơn dự báo chỉ số chứng khoán. Ngoài
ra, kết quả cũng cho thấy không có cơ sở để khuyến
nghị dùng GARCH(1,1) để ước tính VaR cho tất cả
các thị trường. Trên thục tế, HS và RiskMetrics
được các ngân hàng sử dụng phổ biến đối với các
danh mục lớn mặc dù các phương pháp này dự báo
tổn thất thực sự quá thấp. Những kết luận này sẽ
giúp các nhà quản lý, đầu tư tài chính và cơ quan
lập pháp quản lý tốt hơn thị trường chứng khoán
của các quốc gia Châu Á mới nổi.
Từ khóa—VAR, dự báo, GARCH đơn biến, các thị trường tài chính mới nổi
88
SCIENCE & TECHNOLOGY DEVELOPMENT JOURNAL:
ECONOMICS - LAW AND MANAGEMENT, VOL 2, NO 1, 2018
APPENDIX
Observations
Minimum
Maximum
Mean
Median
Std. Dev.
Variance
Kurtosis
Skewness
LB Qstatistics
Daily Returns
LB (12)
TWII
3707
-0.0994
0.0652
0.0000
0.0004
0.0146
0.0002
5.9749
-0.2359
KS11
3706
-0.1280
0.1128
0.0002
0.0008
0.0164
0.0003
8.7073
-0.5617
JKSE
3631
-0.1095
0.0762
0.0006
0.0012
0.0144
0.0002
6.1732
-0.6850
PSEI.PS
3682
-0.1309
0.1618
0.0003
0.0004
0.0135
0.0002
15.0296
0.3177
37.44
(0.000)
62.48
(0.000)
16.3
(0.177)
38.94
(0.027)
54.94
(0.000)
87.31
(0.000)
85.2
(0.000)
109.6
(0.000)
DESCRIPTIVE STATISTICS OF DATA
SET
KLSE
BSESN
3671
3698
3710
-0.1606
-0.1557
-0.1181
0.1058
0.1602
0.1599
0.0003
0.0002
0.0004
0.0006
0.0004
0.0011
0.0142
0.0098
0.0158
0.0002
0.0001
0.0003
9.0349
57.7963
6.7603
-0.7213
-0.5187
-0.1876
VNI
3421
-0.0766
0.0774
0.0005
0.0002
0.0164
0.0003
2.5798
-0.2056
FTWII
3912
-0.1108
0.1057
0.0000
0.0000
0.0164
0.0003
4.2683
-0.1842
FKS11
3912
-0.1054
0.1131
0.0002
0.0000
0.0175
0.0003
4.6913
-0.3483
FKLCI
3912
-0.0759
0.0510
0.0002
0.0000
0.0106
0.0001
4.7160
-0.4670
FBSESN
3797
-0.1626
0.1619
0.0005
0.0001
0.0158
0.0002
10.3493
-0.4565
7.657
(0.811)
28.87
(0.225)
47.45
(0.000)
81.53
(0.000)
26.27
(0.009)
62.52
(0.000)
451.1
(0.000)
528.9
(0.000)
48.15
(0.000)
75.67
(0.000)
16.76
0.0158
48.03
0.0025
21.4
0.0448
41.29
0.0154
45.8
(0.000)
68.58
(0.000)
1244
1258
847
168.8
680.4
759.4
(0.000)
(0.000)
(0.000)
(0.000)
(0.000)
(0.000)
LB (24)
2094
1769
1130
202.9
789
759.7
(0.000)
(0.000)
(0.000)
(0.000)
(0.000)
(0.000)
ArchTest (12)
457.8
503
391.5
120
426.3
1022
(0.000)
(0.000)
(0.000)
(0.000)
(0.000)
(0.000)
Note: Descriptive statistics calculated for the whole period which goes from 01/01/2000 to 31/12/2014.
1108
(0.000)
1556
(0.000)
437.7
(0.000)
572.2
(0.000)
917.4
(0.000)
272.8
(0.000)
7692
(0.000)
11960
(0.000)
1493
(0.000)
1380
(0.000)
2285
(0.000)
506.1
(0.000)
1524
(0.000)
2382
(0.000)
546.9
(0.000)
909.8
(0.000)
1245
(0.000)
390.7
(0.000)
834.4
(0.000)
1049
(0.000)
396.1
(0.000)
LB (24)
Squared Daily Returns
LB (12)
41.21
(0.000)
65.88
(0.000)
SHA
3912
-0.0926
0.0940
0.0002
0.0000
0.0152
0.0002
4.9059
-0.1004
TẠP CHÍ PHÁT TRIỂN KHOA HỌC & CÔNG NGHỆ:
CHUYÊN SAN KINH TẾ - LUẬT VÀ QUẢN LÝ, TẬP 2, SỐ 1, 2018
89
THE RESULT OF BACKTESTING AT VAR
TWII
KS11
JKSE
PESI
SET
KLSE
BSESN
SHA
VNI
FTWII
FKS11
FKLCI
FBSESN
1% 5% 1% 5% 1% 5% 1% 5% 1% 5% 1% 5% 1% 5% 1% 5% 1% 5% 1% 5% 1% 5% 1% 5% 1% 5%
HS30
3.7% 7.4% 4.2% 6.6% 3.6% 7.4% 4.7% 6.7% 4.3% 7.6% 3.6% 6.8% 3.6% 6.3% 3.6% 6.7% 3.7% 7.1% 3.7% 6.7% 3.9% 7.6% 3.2% 7.7% 4.1% 7.1%
HS60
2.0% 4.7% 2.1% 5.3% 2.3% 5.6% 2.3% 5.9% 2.4% 5.9% 2.1% 5.0% 1.7% 4.9% 1.7% 4.4% 2.6% 4.9% 1.7% 4.4% 2.0% 4.9% 1.6% 5.6% 1.7% 5.1%
HS250
0.8% 5.2% 1.2% 5.0% 1.4% 5.7% 1.4% 4.9% 1.7% 5.3% 1.3% 4.9% 1.3% 5.3% 1.0% 4.3% 1.2% 4.7% 0.9% 5.1% 1.4% 4.4% 1.6% 5.6% 1.3% 4.9%
HS500
0.8% 4.1% 0.8% 4.2% 0.6% 4.2% 1.1% 4.8% 0.8% 4.6% 1.1% 4.8% 0.8% 4.2% 0.7% 4.0% 0.9% 3.9% 0.6% 4.3% 1.2% 4.0% 0.9% 5.2% 0.7% 3.4%
FHS30
0.0% 0.0% 0.0% 0.0% 0.0% 0.0% 0.0% 0.0% 0.0% 0.0% 0.0% 0.0% 0.0% 0.0% 0.0% 0.0% 0.0% 0.0% 0.0% 0.0% 0.0% 0.0% 0.0% 0.0% 0.0% 0.0%
FHS60
0.0% 0.0% 0.0% 0.0% 0.0% 0.0% 0.0% 0.0% 0.0% 0.0% 0.0% 0.0% 0.0% 0.0% 0.0% 0.0% 0.0% 0.0% 0.0% 0.0% 0.0% 0.0% 0.0% 0.0% 0.0% 0.0%
FHS250
0.0% 0.0% 0.0% 0.0% 0.0% 0.0% 0.0% 0.0% 0.0% 0.0% 0.0% 0.0% 0.0% 0.0% 0.0% 0.0% 0.0% 0.0% 0.0% 0.0% 0.0% 0.0% 0.0% 0.0% 0.0% 0.0%
FHS500
0.0% 0.0% 0.0% 0.0% 0.0% 0.0% 0.0% 0.0% 0.0% 0.0% 0.0% 0.0% 0.0% 0.0% 0.0% 0.0% 0.0% 0.0% 0.0% 0.0% 0.0% 0.0% 0.0% 0.0% 0.0% 0.0%
RM-norm
2.1% 5.8% 3.0% 7.3% 2.4% 7.1% 2.2% 7.0% 3.8% 7.0% 2.7% 4.7% 1.8% 6.2% 2.0% 6.1% 2.4% 6.1% 2.4% 5.9% 3.7% 7.9% 2.9% 7.4% 1.8% 6.3%
RM-std
1.7% 7.1% 2.4% 8.0% 1.7% 8.0% 1.6% 7.1% 2.7% 7.1% 2.2% 8.7% 1.6% 7.0% 1.3% 6.8% 2.3% 6.6% 2.1% 6.8% 3.0% 8.3% 2.3% 8.0% 1.0% 7.2%
RM-sstd
1.2% 6.2% 1.0% 6.9% 1.6% 7.6% 1.4% 7.0% 2.4% 7.1% 1.9% 8.4% 1.2% 6.2% 1.2% 6.3% 2.4% 6.7% 2.0% 6.6% 1.7% 7.8% 2.3% 7.9% 0.9% 6.4%
Garch-norm
1.3% 4.4% 1.0% 5.4% 1.3% 4.9% 1.2% 3.8% 1.1% 3.9% 2.0% 4.1% 1.0% 4.7% 1.6% 4.3% 2.0% 5.1% 1.8% 4.6% 1.8% 6.0% 1.9% 4.9% 0.7% 4.6%
Garch-std
1.0% 5.4% 0.7% 6.0% 1.0% 5.4% 1.1% 4.1% 0.9% 5.4% 0.9% 4.3% 0.7% 5.0% 1.0% 5.7% 1.9% 5.9% 1.6% 5.6% 0.8% 6.7% 1.7% 6.2% 0.7% 4.9%
Garch-sstd
0.9% 4.7% 0.6% 5.1% 0.9% 4.9% 0.8% 4.0% 0.8% 5.0% 0.8% 3.9% 0.4% 4.4% 0.9% 4.9% 2.0% 5.7% 1.2% 5.2% 0.4% 6.0% 1.7% 5.6% 0.4% 4.3%
eGarch-norm
1.1% 4.3% 0.8% 4.4% 1.6% 4.3% 1.2% 4.0% 1.2% 3.9% 1.0% 2.7% 0.8% 3.8% 1.6% 4.7% 1.9% 4.7% 1.6% 4.1% 1.2% 5.2% 1.9% 4.7% 0.6% 3.9%
eGarch-std
1.0% 4.7% 0.4% 4.7% 0.9% 5.0% 1.0% 4.2% 1.1% 5.6% 1.0% 4.6% 0.7% 4.0% 1.0% 5.3% 1.4% 4.9% 1.3% 4.9% 0.7% 5.4% 1.4% 5.4% 0.4% 4.3%
eGarch-sstd
0.9% 4.2% 0.2% 4.1% 0.9% 4.2% 0.8% 4.1% 1.0% 5.0% 0.8% 4.0% 0.3% 3.4% 0.8% 4.9% 1.6% 4.9% 1.2% 4.7% 0.3% 4.9% 1.4% 5.2% 0.3% 4.2%
gjrGarch-norm
1.0% 4.1% 0.7% 4.7% 1.2% 4.3% 1.0% 3.8% 1.1% 3.6% 2.2% 3.9% 1.0% 3.9% 1.4% 4.4% 2.0% 5.1% 1.8% 3.8% 0.8% 5.4% 1.8% 4.7% 0.7% 4.0%
gjrGarch-std
1.0% 5.0% 0.4% 4.7% 0.9% 4.8% 0.8% 4.0% 0.9% 5.1% 0.8% 4.2% 0.6% 3.9% 1.0% 5.2% 1.9% 5.9% 1.4% 4.9% 0.6% 5.9% 1.4% 5.2% 0.3% 4.1%
gjrGarch-sstd
0.8% 4.3% 0.4% 4.2% 0.8% 4.3% 0.8% 3.9% 0.8% 4.8% 0.8% 3.8% 0.3% 3.7% 0.7% 4.7% 2.0% 5.8% 1.3% 4.4% 0.3% 5.1% 1.4% 5.0% 0.3% 4.0%
iGarch-norm
1.4% 4.8% 1.1% 6.0% 1.3% 4.9% 1.1% 3.8% 1.0% 4.3% 2.2% 4.2% 1.0% 4.8% 1.7% 4.9% 2.0% 5.1% 1.9% 4.4% 2.3% 6.1% 2.1% 5.0% 0.7% 4.7%
iGarch-std
1.0% 5.6% 0.7% 6.4% 0.9% 5.4% 0.8% 4.0% 1.1% 5.6% 0.9% 4.8% 0.6% 5.1% 1.0% 5.7% 1.9% 5.9% 1.6% 5.6% 0.8% 6.7% 1.7% 6.2% 0.4% 4.9%
iGarch-sstd
0.9% 4.9% 0.6% 5.4% 0.8% 4.9% 0.6% 3.6% 0.9% 5.4% 0.8% 4.0% 0.4% 4.6% 0.8% 4.9% 2.0% 5.7% 1.2% 5.2% 0.4% 6.0% 1.7% 5.6% 0.4% 4.6%
TGarch-norm
1.0% 4.1% 0.7% 4.2% 1.6% 4.3% 1.2% 4.0% 1.1% 3.7% 1.1% 3.1% 0.9% 3.8% 1.6% 4.6% 2.2% 4.9% 1.6% 3.9% 1.1% 5.1% 1.8% 4.6% 0.7% 3.8%
TGarch-std
1.0% 4.8% 0.3% 4.6% 1.0% 4.7% 1.0% 4.3% 1.1% 5.4% 0.9% 4.7% 0.6% 3.9% 1.0% 5.4% 1.4% 5.2% 1.2% 4.9% 0.6% 5.3% 1.4% 5.1% 0.2% 4.0%
TGarch-sstd
0.9% 4.0% 0.2% 3.4% 0.9% 4.1% 0.9% 4.2% 1.0% 5.0% 0.9% 4.6% 0.3% 3.3% 0.8% 4.8% 1.8% 5.2% 1.2% 4.3% 0.3% 4.7% 1.4% 5.1% 0.2% 4.0%
AVGarch-norm
1.0% 4.3% 0.7% 3.7% 1.6% 4.1% 1.1% 4.0% 1.4% 4.4% 2.1% 4.2% 0.8% 3.6% 1.6% 4.6% 2.0% 4.8% 1.6% 3.9% 0.9% 4.6% 1.8% 4.6% 0.8% 3.7%
AVGarch-std
1.0% 4.1% 0.3% 3.6% 1.1% 4.8% 0.9% 4.0% 0.9% 5.1% 0.9% 4.7% 0.6% 3.7% 0.9% 5.4% 1.4% 5.2% 1.3% 5.1% 0.3% 4.6% 1.4% 5.2% 0.2% 4.1%
AVGarch-sstd
1.0% 4.0% 0.2% 2.9% 0.9% 4.2% 1.0% 3.8% 0.9% 4.9% 0.9% 4.6% 0.4% 3.3% 0.8% 4.9% 1.8% 5.1% 1.2% 4.3% 0.2% 4.2% 1.4% 5.0% 0.3% 3.7%
NGarch-norm
1.4% 4.4% 0.8% 5.3% 1.3% 4.7% 1.2% 3.8%
–
–
–
–
1.1% 4.9% 1.6% 4.7% 2.1% 4.9% 1.8% 4.4% 1.9% 6.0%
–
–
0.8% 4.4%
NGarch-std
–
–
–
–
0.9% 5.6%
–
–
1.2% 5.9%
–
–
0.7% 5.1% 1.0% 5.6% 1.6% 5.2% 1.6% 5.6%
–
–
–
–
0.7% 4.9%
NGarch-sstd
–
–
–
–
–
–
–
–
0.9% 5.7%
–
–
0.4% 4.7% 0.9% 5.1% 1.7% 5.1% 1.3% 5.0%
–
–
–
–
0.4% 4.3%
NAGarch-norm
1.0% 4.0% 0.6% 4.1% 1.3% 4.1% 1.1% 3.8% 1.1% 3.2% 2.1% 3.9% 0.9% 3.4% 1.4% 4.7% 2.0% 5.1% 1.4% 3.6% 0.8% 5.1% 2.1% 4.6% 0.9% 3.7%
NAGarch-std
0.9% 4.4% 0.3% 4.7% 1.1% 4.3% 0.8% 4.1% 0.9% 5.3% 0.8% 4.1% 0.7% 3.7% 1.0% 5.1% 1.9% 5.8% 1.4% 4.8% 0.4% 5.2% 1.4% 5.1% 0.3% 3.8%
NAGarch-sstd
0.8% 3.9% 0.2% 3.2% 0.9% 4.0% 0.8% 4.0% 0.9% 5.0% 0.8% 3.9% 0.6% 3.0% 0.8% 4.9% 2.0% 5.9% 1.2% 4.2% 0.3% 4.6% 1.4% 5.0% 0.2% 3.3%
Monte Carlo
0.2% 1.7% 0.1% 1.0% 0.4% 1.9% 0.6% 2.1% 0.4% 1.9% 2.0% 4.7% 0.1% 1.3% 0.4% 1.9% 0.1% 1.1% 0.2% 1.3% 0.6% 1.7% 0.7% 1.4% 0.3% 0.7%
Note: RM is RiskMetrics, norm is normal distribution, std is student's t distribution, sstd is skew student's t distribution. The yellow cells indicate that the null hypothesis that the VaR estimate is accurate is
rejected by any test. Results of unconditional coverage test, serial independence, conditional coverage will be available upon request.
90
SCIENCE & TECHNOLOGY DEVELOPMENT JOURNAL:
ECONOMICS - LAW AND MANAGEMENT, VOL 2, NO 1, 2018
BACKTESTING - DAILY RETURNS AND
VAR EXCEEDENCES OF TWII USING FHS METHOD
TWII-Value-at-Risk 1-day 99% Losses
-3
-2
Returns (%)
-3
-4
-4
-5
-6
Returns (%)
-2
-1
-1
0
0
TWII-Value-at-Risk 1-day 95% Losses
Returns
FHS30
FHS60
FHS250
FHS500
May-11
May-12
Nov-12
May-13
Nov-13
May-14
Nov-14
Returns
FHS30
FHS60
FHS250
FHS500
May-11
May-12
Nov-12
May-13
Time
Time
Nov-13
May-14
Nov-14