Lecture Managerial Accounting for the hospitality industry: Chapter 6 - Dopson, Hayes
Bạn đang xem bản rút gọn của tài liệu. Xem và tải ngay bản đầy đủ của tài liệu tại đây (493.21 KB, 64 trang )
Chapter 6
Ratio Analysis
© 2009 John Wiley & Sons
Hoboken, NJ 07030
1
Managerial Accounting for the Hospitality Industry
Dopson & Hayes
Chapter Outline
Purpose and Value of Ratios
Types of Ratios
Comparative Analysis of Ratios
Ratio Analysis Limitations
© 2009 John Wiley & Sons
Hoboken, NJ 07030
2
Managerial Accounting for the Hospitality Industry
Dopson & Hayes
Learning Outcomes
State the purpose and value of calculating and using
ratios to analyze the health of a hospitality business.
Distinguish between liquidity, solvency, activity,
profitability, investor, and hospitality-specific ratios.
Compute and analyze the most common ratios used in
the hospitality industry.
© 2009 John Wiley & Sons
Hoboken, NJ 07030
3
Managerial Accounting for the Hospitality Industry
Dopson & Hayes
Percentages
A ratio is created when you divide one number by
another.
A special relationship (a percentage) results when the
numerator (top number) used in your division is a part of
the denominator (bottom number).
To convert from common form to decimal form, move
the decimal two places to the left, that is, 50.00% =
0.50.
To convert from decimal form to common form, move
the decimal two places to the right, that is, 0.50 =
50.00%.
© 2009 John Wiley & Sons
Hoboken, NJ 07030
4
Managerial Accounting for the Hospitality Industry
Dopson & Hayes
Value of Ratios to Stakeholders
All stakeholders who are affected by a business’s
profitability will care greatly about the effective operation
of a hospitality business. These stakeholders may
include:
Owners
Investors
Lenders
Creditors
Managers
© 2009 John Wiley & Sons
Hoboken, NJ 07030
5
Managerial Accounting for the Hospitality Industry
Dopson & Hayes
Value of Ratios to Stakeholders
Each of these stakeholders may have different points of view
of the relative value of each of the ratios calculated for a
hospitality business.
Owners and investors are primarily interested in their return
on investment (ROI), while lenders and creditors are mostly
concerned with their debt being repaid.
At times these differing goals of stakeholders can be
especially troublesome to managers who have to please their
constituencies.
One of the main reasons for this conflict lies within the
concept of financial leverage.
© 2009 John Wiley & Sons
Hoboken, NJ 07030
6
Managerial Accounting for the Hospitality Industry
Dopson & Hayes
Financial Leverage
Financial leverage is most easily defined as the use of debt to
be reinvested to generate a higher return on investment (ROI)
than the cost of debt (interest).
g o fig u re!
To illustrate, assume a hospitality manager:
Borrows $10,000 to be repaid at 10% interest
Reinvests the same $10,000 in an investment that gains 12% ROI
And thus, creates a surplus of 2% gain
In this case, borrowing $10,000 and reinvesting the same $10,000 at a higher
rate of return earns a net gain of 2% after the debt is repaid. The manager, in
this case, has leveraged debt to secure a gain.
© 2009 John Wiley & Sons
Hoboken, NJ 07030
7
Managerial Accounting for the Hospitality Industry
Dopson & Hayes
Financial Leverage
Because of financial leverage, owners and investors generally
like to see debt on a company’s balance sheet because if it is
reinvested well, it will provide more of a return on the money
they have invested.
Conversely, lenders and creditors generally do not like to see
too much debt on a company’s balance sheet because the
more debt a company has, the less likely it will be able to
generate enough money to pay off its debt.
© 2009 John Wiley & Sons
Hoboken, NJ 07030
8
Managerial Accounting for the Hospitality Industry
Dopson & Hayes
Ratio Comparisons
Ratios are most useful when they compare a company’s
actual performance to a previous time period, competitor
company results, industry averages, or budgeted (planned for)
results.
When a ratio is compared to a standard or goal, the resulting
differences (if differences exist) can tell you much about the
financial performance (health) of the company you are
evaluating.
© 2009 John Wiley & Sons
Hoboken, NJ 07030
9
Managerial Accounting for the Hospitality Industry
Dopson & Hayes
Types of Ratios
Managerial accountants working in the hospitality industry
use:
Liquidity Ratios
Solvency Ratios
Activity Ratios
Profitability Ratios
Investor Ratios
Hospitality Specific Ratios
Most numbers for these ratios can be found on a company’s
income statement, balance sheet, and statement of cash flows.
© 2009 John Wiley & Sons
Hoboken, NJ 07030
10
Managerial Accounting for the Hospitality Industry
Dopson & Hayes
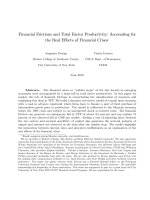
Figure 6.1 Condensed Income Statement
Blue Lagoon Water Park Resort
Condensed Income Statement
For the Period: January 1 through December 31, 2010
Income Statement
Revenue
Cost of Sales
Payroll and Related Expenses
Other Expenses
Gross Operating Profit
Rent, Property Taxes, and Insurance
Depreciation and Amortization
Net Operating Income
Interest
Income Before Income Taxes
Income Taxes
Net Income
© 2009 John Wiley & Sons
Hoboken, NJ 07030
11
25,201,800
2,854,080
8,877,600
5,934,240
7,535,880
1,760,400
1,260,000
4,515,480
1,272,000
3,243,480
1,297,390
1,946,090
Managerial Accounting for the Hospitality Industry
Dopson & Hayes
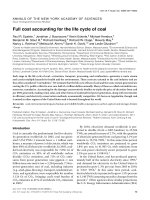
Figure 6.2 Balance Sheet
Blue Lagoon Water Park Resort
Balance Sheet
December 31, 2010
Assets
Current Assets
Cash
Marketable Securities
Net Receivables
Inventories
Total Current Assets
Investments
Property and Equipment
Land
Building
Furnishings and Equipment
Less Accumulated Depreciation
Net Property and Equipment
Other Assets
Total Assets
2,314,750
3,309,600
1,053,950
1,497,200
8,175,500
5,023,500
7,712,550
22,290,500
7,289,000
4,668,900
32,623,150
669,800
46,491,950
Liabilities and Owners’ Equity
Current Liabilities
Accounts Payable
Notes Payable
Other Current Liabilities
Total Current Liabilities
1,438,100
1,319,900
1,264,600
4,022,600
Long-Term Liabilities
Long-Term Debt
Total Liabilities
Owners’ Equity
Common Stock
Paid in Capital
Retained Earnings
Total Owners’ Equity
Total Liabilities and Owners’ Equity
© 2009 John Wiley & Sons
Hoboken, NJ 07030
12
14,577,400
18,600,000
3,000,000
18,775,100
6,116,850
27,891,950
46,491,950
Managerial Accounting for the Hospitality Industry
Dopson & Hayes
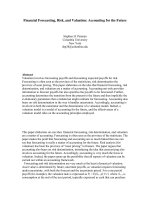
Figure 6.3 Statement of Cash Flows
Blue Lagoon Water Park Resort
Statement of Cash Flows
December 31, 2010
Net Cash Flow from Operating Activities
Net Income
Adjustments to reconcile net income to net
cash flow from operating activities
Depreciation
Decrease in Net Receivables
Increase in Inventories
Decrease in Accounts Payable
Decrease in Other Current Liabilities
Net cash flow from operating activities
Net Cash Flow from Investing Activities
Decrease in Marketable Securities
Increase in Investments
Increase in Furnishings and Equipment
Increase in Other Assets
Net cash flow from investing activities
Net Cash Flow from Financing Activities
Decrease in Notes Payable
Increase in Long-Term Debt
Increase in Capital Stock
(Common Stock + Paid in Capital)
Dividends Paid
Net cash flow from financing activities
1,946,090
1,260,000
601,350
(600,000)
(600,000)
(550,000)
800,000
(800,000)
(2,225,345)
(81,000)
(2,306,345)
(784,355)
755,650
1,000,000
(778,440)
192,855
Net decrease in cash during 2010
Cash at the beginning of 2010
Cash at the end of 2010
Supplementary Disclosure of Cash Flow
Information:
Cash paid during the year for:
Interest
Income Taxes
© 2009 John Wiley & Sons
Hoboken, NJ 07030
13
111,350
2,057,440
(56,050)
2,370,800
2,314,750
1,272,000
1,297,390
Managerial Accounting for the Hospitality Industry
Dopson & Hayes
Figure 6.4 Statement of Retained Earnings and Investor Information
Blue Lagoon Water Park Resort
December 31, 2010
© 2009 John Wiley & Sons
Hoboken, NJ 07030
Statement of Retained Earnings
Retained Earnings, December 31, 2009
Net Income for 2010
Subtotal
Cash Dividends Paid in 2010
Retained Earnings, December 31, 2010
4,949,200
1,946,090
6,895,290
778,440
6,116,850
Investor Information
Dividends paid to common shareholders
Common shares outstanding
Market price per share
Earnings per share
Dividends per share
$778,440
1,000,000
$25.00
$1.95
$0.78
14
Managerial Accounting for the Hospitality Industry
Dopson & Hayes
Liquidity Ratios
Liquidity is defined as the ease at which current assets can be
converted to cash in a short period of time (less than 12
months).
Liquidity ratios have been developed to assess just how
readily current assets could be converted to cash, as well as
how much current liabilities those current assets could pay.
© 2009 John Wiley & Sons
Hoboken, NJ 07030
15
Managerial Accounting for the Hospitality Industry
Dopson & Hayes
Liquidity Ratios
Three widely used liquidity ratios and working capital are:
Current Ratio
Quick (Acid-Test) Ratio
Operating Cash Flows to Current Liabilities Ratio
Working Capital
© 2009 John Wiley & Sons
Hoboken, NJ 07030
16
Managerial Accounting for the Hospitality Industry
Dopson & Hayes
Liquidity Ratios
Ratio Name
Definition
Source of Data
Formula
Current Ratio
Current ratio shows
the firm’s ability to
cover its current
liabilities with its
current assets.
Numerator: Balance Sheet
Current Assets
Current Liabilities
Quick ratio shows
the firm’s ability to
cover its current
liabilities with its
most liquid current
assets.
Numerator: Balance Sheet
Operating Cash
Flows to Current
Liabilities Ratio
Operating cash
flows to current
liabilities ratio
shows the firm’s
ability to cover its
current liabilities
with its operating
cash flows.
Numerator: Statement of cash flows
Working Capital
Working capital is
the difference
between current
assets and current
liabilities.
Balance Sheet
Quick
(Acid-Test) Ratio
© 2009 John Wiley & Sons
Hoboken, NJ 07030
Denominator: Balance Sheet
Cash + marketable securities + accounts receivable
Current liabilities
Denominator: Balance Sheet
or
Current assets – (inventories + prepaid expenses)
Current liabilities
Operating cash flows
Current liabilities
Denominator: Balance sheet
17
Current assets – Current liabilities
Managerial Accounting for the Hospitality Industry
Dopson & Hayes
Solvency Ratios
Solvency ratios help managers evaluate a company’s ability
to pay long term debt.
Solvency ratios are important because they provide lenders
and owners information about a business’s ability to
withstand operating losses incurred by the business. These
ratios are:
Solvency Ratio
Debt to Equity Ratio
Debt to Assets Ratio
Operating Cash Flows to Total Liabilities Ratio
Times Interest Earned Ratio
© 2009 John Wiley & Sons
Hoboken, NJ 07030
18
Managerial Accounting for the Hospitality Industry
Dopson & Hayes
Solvency Ratios
Ratio Name
Definition
Source of Data
Formula
Solvency Ratio
Solvency ratio shows the firms
ability to cover its total
liabilities with its total assets.
Numerator: Balance Sheet
Total assets
Total liabilities
Debt to equity ratio compares
total liabilities to owners’
equity.
Numerator: Balance Sheet
Debt to assets ratio shows the
percentage of assets financed
through debt.
Numerator: Balance Sheet
Operating cash flows to total
liabilities ratio shows the firm’s
ability to cover its total
liabilities with its operating
cash flows.
Numerator: Statement of cash
flows
Times interest earned shows
the firm’s ability to cover
interest expenses with
earnings before interest and
taxes.
Numerator: Income statement
Debt to Equity
Ratio
Debt to Assets
Ratio
Operating Cash
Flows to Total
Liabilities Ratio
Times Interest
Earned Ratio
© 2009 John Wiley & Sons
Hoboken, NJ 07030
19
Denominator: Balance Sheet
Total liabilities
Total owners’ equity
Denominator: Balance Sheet
Total liabilities
Total assets
Denominator: Balance Sheet
Operating cash flows
Total liabilities
Denominator: Balance sheet
Earnings Before Interest and Taxes (EBIT)
Interest Expense
Denominator: Income statement
Managerial Accounting for the Hospitality Industry
Dopson & Hayes
Activity Ratios
The purpose of computing activity ratios is to assess
management’s ability to effectively utilize the company’s
assets.
Activity ratios measure the “activity” of a company’s
selected assets by creating ratios that measure the number of
times these assets turn over (are replaced).
This assesses management’s efficiency in handling
inventories and long-term assets.
© 2009 John Wiley & Sons
Hoboken, NJ 07030
20
Managerial Accounting for the Hospitality Industry
Dopson & Hayes
Activity Ratios
These ratios are also known as turnover ratios or efficiency
ratios.
In this section you will learn about the following activity
ratios:
Inventory Turnover
Property and Equipment (Fixed Asset) Turnover
Total Asset Turnover
© 2009 John Wiley & Sons
Hoboken, NJ 07030
21
Managerial Accounting for the Hospitality Industry
Dopson & Hayes
Inventory Turnover
Inventory turnover refers to the number of times the total
value of inventory has been purchased and replaced in an
accounting period.
In restaurants, we calculate food and beverage inventory
turnover ratios.
See Go Figure! for calculations (after Figure 6.5)
The obvious question is, “Are the food and beverage turnover
ratios good or bad?”
The answer to this question is relative to the target (desired)
turnover ratios.
© 2009 John Wiley & Sons
Hoboken, NJ 07030
22
Managerial Accounting for the Hospitality Industry
Dopson & Hayes
Figure 6.5 Condensed Food and Beverage Department Schedule
Blue Lagoon Water Park Resort
Condensed Food and Beverage Department Schedule
For the Period: January 1 through December 31, 2010
Sales
Cost of sales:
Beginning inventory
+ Purchases
- Ending inventory
= Cost of goods consumed**
- Employee meals
= Cost of goods sold**
Gross profit
Operating expenses:
Payroll and related expenses
Other expenses
Total expenses
Department income
Food
7,200,000
Beverage
2,880,000
120,000
2,160,400
90,000
2,190,400
52,000
2,138,400
5,061,600
60,000
436,440
45,000
451,440
0
451,440
2,428,560
2,188,800
532,800
2,721,600
2,340,000
534,960
201,600
736,560
1,692,000
**The discussion of cost of goods sold and cost of goods consumed will be
explained later in this chapter in the Hospitality-Specific Ratios section.
© 2009 John Wiley & Sons
Hoboken, NJ 07030
23
Managerial Accounting for the Hospitality Industry
Dopson & Hayes
g o fig u re!
For example, assume the Blue Lagoon food and beverage manager desires to
turn over food inventory 26 times per year. This means that food inventory will
be replaced every two weeks (52 weeks per year/26 times = 2 weeks). The
following shows situations in which actual food inventory turnover is above and
below the Blue Lagoon target of 26 times.
Blue Lagoon food inventory turnover:
Actual turnover (low)
Target turnover
Actual turnover (high)
20.9 times
26.0 times
32.0 times
A low turnover (20.9 times) might have occurred because sales were less than
expected, thus causing food to move slower out of inventory (bad). It could also
mean that the food and beverage manager decided to buy more inventory each
time (thus, making purchases fewer times) because of discount prices due to
larger (bulk) purchases (good).
A high turnover (32.0 times) might have occurred because sales were higher
than expected, thus causing food to move faster out of inventory (good). It could
also mean that significant wastage, pilferage, and spoilage might have occurred
causing food to move out of inventory faster, but not due to higher sales (bad).
© 2009 John Wiley & Sons
Hoboken, NJ 07030
24
Managerial Accounting for the Hospitality Industry
Dopson & Hayes
Activity Ratios
Ratio Name
Definition
Source of Data
Formula
Food Inventory
Turnover Ratio
Food inventory turnover shows the
speed (# of times) that food inventory
is replaced (turned) during a year
Numerator: Income statement
Cost of food consumed
Average food inventory*
Beverage inventory turnover shows
the speed (# of times) that beverage
inventory is replaced (turned) during a
year
Numerator: Income statement
Property and Equipment
(Fixed Asset) Turnover
Ratio
Property and equipment turnover ratio
shows management’s ability to
effectively use net property and
equipment to generate revenues.
Numerator: Income statement
Total Asset Turnover
Ratio
Total asset turnover shows
management’s ability to effectively
use total assets to generate revenues.
Numerator: Income statement
Beverage Inventory
Turnover Ratio
© 2009 John Wiley & Sons
Hoboken, NJ 07030
25
Denominator: Balance sheet
*(Beginning food inventory
+ Ending food inventory)/2
Cost of beverage consumed
Average beverage inventory**
Denominator: Balance sheet
**(Beginning beverage inventory
+ Ending beverage inventory)/2
Total Revenue
Net Property and Equipment
Denominator: Balance sheet
Total Revenue
Total Assets
Denominator: Balance sheet
Managerial Accounting for the Hospitality Industry
Dopson & Hayes