Ebook Atlas of polysomnography (2/E): Part 1
Bạn đang xem bản rút gọn của tài liệu. Xem và tải ngay bản đầy đủ của tài liệu tại đây (10.88 MB, 212 trang )
Atlas of
Polysomnography
FM.indd i
8/7/2009 3:28:00 PM
FM.indd ii
8/7/2009 3:28:00 PM
Atlas of
Polysomnography
SECOND EDITION
James D. Geyer, MD
Director, Sleep Program
Associate Professor of Neurology and Sleep Medicine
Alabama Neurology and Sleep Medicine
Tuscaloosa, Alabama
Paul R. Carney, MD
Wilder Professor and Chief
Division of Pediatric Neurology
Director, Comprehensive Pediatric Epilepsy Program
Departments of Pediatrics and Neurology
McKnight Brain Institute
University of Florida College of Medicine
Gainesville, Florida
Troy A. Payne, MD
Medical Director
St Cloud Hospital Sleep Center
St Cloud, Minnesota
FM.indd iii
8/7/2009 3:28:00 PM
Acquisitions Editor: Lisa McAllister
Product Manager: Tom Gibbons
Vendor Manager: Alicia Jackson
Senior Manufacturing Manager: Benjamin Rivera
Marketing Manager: Brian Freiland
Design Coordinator: Holly McLaughlin
Production Service: SPi Technologies
” 2010 by Lippincott Williams & Wilkins, a Wolters Kluwer business
530 Walnut Street
Philadelphia, PA 19106 USA
LWW.com
All rights reserved. This book is protected by copyright. No part of this book may be reproduced in any form by any means,
including photocopying, or utilized by any information storage and retrieval system without written permission from the copyright owner, except for brief quotations embodied in critical articles and reviews. Materials appearing in this book prepared by
individuals as part of their official duties as U.S. government employees are not covered by the above-mentioned copyright.
Printed in China
Library of Congress Cataloging-in-Publication Data
Atlas of polysomnography / James D. Geyer, Paul R. Carney, Troy Payne.—2nd ed.
p. ; cm.
Rev. ed. of: Atlas of digital polysomnography / James D. Geyer ... [et al.]. c2000.
Includes index.
ISBN-13: 978-1-6054-7228-7
ISBN-10: 1-6054-7228-X
1. Sleep disorders—Atlases. 2. Polysomnography—Atlases. I. Geyer, James D. II. Carney, Paul R. III. Payne, Troy.
IV. Atlas of digital polysomnography.
[DNLM: 1. Sleep—physiology—Atlases. 2. Polysomnography—Atlases. 3. Sleep Disorders—diagnosis—Atlases.
WL 17 A8844 2010]
RC547.A836 2010
616.8’498—dc22
2009028925
Care has been taken to confirm the accuracy of the information presented and to describe generally accepted practices. However,
the authors, editors, and publisher are not responsible for errors or omissions or for any consequences from application of the
information in this book and make no warranty, expressed or implied, with respect to the currency, completeness, or accuracy
of the contents of the publication. Application of the information in a particular situation remains the professional responsibility of the practitioner.
The authors, editors, and publisher have exerted every effort to ensure that drug selection and dosage set forth in this text
are in accordance with current recommendations and practice at the time of publication. However, in view of ongoing research,
changes in government regulations, and the constant flow of information relating to drug therapy and drug reactions, the reader
is urged to check the package insert for each drug for any change in indications and dosage and for added warnings and precautions. This is particularly important when the recommended agent is a new or infrequently employed drug.
Some drugs and medical devices presented in the publication have Food and Drug Administration (FDA) clearance for
limited use in restricted research settings. It is the responsibility of the health care provider to ascertain the FDA status of each
drug or device planned for use in their clinical practice.
To purchase additional copies of this book, call our customer service department at (800) 638—3030 or fax orders to (301)
223—2320. International customers should call (301) 223—2300.
Visit Lippincott Williams & Wilkins on the Internet: at LWW.com. Lippincott Williams & Wilkins customer service representatives are available from 8:30 am to 6 pm, EST.
10 9 8 7 6 5 4 3 2 1
FM.indd iv
8/7/2009 3:28:01 PM
To our families
and to the memory of Michael Aldrich
FM.indd v
8/7/2009 3:28:01 PM
Contributors
Monica Henderson, RN, RPSGT
Sleep Health Coordinator
Department of Sleep Medicine
Alabama Neurology and Sleep Medicine
Tuscaloosa, Alabama
Sachin Talathi, PhD
J. Crayton Pruitt Family Department of Biomedical
Engineering
University of Florida McKnight Brain Institute
Gainesville, Florida
Jennifer Parr, RPSGT
Chief Sleep Technician
DCH Sleep Center
DCH Health System
Northport, Alabama
Julie Tsikhlakis, RN, BSN
Sleep Health Coordinator
Department of Sleep Medicine
Alabama Neurology and Sleep Medicine
Tuscaloosa, Alabama
Betty Seals, REEGT
Director
DCH Sleep Center
DCH Health System
Tuscaloosa, Alabama
vi
FM.indd vi
8/7/2009 3:28:01 PM
Preface to the Second Edition
Sleep medicine continues to evolve rapidly as a subspecialty
with numerous disorders now recognized and an ever-changing
set of diagnostic criteria and protocols. As with any medical
discipline, accurate diagnosis is an essential prerequisite for
a rational approach to management. Polysomnography, the
recording of multiple physiologic functions during sleep, was
developed in the 1970s and is the most important laboratory
test used in sleep medicine. Polysomnography complements
the clinical evaluation and assists with diagnosis and management of a variety of sleep disorders.1
Digital amplifiers and computerized signal processing are
now the standard of care and provide many advantages over
older analog amplifiers and paper recording. This is especially
true for the evaluation of brief electroencephalographic (EEG)
transients such as epileptiform sharp waves and spikes and their
differentiation from artifacts and benign EEG waveforms. This
section of the book has been significantly expanded. Digitized
data can also be displayed using a variety of montages depending on the purpose at hand; for example, the display can be
limited to EEG, electro-oculogram (EOG), and chin electromyogram (EMG) during sleep staging and then expanded to
include respiratory and leg movement channels during scoring
of these functions. Filters and sensitivities can be altered during
review to assist with interpretation of the study.
While digital polysomnography provides a number of
advantages as described above, features related to signal acquisition, display resolution, and printer resolution must be understood by the technologist and the interpreter. For digital signal
acquisition, the analog signal generated by the transducer must
be converted to digitized information. A critical variable is the
rate at which the signal is sampled and digitized. For slowly
varying signals, such as thoracic motion, a sampling rate of
20 Hz may be sufficient; for rapidly varying signals, such as
EEG and EMG, the sampling rate must be much higher, usually
250 Hz or more. If the sampling rate is inadequate, waveforms
are distorted and scoring and interpretation may be erroneous.
For example, if the sampling rate for eye movement channels is
too low, the sharp deflection associated with a rapid eye movement may appear as a slower deflection characteristic of a slow
eye movement.
Because of the differences in signal acquisition and display
parameters, not all digital recordings have the same appearance. In addition, although transducers used for the recording
of EEG, EOG, and EMG are largely standardized, EEG and EOG
montages vary among laboratories. Furthermore, transducers
and recording techniques for the assessment of respiration during sleep vary widely among sleep laboratories.2 For example,
airflow can be monitored directly with a pneumotachograph,
thermistor, or thermocouple or indirectly with the recordings
of tracheal sound or by the summation of signals from thoracic and abdominal inductance recordings. Respiratory effort
can be assessed with respiratory inductance plethysmography,
stretch sensitive transducers (strain gauges), diaphragmatic
EMG, intrathoracic (esophageal) pressure, or nasal pressure.
Scoring of sleep stages has been standardized for many years3
and has recently been updated.4 The new scoring and staging
criteria are discussed in detail in the text and the waveforms are
presented in appropriate chapters.
As a result of these variations, the overall appearance of the
polysomnographic display may be markedly different from one
laboratory to the next. No atlas can provide examples of normal and abnormal polysomnography using all of the displays
and transducers used in accredited sleep laboratories. For this
atlas, the illustrations were prepared from several sleep centers
vii
FM.indd vii
8/7/2009 3:28:01 PM
viii
PREFACE TO THE SECOND EDITION
and electrodiagnostic/neurophysiology laboratories in order to
introduce the reader to several of the possible formats.
This atlas is designed to aid the sleep medicine specialist
and those training in sleep medicine. It also serves as a reference and training tool for technologists. The atlas covers normal polysomnographic features of wakefulness and the various
stages of sleep as well as polysomnographic findings characteristic of sleep-related breathing disorders, sleep-related movements, and parasomnias. In addition, examples of cardiac
arrhythmias, nocturnal seizures, and artifacts are included.
A variety of time scales are used to illustrate their value.
3. Rechtschaffen A, Kales A. A Manual of Standardized Terminology, Techniques, and Scoring System for Sleep Stages of Human Subjects. Los Angeles:
Brain Information Service/Brain Research Institute, 1968.
4. Iber C, Ancoli-Israel S, Chesson A, Quan SF. The AASM Manual for the
Scoring of Sleep and Associated Events: Rules, Terminology and Technical Specifications. 1st Ed. Westchester, Illinois: American Academy of Sleep Medicine, 2007.
REFERENCES
1. American Academy of Sleep Medicine. International Classification of Sleep
Disorders. 2nd Ed. Diagnostic and coding manual. Westchester, Illinois:
American Academy of Sleep Medicine, 2005.
2. Parisi RA, Santiago TV. Respiration and respiratory function: Technique
of recording and evaluation. In: Chokroverty S, ed. Sleep Disorders Medicine: Basic Sciences, Technical Considerations, and Clinical Aspects. Boston:
Butterworth-Heinemann, 1994:127–139.
FM.indd viii
8/7/2009 3:28:01 PM
Preface to the First Edition
Sleep medicine is a relatively new medical subspecialty that is
rapidly expanding as the prevalence and importance of sleep
disorders have become apparent. As with any medical discipline, accurate diagnosis is an essential prerequisite for a rational approach to management. Polysomnography, the recording
of multiple physiologic functions during sleep, was developed
in the 1970s and is the most important laboratory test used
in sleep medicine. Polysomnography complements the clinical evaluation and assists with diagnosis and management of a
wide range of sleep disorders.1
As the array of sleep diagnoses has expanded, the techniques and equipment used for sleep recordings have become
more sophisticated. While sleep studies in the 1970s used analog amplifiers and bulky paper recordings that rarely consisted
of more than eight channels, computer technology of the late
1990s permits recording of dozens of channels using sensitive
noninvasive or minimally invasive transducers, digital amplifiers, electronic displays, and compact data storage on magnetic
or optical media.2
Digital amplifiers and computerized signal processing provide many advantages over older analog amplifiers and paper
recording. For example, digitized data can be displayed using
a compressed time scale that makes slow rhythms more readily identifiable, such as the regular occurrence of periodic leg
movements at 20- to 30-second intervals. Alternatively, an
expanded time scale can be used that permits easier identification of brief electroencephalographic (EEG) transients such as
epileptiform sharp waves and spikes and their differentiation
from artifacts and benign EEG waveforms. Digitized data can
also be displayed using a variety of montages depending on
the purpose at hand; for example, the display can be limited
to EEG, electro-oculogram (EOG), and chin electromyogram
(EMG) during sleep staging and then expanded to include
respiratory and leg movement channels during scoring of these
functions. Filters and sensitivities can be altered during review
to assist with interpretation of the study.
In addition to digital polysomnography, several other technical advances have improved the diagnostic value of sleep
recordings. Polysomnography can be combined with video
recording (video-polysomnography); the simultaneous analysis of behavior and polysomnographic findings assists with the
diagnosis of parasomnias, nocturnal seizures, and other sleeprelated behaviors. To assist with the diagnosis of sleep-related
breathing disorders, intrathoracic pressure can be monitored
with intraesophageal pressure sensors that are easily inserted
and well tolerated. With the availability of 16 to 32 or more
channels for a recording, esophageal pH, end-tidal carbon dioxide level, and transcutaneous CO2 monitoring can be included
in selected situations without sacrificing standard channels.
While digital polysomnography provides a number of
advantages as described above, features related to signal acquisition, display resolution, and printer resolution must be understood by the technologist and the interpreter. For digital signal
acquisition, the analog signal generated by the transducer must
be converted to digitized information. A critical variable is the
rate at which the signal is sampled and digitized. For slowly
varying signals, such as thoracic motion, a sampling rate of 20
Hz may be sufficient; for rapidly varying signals, such as EEG
and EMG, the sampling rate must be much higher, usually 250
Hz or more. If the sampling rate is inadequate, waveforms are
distorted and scoring and interpretation may be erroneous. For
example, if the sampling rate for eye movement channels is too
ix
FM.indd ix
8/7/2009 3:28:01 PM
x
PREFACE TO THE FIRST EDITION
low, the sharp deflection associated with a rapid eye movement
may appear as a slower deflection characteristic of a slow eye
movement.
Display resolution is based on the characteristics of the
computer, the display monitor, and the software used for data
acquisition and display. The array of pixels in the screen determines the maximum resolution; for example, a 1024 x 768
display provides lower resolution than a 1600 x 1200 display.
While the lower resolution display may be sufficient for the
assessment of slowly varying signals such as respiration, it may
be inadequate for identification of rapid EEG transients.
Printer resolution is based on the characteristics of the
printer, computer, and software. In some cases, waveforms that
are not adequately displayed on the monitor can be better analyzed if a high resolution printout is obtained.
Because of the differences in signal acquisition and display
parameters, not all digital recordings have the same appearance. In addition, although transducers used for the recording
of EEG, EOG, and EMG are largely standardized, EEG and EOG
montages vary among laboratories. Furthermore, transducers
and recording techniques for the assessment of respiration during sleep vary widely among sleep laboratories.3 For example,
airflow can be monitored directly with a pneumotachograph,
thermistor, or thermocouple or indirectly with the recordings
of tracheal sound or by the summation of signals from thoracic
and abdominal inductance recordings. Respiratory effort can be
assessed with respiratory inductance plethysmography, stretch
sensitive transducers (strain gauges), diaphragmatic EMG,
intrathoracic (esophageal) pressure, or nasal pressure. Furthermore, although scoring of sleep stages has been standardized
for many years,4 no consensus has been reached at this writing
concerning scoring criteria for respiratory events.
As a result of these variations, the overall appearance of the
polysomnographic display may be markedly different from
one laboratory to the next. No atlas can provide examples of
normal and abnormal polysomnography using all of the displays and transducers used in accredited sleep laboratories. For
this atlas, all of the illustrations were prepared from the sleep
studies performed at the University of Michigan Sleep Disorders Center, or, in a few cases, from the neonatal EEG studies
FM.indd x
performed in the University of Michigan Electrodiagnostic
Laboratory. The studies were recorded using digital equipment
manufactured by the Telefactor Corporation (Conshohocken,
PA). The montages, filter settings, sensitivities, and A-D sampling rates used to generate the displays are specified in the
Technical Introduction.
The illustrations were prepared based on 1600 x 1200
screen displays and were printed with a Hewlett-Packard Laser
Jet printer on 8.5 x 11 inch paper at 600 dot per inch resolution.
The EEG electrodes were placed according to the International 10–20 system.
The EOG electrodes were placed 1 cm superior and lateral
to the right outer canthus and 1 cm inferior and lateral to the
left outer canthus.
One chin EMG electrode was placed on the chin (mental)
and two electrodes were placed under the chin (submental).
The submental electrode placement is generally at the mandible. Generally, there is a 3-cm distance between electrodes.
The EKG was recorded with one electrode each placed 2 to
3 cm below the left and right clavicles midway between the
shoulder and the neck..
Many of the recordings also include the second EKG channel recorded from a left leg EMG channel and a left ear electrode.
Airflow was recorded with a single channel nasal/oral thermocouple from Pro-Tech (Woodinville, WA). This thermocouple has sensors for each nostril and another that is located over
the mouth.
Thoracic and abdominal motion were recorded with respiratory effort sensors utilizing piezoelectric crystal sensors from
EPM Systems (Midlothian, VA). These sensors are attached to a
belt that is placed around the patient.
For many of the recordings, an additional system was used
to assess respiratory effort. This system, labeled Backup in the
montages, was also recorded with piezoelectric crystal sensors
from EPM Systems (Midlothian, VA). This backup belt was
placed between the thoracic and the abdominal belts.
Snoring sound was recorded with piezoelectric crystal sensors from EPM Systems (Midlothian, VA). This sensor is placed
8/7/2009 3:28:01 PM
PREFACE TO THE FIRST EDITION
either 2 cm to the left or right of the trachea, midway down the
neck.
Oximetry was recorded with an Ohmeda model 3740 (Louisville, CO). Oximetry was recorded from a finger site.
Many of the illustrations were obtained from studies of
patients who were undergoing a treatment trial of continuous
positive airway pressure (CPAP) or bilevel positive airway pressure (BPAP) and include recordings of mask flow and tidal volume. The CPAP and BPAP equipment, which generated these
signals, included models manufactured by Respironics, Inc.
and Healthdyne.
This atlas is designed to aid the sleep medicine specialist
and those training in sleep medicine. It also serves as a reference and training tool for technologists. The atlas covers normal polysomnographic features of wakefulness and the various
stages of sleep as well as polysomnographic findings characteristic of sleep-related breathing disorders, sleep-related movements, and parasomnias. In addition, examples of cardiac
arrhythmias, nocturnal seizures, and artifacts are included.
While most of the figures use a 30-second time base, a variety of
shorter and longer time scales are used to illustrate their value.
FM.indd xi
xi
REFERENCES
1. American Sleep Disorders Association. International Classification of
Sleep Disorders. Diagnostic and coding manual, Revised. Rochester,
Minnesota: American Sleep Disorders Association, 1997.
2. Gotman J. The use of computers in analysis and display of EEG and
evoked potentials. In: Daly DD, Pedley TA, eds. Current Practice of Clinical Electroencephalography. 2nd Ed. New York: Raven Press, 1990:51–83.
3. Parisi RA, Santiago TV. Respiration and respiratory function: Technique
of recording and evaluation. In: Chokroverty S, ed. Sleep Disorders Medicine: Basic Sciences, Technical Considerations, and Clinical Aspects. Boston:
Butterworth-Heinemann, 1994:127–139.
4. Rechtschaffen A, Kales A. A Manual of Standardized Terminology, Techniques, and Scoring System for Sleep Stages of Human Subjects. Los Angeles: Brain Information Service/ Brain Research Institute, 1968.
8/7/2009 3:28:01 PM
Acknowledgments to
the Second Edition
As in all projects of this type, thanks must go to the technical
and support staff at each of our sleep centers: the DCH Sleep
Center, the University of Florida, and the St.Cloud Hospital
Sleep Center.
A special thanks goes to Leanne McMillan, Tom Gibbons,
Fran DeStefano, Lisa McAllister, and the other members of the
editorial and production staff at Lippincott Williams & Wilkins
who provided important suggestions and support.
Finally, a special thanks goes to our wives and families for
their unwavering support.
xii
FM.indd xii
8/7/2009 3:28:01 PM
Acknowledgments to
the First Edition
Ronald Chervin, M.D., and Beth Malow, M.D., were invaluable contributors to this project. The other faculty members
of the University of Michigan, Department of Neurology, Clinical Neurophysiology Laboratory, Ivo Drury, M.B B.Ch., Ahmad
Beydoun, M.D., Linda Selwa, M.D., Robert MacDonald, M.D.,
Ph.D., Jaideep Kapur, M.D., Ph.D., Erasmo Passaro, M.D., and
Wassim Nasreddine, M.D., were vital to both the fellowship
program in sleep medicine and the production of this text.
The other members of the fellowship training programs in
sleep medicine and clinical neurophysiology provided support,
ideas, and interesting studies. We, therefore, thank and acknowledge the contributions of Sarah Nath, M.D., L. John Greenfield,
M.D., Ph.D., Kirk Levy, M.D., and Willie Anderson, M.D.
As in all projects of this type, a special thanks must go to
the technical and support staff. In particular, we would like to
thank Ken Morton, RPSGT, sleep laboratory supervisor at the
University of Michigan and Brenda Livingston, clinic coordinator at the University of Michigan Sleep Disorders Center.
A special thanks goes to Anne Sydor, Ph.D., and the other
members of the editorial and production staff at Lippincott
Williams & Wilkins who provided important suggestions and
support.
Finally, a special thanks goes to our families for their unwavering support.
xiii
FM.indd xiii
8/7/2009 3:28:02 PM
Contents
Contributors
Preface to the Second Edition
Preface to the First Edition
Acknowledgments to the Second Edition
Acknowledgments to the First Edition
vi
vii
ix
xii
xiii
1
17
Electroencephalographic
Abnormalities
James D. Geyer, Troy A. Payne,
and Paul R. Carney
James D. Geyer, Troy A. Payne,
and Paul R. Carney
CHAPTER 3
CHAPTER 8
Artifacts
89
CHAPTER 9
CHAPTER 4
Electrocardiography
James D. Geyer, Troy A. Payne,
and Paul R. Carney
101
225
251
James D. Geyer, Troy A. Payne,
and Paul R. Carney
James D. Geyer, Troy A. Payne,
and Paul R. Carney
Breathing Disorders
209
James D. Geyer, Troy A. Payne,
and Paul R. Carney
CHAPTER 7
CHAPTER 2
Multiple Sleep Latency Test (MSLT)/
Maintenance of Wakefulness
Test (MWT)
197
James D. Geyer, Troy A. Payne,
and Paul R. Carney
Parasomnias
James D. Geyer, Troy A. Payne,
Sachin Talathi, and Paul R. Carney
Staging
Limb Movement Disorders
CHAPTER 6
CHAPTER 1
Introduction to Sleep and
Polysomnography
CHAPTER 5
261
James D. Geyer, Troy A. Payne,
and Paul R. Carney
xiv
FM.indd xiv
8/7/2009 3:28:02 PM
CONTENTS
APPENDIX A
CHAPTER 10
Calibrations
287
James D. Geyer, Troy A. Payne,
and Paul R. Carney
297
James D. Geyer, Troy A. Payne,
and Paul R. Carney
315
APPENDIX C
301
Multiple Sleep Latency Test (MSLT) Protocol
James D. Geyer, Troy A. Payne,
Paul R. Carney, and Betty Seals
CHAPTER 13
APPENDIX D
James D. Geyer, Paul R. Carney,
Troy A. Payne, and Jennifer Parr
FM.indd xv
Patient Calibrations for Nighttime
Polysomnography
James D. Geyer, Troy A. Payne,
and Paul R. Carney
Recording Artifacts and Solving
Technical Problems with
Polysomnography Technology
313
James D. Geyer, Troy A. Payne,
Paul R. Carney, and Julie Tsikhlakis
James D. Geyer, Troy A. Payne
Paul R. Carney, and Monica Henderson
CHAPTER 12
Technical Background
Electrode Placement
APPENDIX B
CHAPTER 11
Actigraphy
xv
Maintenance of Wakefulness Test (MWT)
Protocol
309
317
321
James D. Geyer, Troy A. Payne,
and Paul R. Carney
Index
323
8/7/2009 3:28:02 PM
FM.indd xvi
8/7/2009 3:28:02 PM
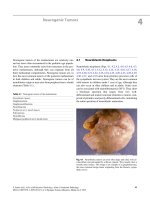
CHAPTER
1
Introduction to Sleep
and Polysomnography
James D. Geyer, MD
Troy A. Payne, MD
Sachin Talathi, PhD
Paul R. Carney, MD
OVERVIEW OF SLEEP STAGES AND CYCLES
The monitoring of sleep is complex and requires a distinct
skill set including a detailed knowledge of EEG, respiratory
monitoring, and EKG. Expertise in only one of these areas
does not confer the ability to accurately interpret the polysomnogram.
Sleep is not homogeneous and is characterized by sleep
stages based on electroencephalographic (EEG) or electrical
brain wave activity, electrooculographic (EOG) or eye movements, and electromyographic (EMG) or muscle electrical
activity (1–3). The basic terminology and methods involved
with monitoring each of these types of activity will be discussed
below. Sleep is composed of nonrapid eye movement (NREM)
and rapid eye movement (REM) sleep. NREM sleep is further
divided into stages N1, N2, and N3. Stages N3 and N4 sleep
were recently combined into stage N3 sleep. Stages N1 and N2
are called light sleep and stage N3 is called deep or slow-wave
sleep. There are usually four or five cycles of sleep, each composed of a segment of NREM sleep followed by REM sleep. Periods of wake may also interrupt sleep during the night. As the
night progresses, the length of REM sleep in each cycle usually
increases. The hypnogram is a convenient method of graphically displaying the organization of sleep during the night. Each
stage of sleep is characterized by a level on the vertical axis of
the graph with time of night on the horizontal axis. REM sleep
is often highlighted by a dark bar.
Sleep monitoring was traditionally by polygraph recording
using ink-writing pens which produced tracings on paper. It was
convenient to divide the night into epochs of time that correspond to the length of each paper page. The usual paper speed for
sleep recording is 10 mm per second; a 30-cm page corresponds to
30 seconds. Each segment of time represented by one page is called
an epoch; sleep is staged in epochs. Today most sleep recording
is performed digitally, but the convention of scoring sleep in
30-second epochs or windows is still the standard. If there is a
shift in sleep stage during a given epoch, the stage present for the
majority of the time names the epoch. When the tracings used to
stage sleep are obscured by artifact for more than one half of an
epoch, it is scored as movement time (MT). When an epoch of
what would otherwise be considered MT is surrounded by epochs
of wake, the epoch is also scored as wake. Some sleep centers consider MT to be wake and do not tabulate it separately.
SLEEP ARCHITECTURE DEFINITIONS
The term sleep architecture describes the structure of sleep.
Common terms used in sleep monitoring are listed in
1
Chap01.indd 1
8/6/2009 4:01:10 PM
2
CHAPTER 1
Table 1-1. The total monitoring time or total recording time
(TRT) is also called total bedtime (TBT). This is the time duration from lights out (start of recording) to lights on (termination of recording). The total amount of sleep stages N1,
N2, N3, R, and MT is termed the total sleep time (TST). The
time from the first sleep until the final awakening is called
the sleep period time (SPT). SPT encompasses all sleep as well
as periods of wake after sleep onset and before the final awakening. This wake time is termed the WASO (wake after sleep
onset). Therefore, SPT = TST + WASO. The time from the start
of sleep monitoring (or lights out) until the first epoch of
sleep is called the sleep latency. The time from the first epoch
of sleep until the first REM sleep is called the REM latency.
It is useful to determine not only the total minutes of each
sleep stage, but also to characterize the relative proportion of
time spent in each sleep stage. One can characterize stages N1
to N3 and REM as a percentage of total sleep time (%TST).
Another method is to characterize the sleep stages and WASO
as a percentage of the sleep period time (%SPT). Sleep efficiency (in percent) is usually defined as either the TST × 100/
SPT or TST × 100/TBT.
TABLE 1-1
•
•
•
•
•
•
•
•
•
•
•
•
Chap01.indd 2
Sleep Architecture Definitions
Lights out—start of sleep recording
Light on—end of sleep recording
TBT (total bedtime)—time from lights out to Lights on
TST (total sleep time) = minutes of stages N1, N2, N3, and R
WASO (wake after sleep onset)—minutes of wake after first
sleep but before the final awakening
SPT (sleep period time) = TST + WASO
Sleep latency—time from lights out until the first epoch of
sleep
REM latency—time from first epoch of sleep to the first epoch
of REM sleep
Sleep efficiency—(TST × 100)/ TBT
Stage N1, N2, N3, and R as % TST—percentage of TST
occupied by each sleep stage
Stage N1, N2, N3, and R, WASO as % SPT—percentage of SPT
occupied by sleep stages and WASO
Arousal index
The normal range of the percentage of sleep spent in each
sleep stage varies with age (2,3) and is impacted by sleep disorders (Table 1-2). In adults there is a decrease in stage N3
sleep with increasing age, while the amount of REM sleep
remains fairly constant. The amount of stage N1 sleep and
WASO also increases with age. In patients with severe obstructive sleep apnea (OSA) there is often no stage N3 sleep and a
reduced amount of REM sleep. Chronic insomnia (difficulty
initiating or maintaining sleep) is characterized by a long
sleep latency and increased WASO. The amount of stages N3
and R sleep is commonly decreased as well. The REM latency
is also affected by sleep disorders and medications. A short
REM latency (usually <70 minutes) is noted in some cases of
sleep apnea, depression, narcolepsy, prior REM sleep deprivation, and the withdrawal of REM suppressant medications.
An increased REM latency can be seen with REM suppressants
(ethanol and many antidepressants), an unfamiliar or uncomfortable sleep environment, sleep apnea, and any process that
disturbs sleep quality.
INTRODUCTION
TO ELECTROENCEPHALOGRAPHIC
TERMINOLOGY AND MONITORING
EEG activity is characterized by the frequency in cycles per
second or hertz (Hz), amplitude (voltage), and the direction of
major deflection (polarity). The classically described frequency
ranges are delta (<4 Hz), theta (4 to 7 Hz), alpha (8 to 13 Hz),
and beta (>13 Hz). Alpha waves (8 to 13 Hz) are commonly
noted when the patient is in an awake, but relaxed, state with
the eyes closed. They are best recorded over the occiput and are
attenuated when the eyes are open. Bursts of alpha waves also
are seen during brief awakenings from sleep—called arousals.
Alpha activity can also be seen during REM sleep. Alpha activity is prominent during drowsy eyes-closed wakefulness. This
activity decreases with the onset of stage N1 sleep. Near the
transition from stage N1 to stage N2 sleep, vertex sharp waves—
high-amplitude negative waves (upward deflection on EEG
tracings) with a short duration—occur. They are more prominent in central than in occipital EEG tracings. A sharp wave
8/6/2009 4:01:10 PM
INTRODUCTION TO SLEEP AND POLYSOMNOGRAPHY
TABLE 1-2
3
Representative Changes in Sleep Architecture
20-Year-Old
60-Year-Old
Severe Sleep Apneaa
WASO% SPT
5
15
20
1% SPT
5
5
10
2% SPT
50
55
60
3% SPT
20
5
0
REM% SPT
25
20
10
a
High interpatient variability.
TABLE 1-3
Standard Sensitivity and Filter Settings
Sensitivity
Low Filter
High Filter
EEG
50 μV = 1 cm; 100 μV = 1 channel width
0.3a
35a
EOG
50 μV = 1 cm; 100 μV = 1 channel width
0.3
35
EMG
50 μV = 1 cm; 100 μV = 1 channel width
10
100
0.1
35
0.1
15
EKG
Airflow (thermistor)
Variable
Chest
Variable
0.1
15
Abdomen
Variable
0.1
15
SaO2 (%)
1 Volt = 0–100 or 50%–100%
DC
15
Nasal pressure machine flow
Variable
DC or AC with low filter
setting of 0.01
15
100 (to see snoring)
a
Note that these filter settings are different from traditional EEG monitoring settings.
is defined as deflection of 70 to 200 milliseconds in duration
(Table 1-3).
Sleep spindles are oscillations of 12 to 14 Hz with a duration
of 0.5 to 1.5 seconds. They are characteristic of stage N2 sleep.
They may persist into stage N3, but usually do not occur in
stage R. The K complex is a high-amplitude, biphasic wave of
at least 0.5-second duration. As classically defined, a K complex consists of an initial sharp, negative voltage (by convention an upward deflection) followed by a positive-deflection
(down) slow wave. Spindles frequently are superimposed on
Chap01.indd 3
K complexes. Sharp waves differ from K complexes in that they
are narrower, not biphasic, and usually of lower amplitude.
As sleep deepens, slow (delta) waves appear. These are
high-amplitude, broad waves. In contrast to the EEG definition of delta activity as less than 4 Hz, delta slow-wave activity is defined for sleep staging purposes as waves slower than
2 Hz (longer than 0.5-second duration) with a peak-to-peak
amplitude of greater than 75 mV. The amount of slow-wave
activity as measured in the central EEG derivations is used
to determine if stage N3 is present (1) (see below). Because
8/6/2009 4:01:10 PM
4
CHAPTER 1
a K complex resembles slow-wave activity, differentiating the
two is sometimes difficult. However, by definition, a K complex should stand out (be distinct) from the low-amplitude,
background EEG activity. Therefore, a continuous series of
high-voltage slow (HVS) waves would not be considered to be
a series of K complexes.
Sawtooth waves are notched-jagged waves of frequency in
the theta range (3 to 7 Hz) that may be present during REM
sleep. Although they are not part of the criteria for scoring REM
sleep, their presence is a clue that REM sleep is present.
EYE MOVEMENT RECORDING
The main purpose of recording eye movements is to identify
REM sleep. EOG (eye movement) electrodes typically are placed
at the outer corners of the eyes—at the right outer canthus (ROC)
and the left outer canthus (LOC). In a common approach, two
eye channels are recorded and the eye electrodes are referenced
to the opposite mastoid (ROC-A1 and LOC-A2). However,
some sleep centers use the same mastoid electrode as a reference
(ROC-A1 and LOC-A1). To detect vertical as well as horizontal
eye movements, one electrode is placed slightly above and one
slightly below the eyes (4,5).
Recording of eye movements is possible because a potential difference exists across the eyeball: front positive (+), back
negative (−). Eye movements are detected by EOG recording
of voltage changes. When the eyes move toward an electrode,
a positive voltage is recorded. By standard convention, polygraphs are calibrated so that a negative voltage causes an
upward pen deflection (negative polarity up). Thus, eye movement toward an electrode results in a downward deflection
(4,6). Note that movement of the eyes is usually conjugate, with
both eyes moving toward one eye electrode and away from the
other. If the eye channels are calibrated with the same polarity
settings, eye movements produce out-of-phase deflections in the
two eye tracings (e.g., one up and one down). Because ROC is
positioned above the eyes (and LOC below), upward eye movements are toward ROC and away from LOC. Thus, upward eye
movement results in a downward deflection in the ROC tracing
and an upward deflection in the LOC tracing.
Chap01.indd 4
There are two common patterns of eye movements. Slow eye
movements (SEMs), also called slow-rolling eye movements, are
pendular oscillating movements that are seen in drowsy (eyesclosed) wakefulness and stage N1 sleep. By stage N2 sleep, SEMs
usually have disappeared. REMs are sharper (more narrow deflections), which are typical of eyes-open wake and REM sleep.
In the two-tracing method of eye movement recording,
large-amplitude EEG activity or artifact reflected in the EOG
tracings usually causes in-phase defections.
ELECTROMYOGRAPHIC RECORDING
Usually, three EMG leads are placed in the mental and submental
areas. The voltage between two of these three is monitored (for
example, EMG1-EMG3). If either of these leads fail, the third
lead can be substituted. The gain of the chin EMG is adjusted so
that some activity is noted during wakefulness. The chin EMG
is an essential element only for identifying stage R sleep. In
stage R, the chin EMG is relatively reduced—the amplitude is
equal to or lower than the lowest EMG amplitude in NREM
sleep. If the chin EMG gain is adjusted high enough to show
some activity in NREM sleep, a drop in activity is often seen
on transition to REM sleep. The chin EMG may also reach the
REM level long before the onset of REMS or an EEG meeting
criteria for stage R. Depending on the gain, a reduction in the
chin EMG amplitude from wakefulness to sleep and often a further reduction on transition from stage N1 to N3 may be seen.
However, a reduction in the chin EMG is not required for stages
N2 to N3. The reduction in the EMG amplitude during REM
sleep is a reflection of the generalized skeletal-muscle hypotonia present in this sleep stage. Phasic brief EMG bursts still may
be seen during REM sleep. The combination of REMs, a relatively reduced chin EMG, and a low-voltage mixed-frequency
EEG is consistent with stage R.
SLEEP STAGE CHARACTERISTICS
The basic rules for sleep staging are summarized in Table 1-4.
Note that some characteristics are required (bold) and some
8/6/2009 4:01:10 PM
INTRODUCTION TO SLEEP AND POLYSOMNOGRAPHY
TABLE 1-4
5
Summary of Sleep Stage Characteristics
Characteristicsa,b
Stage
EEG
EOG
EMG
Wake (eyes open)
Low-voltage, high-frequency,
attenuated alpha activity
Eye blinks, REMs
Relatively high
Wake (eyes closed)
Low-voltage, high-frequency
>50% alpha activity
Slow-rolling eye movements
Relatively high
Stage N1
Low-amplitude mixedfrequency < 50% alpha
activity NO spindles,
K complexes
Slow-rolling eye movements
May be lower than wake
Sharp waves near transition
to stage N2
Stage N2
At least one sleep spindle
or K complex <20%
Slow-wave activityb
Stage N3 (present)
>20% slow-wave activity
C
Usually low
Stage N4 (prior)
>50% slow-wave activity
C
Usually low
Stage R
Low-voltage mixedfrequency
Episodic REMs
Relatively reduced (equal
or lower than the lowest in NREM)
May be lower than wake May be
lower than wake
Sawtooth waves—may
be present
a
Required characteristics in bold.
Slow wave activity, frequency <2 Hz; peak to peak amplitude >75 µV; >50% means slow wave activity present in more than 50% of the epoch;
REMs, rapid eye movements.
c
Slow waves usually seen in EOG tracings.
b
are helpful but not required. The typical patterns associated
with each sleep stage are discussed below.
the epoch). Both slow scanning and more rapid irregular eye
movements are usually present. The level of muscle tone is usually relatively high.
Stage Wake
During eyes-open wake, the EEG is characterized by highfrequency low-voltage activity. The EOG tracings typically show
REM, and the chin EMG activity is relatively high allowing differentiation from Stage R sleep. During eyes-closed drowsy wake,
the EEG is characterized by prominent alpha activity (>50% of
Chap01.indd 5
Stage N1
The stage N1 EEG is characterized by low-voltage, mixedfrequency activity (4 to 7 Hz). Stage N1 is scored when less
than 50% of an epoch contains alpha waves and criteria for
deeper stages of sleep are not met. Slow-rolling eye movements
8/6/2009 4:01:10 PM
6
CHAPTER 1
often are present in the eye movement tracings, and the level of
muscle tone (EMG) is equal or diminished compared to that in
the awake state. Some patients do not exhibit prominent alpha
activity, making detection of sleep onset difficult. The ability of a
patient to produce alpha waves can be determined from biocalibrations at the start of the study. The patient is asked to lie quietly with eyes open and then with the eyes closed. Alpha activity
usually appears with eye closure. When patients do not produce significant alpha activity, differentiating wakefulness from
stage N1 sleep can be difficult. Several points are helpful. First,
the presence of REMs in the absence of a reduced chin EMG
usually means the patient is still awake. However, SEMs can
be present during drowsy wake and stage N1 sleep. In this case
one must differentiate wake from stage N1 by the EEG. In wake,
the EEG has considerable high-frequency activity. In stage N1,
the EEG has mixed frequency with activity in the 4 to 7 Hz theta
range. Often the easiest method to determine sleep onset in difficult cases is to find the first epoch of unequivocal sleep (usually stage N2) and work backward. The examiner can usually be
confident of the point of sleep onset within one or two epochs.
Vertex waves are common in stage N1 sleep and are defined
by a sharp configuration maximal over the central derivations.
Vertex waves should be easily distinguished from the background activity.
Stage N2
Stage N2 sleep is characterized by the presence of one or more
K complexes or sleep spindles. To qualify as stage N2, an epoch
also must contain less than 20% of slow (delta) wave EEG activity
(<6 seconds of a 30-second epoch). Slow-wave activity is defined
as waves with a frequency less than 2 Hz and a minimum peak-topeak amplitude of greater than 75 mV. Stage N2 occupies the greatest proportion of the TST and accounts for roughly 40% to 50%
of sleep. Stage N2 sleep ends with a sleep stage transition (to stage
W, stage N3, stage R), an arousal, or a major body movement followed by SEMs and low-amplitude, mixed-frequency EEG.
Chap01.indd 6
amplitude > 75 mV peak-to-peak) is present for greater than 20%
of the epoch. Spindles may be present in the EEG. Frequently,
the high-voltage EEG activity is transmitted to the eye leads. The
EMG often is lower than during stages N1 and N2 sleep, but this
is variable. In older patients, the slow-wave amplitude is lower
and the total amount of slow-wave sleep is reduced. The amplitude of the slow waves (and amount of slow-wave sleep) is usually highest in the first sleep cycles. Typically, stage N3 occurs
mostly in the early portions of the night. Several parasomnias
(disorders associated with sleep) occur in stage N3 sleep and,
therefore, can be predicted to occur in the early part of the night.
These include somnambulism (sleep walking) and night terrors.
By contrast, parasomnias occurring in REM sleep (for example,
nightmares) are more common in the early morning hours.
Stage R
Stage R sleep is characterized by a low-voltage, mixed-frequency
EEG, the presence of episodic REMs, and a relatively low-amplitude chin EMG. Sawtooth waves also may occur in the EEG.
There usually are three to five episodes of REM sleep during
the night, which tend to increase in length as the night progresses. The number of eye movements per unit time (REM
density) also increases during the night. Not all epochs of REM
sleep contain REMs. Epochs of sleep otherwise meeting criteria
for stage R and contiguous with epochs of unequivocal stage
R (REMs present) are scored as stage R (see Advanced Staging
Rules). Bursts of alpha waves can occur during REM sleep, but
the frequency is often 1 to 2 Hz slower than during wake.
Stage R is associated with many unique, physiologic changes,
such as widespread skeletal muscle hypotonia and sleep-related
erections. Skeletal muscle hypotonia is a protective mechanism
to prevent the acting out of dreams. In a pathologic state known
as the REM behavior disorder, muscle tone is present, and body
movements and even violent behavior can occur during REM
sleep.
Stage N3 (formerly stage N3 and N4)
Arousals
Stages N3 NREM sleep is called slow-wave, delta, or deep sleep.
Stage N3 is scored when slow-wave activity (frequency < 2 Hz and
Arousal from sleep denotes a transition from a state of sleep to
wakefulness. Frequent arousals can cause daytime sleepiness by
8/6/2009 4:01:10 PM
INTRODUCTION TO SLEEP AND POLYSOMNOGRAPHY
shortening the total amount of sleep. However, even if arousals
are brief (1 to 5 seconds) with a rapid return to sleep, daytime
sleepiness may result, although the TST is relatively normal (7).
Thus, the restorative function of sleep depends on continuity as
well as duration. Many disorders that are associated with excessive daytime sleepiness also are associated with frequent, brief
arousals. For example, patients with OSA frequently have arousals
coincident with apnea/hypopnea termination. Therefore, determination of the frequency of arousals has become a standard
part of the analysis of sleep architecture during sleep testing.
Movement arousals were defined in the Rechtschaffen and
Kales (R&K) scoring manual (1) as an increase in EMG that is
accompanied by a change in pattern on any additional channel. For EEG channels, qualifying changes included a decrease
in amplitude, paroxysmal high-voltage activity, or an increase
in alpha activity. Subsequently, arousals were the object of
considerable research, but the criteria used to define them was
variable. A report from the Atlas Task Force of the American
Academy of Sleep Medicine (formerly the American Sleep Disorders Association or ASDA) has become the standard definition (8). According to the ASDA Task Force, an arousal should
be scored in NREM sleep when there is “an abrupt shift in EEG
frequency, which may include theta, alpha, and/or frequencies
greater than 16 Hz, but not spindles,” of 3 seconds or longer
duration. The 3-second duration was chosen for methodological reasons; shorter arousals may also have physiologic importance. To be scored as an arousal, the shift in EEG frequency
must follow at least ten continuous seconds of any stage of
sleep. Arousals in NREM sleep may occur without a concurrent increase in the submental EMG amplitude. In REM sleep,
however, the required EEG changes must be accompanied by
a concurrent increase in EMG amplitude for an arousal to be
scored. This extra requirement was added because spontaneous
bursts of alpha rhythm are a fairly common occurrence in REM
(but not NREM) sleep. Note that according to the above recommendations, increases in the chin EMG in the absence of EEG
changes are not considered evidence of arousal in either NREM
or REM sleep. Scoring of arousal during REM does, however,
require a concurrent increase in submental EMG lasting at least
1 second. Similarly, sudden bursts of delta (slow-wave) activity
in the absence of other changes do not qualify as evidence of
Chap01.indd 7
7
arousal. Because cortical EEG changes must be present to meet
the above definition, such events are also termed electrocortical
arousals. Note that the above guidelines represent a consensus
on events likely to be of physiologic significance. The committee recognized that other EEG phenomena, such as delta bursts,
also can represent evidence of arousal in certain contexts.
The frequency of arousals usually is computed as the arousal
index (number of arousals per hour of sleep). Relatively little
data is available to define a normal range for the arousal index.
Normal young adults studied after adaptation nights frequently
have an arousal index of 5 per hour or less. In one study, however, normal subjects of variable ages had a mean arousal index
of 21 per hour and the arousal index was found to increase with
age (9). However, a respiratory arousal index (RAI) (arousals associated with respiratory events) as low as 10 per hour
has been associated with daytime sleepiness in some individuals with the upper-airway resistance syndrome (UARS) (10).
While some have argued that patients with this disorder really
represent the mild end of the OSA syndrome, most would
agree with the concept that respiratory arousals of sufficient
frequency can cause daytime sleepiness in the absence of frank
apnea and arterial oxygen desaturation.
ADVANCED SLEEP STAGING RULES
Staging of REM sleep also requires special rules (REM rules) to
define the beginning and end of REM sleep. This is necessary
because REMs are episodic, and the three indicators of stage R
(EEG, EOG, and EMG) may not change to (or from) the REMlike pattern simultaneously. R&K recommend that any section
of the record that is contiguous with uneqivocal stage R and displays a relatively low-voltage, mixed-frequency EEG be scored
as stage R regardless of whether REMs are present, providing
the EMG is at the stage R level. To be REM-like, the EEG must
not contain spindles, K complexes, or slow waves.
Atypical Sleep Patterns
Four special cases in which sleep staging is made difficult by
atypical EEG, EOG, and EMG patterns will be briefly mentioned.
8/6/2009 4:01:10 PM
8
CHAPTER 1
In alpha sleep, prominent alpha activity persists into NREM
sleep. The presence of spindles, K complexes, and slow-wave
activity allows sleep staging despite prominent alpha activity. Causes of the pattern include pain, psychiatric disorders,
chronic pain syndromes, and any cause of nonrestorative
sleep (11, 12). Patients taking benzodiazepines may have very
prominent “pseudo-spindle” activity (14 to 16 Hz rather than
the usual 12 to 14 Hz) (13). SEMs are usually absent by the
time stable stage N2 sleep is present. However, patients on
some serotonin reuptake inhibitors (fluoxetine and others)
may have prominent slow and REMs during NREM sleep (14).
While a reduction in the chin EMG is required for staging REM
sleep, patients with the REM sleep behavior disorder may have
high chin activity during what otherwise appears to be REM
sleep (15).
Sleep Staging in Infants and Children
Newborn term infants do not have the well-developed adult
EEG patterns to allow staging according to R&K rules. The following is a brief description of terminology and sleep staging
for the newborn infant according to the state determination of
Anders, Emde, and Parmelee (16). Infant sleep is divided into
active sleep (corresponding to REM sleep), quiet sleep (corresponding to NREM sleep), and indeterminant sleep, which
is often a transitional sleep stage. Behavioral observations are
critical. Wakefulness is characterized by crying, quiet eyes open,
and feeding. Sleep is often defined as sustained eye closure.
Newborn infants typically have periods of sleep lasting 3 to
4 hours interrupted by feeding and total sleep in 24 hours is
usually 16 to 18 hours. They have cycles of sleep with a 45- to
60-minute periodicity with about 50% active sleep. In newborns, the presence of REM (active sleep) at sleep onset is the
norm. By contrast, the adult sleep cycle is 90 to 100 minutes,
REM occupies about 20% of sleep, and NREM sleep is noted at
sleep onset.
The EEG patterns of newborn infants have been characterized as low-voltage irregular (LVI), tracé alternant (TA), HVS,
and mixed (M) (Table 1-5). Eye movement monitoring is used
as in adults. An epoch is considered to have high or low EMG if
over one half of the epoch shows the pattern. The characteristics
Chap01.indd 8
of active sleep, quiet sleep, and indeterminant sleep are listed
in Table 1-6. The change from active to quiet sleep is more
likely to manifest indeterminant sleep. Nonnutritive sucking
commonly continues into sleep.
As children mature, more typically adult EEG patterns begin
to appear. Sleep spindles begin to appear at 2 months and are
usually seen after 3 to 4 months of age (17). K complexes usually begin to appear at 6 months of age and are fully developed
by 2 years of age (18). The point at which sleep staging follows adult rules is not well defined, but usually is possible after
age 6 months. After about 3 months, the percentage of REM
sleep starts to diminish and the intensity of body movements
during active (REM) sleep begins to decrease. The pattern of
NREM at sleep onset begins to emerge. However, the sleep cycle
period does not reach the adult value of 90 to 100 minutes
until adolescence.
Note that the sleep of premature infants is somewhat different from term infants (36 to 40 weeks gestation). In premature
infants, quiet sleep usually shows a pattern of tracé discontinu
(19). This differs from TA as there is electrical quiescence (rather
than a reduction in amplitude) between bursts of high-voltage
activity. In addition, delta brushes (fast waves of 10 to 20 Hz) are
superimposed on the delta waves. As the infant matures, delta
brushes disappear and TA pattern replaces tracé discontinue.
RESPIRATORY MONITORING
The three major components of respiratory monitoring during
sleep are airflow, respiratory effort, and arterial oxygen saturation (20, 21). Many sleep centers also find using a snore sensor to be useful. For selected cases, exhaled or transcutaneous
PCO2 may also be monitored.
Traditionally, airflow at the nose and mouth was monitored
by thermistors or thermocouples. These devices actually detect
airflow by the change in the device temperature induced by a
flow of air over the sensor. It is common to use a sensor in
or near the nasal inlet and over the mouth (nasal-oral sensor)
to detect both nasal and mouth breathing. While temperature
sensing devices may accurately detect an absence of airflow
(apnea), their signal is not proportional to flow and they have
8/6/2009 4:01:10 PM
INTRODUCTION TO SLEEP AND POLYSOMNOGRAPHY
TABLE 1-5
9
EEG Patterns Used in Infant Sleep Staging
EEG Pattern
Low-voltage (14–35 μV)a, little variation theta (5–8 Hz) predominates
Low-voltage irregular (LVI)
Slow activity (1–5 Hz) also present
Tracé alternant (TA)
Bursts of high-voltage slow waves (0.5–3 Hz) with superimposition of rapid low-voltage
sharp waves 2–4 Hz
In between the high-voltage bursts (alternating with them) is low-voltage mixedfrequency activity of 4 – 8 seconds in duration
High-voltage slow (HVS)
Continuous moderately rhythmic medium- to high-voltage (50–150 μV) slow waves
(0.5–4 Hz)
Mixed (M)
High-voltage slow- and low-voltage polyrhythmic activity
Voltage lower than in HVS
μV, microvolts.
a
TABLE 1-6
Behavioral
Characteristics of Active and Quiet Sleep
Active Sleep
Quiet Sleep
Indeterminant
Eyes closed
Eyes closed
Facial movements: smiles,
grimaces, frowns
No body movements except
startles and phasic jerks
Not meeting criteria for active
or quiet sleep
Burst of sucking
Sucking may occur
Body—small digit or limb
movements
EEG
LVI, M, HVS (rarely)
HVS, TA, M
EOG
REMs
No REMs
A few SEMs and a few dysconjugate
movements may occur
EMG
Low
High
Respiration
Irregular
Regular
Postsigh pauses may occur
Chap01.indd 9
8/6/2009 4:01:10 PM