Characteristics of non variceal upper gastrointestinal bleeding and factors related to recurrence at Hanoi medical university hospital, Vietnam
Bạn đang xem bản rút gọn của tài liệu. Xem và tải ngay bản đầy đủ của tài liệu tại đây (347.01 KB, 9 trang )
JOURNAL OF MEDICAL RESEARCH
CHARACTERISTICS OF NON-VARICEAL UPPER GASTROINTESTINAL BLEEDING AND FACTORS RELATED TO RECURRENCE
AT HANOI MEDICAL UNIVERSITY HOSPITAL, VIETNAM
Nguyen Phuc Binh1, Dao Viet Hang1,2, Tran Quoc Tien2, Dao Van Long1,2
1
Hanoi Medical University Hospital; 2Hanoi Medical University Hospital
Upper gastrointestinal bleeding is an emergency requiring immediate management and cooperation of
many specialties. Among the causes of upper gastrointestinal bleeding, non-variceal upper gastrointestinal
bleeding has the highest percentage. Initial assessment, prognosis factor classification and suitable interventions will help to reduce recurrent bleeding rate. The study aims to evaluate the characteristics of
non-variceal upper gastrointestinal bleeding and identify correlating factors of recurrent bleeding. A retrospective descriptive study was conducted on non-variceal upper gastrointestinal bleeding patients admitted
to Hanoi Medical University Hospital with ICD 10 code K92.2 from January 2013 to March 2017. There were
444 patients with the mean age of 49.1 (18.1). There were 69.8% of patients with co-morbidities in which
25.9% had history of upper gastrointestinal bleeding. The median Rockall score was 3 and the median Glasgow-Blatchford Bleeding Score (GBS) was 7. The rate of endoscopic interventions was 48.4% in which
99.1% achieved success. The rate of recurrent bleeding in hospital was 4.5% and within 30 days after discharge was 1.1%. There was no difference of recurrence in the groups performed mono and combined
therapies. Glasgow-Blatchford Score and Rockall score had low prognosis performance for in-hospital recurrence. In conclusion, the rate of recurrence both in hospital and within 30 days in non-variceal upper gastrointestinal bleeding patients was low.
Keywords: non-variceal upper gastrointestinal bleeding; epidemiology; recurrent bleeding; related
factors
I. BACKGROUND
causes could be various including peptic ulcer,
Mallory Weiss, malignancy, vascular malfor-
Upper gastrointestinal bleeding is one of
mation and unidentified injuries [1]. Patients
the most common gastrointestinal emergen-
with upper gastrointestinal bleeding may de-
cies which requires urgent assessment and
velop recurrent bleeding in hospital (7 - 16%)
interventions with mortality rate of 2 - 15% [1].
or after discharge (8%) [5; 6]. To classify
The incidence of upper gastrointestinal bleed-
patients based on severity when admission
ing ranges from 48 to 172/100.000 adults per
and detect factors that are related to bleeding
year in which men and old people have a
recurrence is important to follow up and make
higher rate [2 - 4]. Among the etiologies of
prognosis [7]. In Vietnam, there have not been
upper gastrointestinal bleeding, as many pre-
many epidemiology studies in non-variceal
vious studies recorded, non-variceal bleedings
upper
accounted for the highest percentage. The
centered research at 17 major hospitals in
gastrointestinal
bleeding.
A
multi-
Vietnam in 2015 recorded the rate of inCorresponding author: Dao Viet Hang, Hanoi Medical
Univesity
Email:
Received: 11/1/2018
Accepted: 08/11/2018
JMR 116 E3 (7) - 2018
hospital recurrent bleeding in patients with
upper gastrointestinal bleeding was 5.7% [8].
Therefore, we decided to conduct our study at
Hanoi Medical University Hospital to report
19
JOURNAL OF MEDICAL RESEARCH
characteristics, recurrence rate and factors
Recurrent bleeding was diagnosed with
associated to recurrence in non-variceal upper
symptoms of repeated hematemesis or black
gastrointestinal bleeding patients.
II. METHODS
stools, a drop of Hemoglobin ≥ 2g/dl or
changes of hemodynamic status after controlling bleeding or having yellow stool. Cases of
The study used a retrospective method
in-hospital recurrent bleeding were taken from
with convenient sample size, which was con-
medical records, cases of recurrent bleeding
ducted at Hanoi Medical University Hospital.
within 30 days after discharge were collected
Medical records of patients who were admitted
from contacting patients or patient’s family
to HMUH from January 2013 to March 2017
members by phone numbers.
with diagnosis of upper gastrointestinal bleed-
We analyzed and demonstrated data by
ing according to the criteria of ICD code being
using R program. Statistical analysis included t
K92.2 were collected. Patients with melena
-test, Mann – Whitney test for categorical vari-
and/or hematemesis and endoscopy showing
ables and Chi-square test, Fisher test for
bleeding lesions in the upper GI tract except
quantitative variables. Logistic regression was
variceal bleeding were included in the study.
We excluded patients who were admitted to
HMUH and diagnosed with upper gastrointestinal bleeding but discharged immediately
without upper endoscopy, further intervention
and treatment, patients who did not provide
correct addresses and contacts or patients
used for evaluating the association of recurrent bleeding and related factors. Recurrent
bleeding’s predictive value of different scores
was demonstrated by the area under the curve
(AUC). A P-value of less than 0.05 was considered significant.
III. RESULTS
refused to attend in the study.
Patients characteristics included demographic information (age, gender), previous
upper GI bleeding, comorbid diseases, arrival
time, clinical symptoms, hemodynamic status
on admission and after upper endoscopy, indication of blood transfusion, gastroscopic diagnosis, gastroscopic interventions and other
1. Demographic characteristics
Our study recorded 444 cases of nonvariceal
upper
gastrointestinal
bleeding,
among those 67.3% was male. The average
age (SD) was 49.1 (18. 08), with the eldest
patient being 91 years old and the youngest
being 10.
treatments during hospital stay. Blood transfu-
2. History
sion was selected instead of haemoglobin
Based on medical records, 69.8% of cases
level since all patients with significantly low
had at least one comorbid disease which con-
heamoglobin would receive blood transfusion.
sisted of cardiovascular diseases, diabetes,
Patients’ risks were evaluated by the Glasgow
musculoskeletal diseases and liver diseases.
-Blatchford Bleeding Score to assess the need
25.9% had a past history of upper gastrointes-
for intervention and the Rockall score (Pre-
tinal bleeding. 9.23% used non-steroidal anti-
endoscopic and complete) to predict the risk of
inflammatory drugs (NSAID) and/or coagula-
recurrent bleeding and mortality.
tion before admission.
20
JMR 116 E3 (7) - 2018
JOURNAL OF MEDICAL RESEARCH
Glasgow-Blatchford Score and Rockall
Symptoms, Glasgow-Blatchford Score
and Rockall score
score: To stratify risk, the Glasgow-Blatchford
Symptoms: Black stool was the most com-
Score and the Rockall score (both pre-endos
mon symptom (83.8%). Other symptoms
copy and complete) were used. As a result, a
recorded were hematemesis (32.43%), ab-
median score of Glasgow-Blatchford Score
dominal pain (44.14%) and fatigue (6.08%).
was 7 (4 - 10) and 63.0% of cases had Glas-
Vital signs on admission: The mean heart
rate was 91.9 (18.1) beats/min. There was
25.7% of patients had tachycardia (heartbeat
> 100 beats/min). 8.6% of the patients had low
blood pressure (defined as systolic pressure
lower than 90 mmHg or diastolic pressure
gow-Blatchford Score ≥ 6. About the Rockall
score, a median Rockall score was 3 (1 - 5)
with 71.2% in the high-risk group (Rockall
score > 3). Pre-endoscopy Rockall score reported low percentage (57.4%) in the high-risk
group and the median score was 1 (0- 2).
lower than 60 mmHg).
Table 1. Risk Score of upper gastrointestinal bleeding
Rockall score (Complete) (Median (Interquantile))
3 (2 - 5)
< 3 points (low risk group)
26,1%
3 - 8 points (moderate risk group)
73,3%
> 8 points (high risk group)
0,6%
Glasgow-Blatchford Score (Median (Interquantile))
7 (4 - 10)
Glasgow-Blatchford Score < 6
37,0%
Glasgow-Blatchford Score ≥ 6 (50% of patients need intervention)
63,0%
Upper endoscopy findings and interventions
Time of endoscopy: 93,5% of cases received endoscopy within 24 hours of admission in which
34.7% had endoscopy before admission (outpatient indication before admission). The durationfrom hospital admission to upper endoscopy had a median value of 4 (2.5 - 11) hours.
Bleeding etiologies: Table 2 presents the causes of non-variceal upper gastrointestinal bleeding, which duodenal bulb ulcer and gastric ulcer were predominant causes (63.5% and 23.2%),
respectively. In total, 33.78% of patients had active bleeding at the site of lesions. Among 387
patients with bleeding ulcers, 61.5% was in high-risk stigmata group (rebleeding rate from 2255%) (Table 3).
JMR 116 E3 (7) - 2018
21
JOURNAL OF MEDICAL RESEARCH
Table 2. Causes of non-variceal upper gastrointestinal bleeding
Esophagus
Esophageal ulcer
8/444 (1.8%)
Mallory Weiss
25/444 (5.6%)
Gastric ulcer
Stomach
103/444 (23.2%)
Dieulafoy lesion
8/444 (1.8%)
Malignancy
16/444 (3.6%)
Duodenal bulb ulcer
Duodenum
282/444 (63.7%)
Anastomosis ulcer
15/444 (3.4%)
Unidentified injury
26/444 (5.9%)
Table 3. Characteristics of peptic ulcers
Forrest Classification
Patients with ulcers (n = 387)
High-risk stigmata group
Forrest IA (Spurting bleeding)
9/387 (2.3%)
Forrest IB (Oozing bleeding)
109/387 (28.2%)
Forrest IIA (Non-bleeding visible vessel)
Forrest IIB (Adherent clot)
62/387 (16%)
59/387 (15.2%)
Low-risk stigmata group
Forrest IIC (Flat spot)
Forrest III (Clean base)
20/387 (5.2%)
128/387 (33.1%)
Endoscopy interventions: Almost half of the cases of non-variceal upper gastrointestinal bleeding required endoscopic intervention (48.4%) with the successful rate of 99.1%. 2 patients failed
interventions due to restlessness. Nearly 70% of the intervened patients required only mono therapy - epinephrine injection (69.77%). The second most common method was the combination of
epinephrine injection and endoscopic clips. Other mono the rapies such as endoscopic clips, APC
or combination methods only accounted for a small percentage with less than 10%. After intervention, there was a significant decrease of heartbeats before endoscopy and after endoscopy
(p < 0.001). In the group with hypotension before endoscopy interventions, there was a significant
increase in the mean of heart pressure (p < 0.001)
22
JMR 116 E3 (7) - 2018
JOURNAL OF MEDICAL RESEARCH
Table 4. Changes of vital signs after endoscopic intervention
Pre-endoscopy
Post-endoscopy
p
Heart rate (beats/min)
94.0 (19.2)
88.2 (11.7)
< 0.001*
MAP in pre-endoscopy hypotension group
(mmHg)
62.4 (9.0)
81.2 (10.3)
< 0.001*
MAP: Mean arterial pressure; *: Statistically significant
Recurrent bleeding rate and related factors
There were 20 cases (4.5%) who had recurrent bleeding during hospital stay. There was no
difference in recurrent bleeding rate between intervention group and non-intervention group
(p = 0.755). In the intervention group, the difference of in-hospital bleeding rates between mono
therapy and combined therapies groups was not statistically significant (p = 0.088). Among 272
contacted patients by phone number, there were only 3 patients (1.1%) who had recurrent bleeding within 30 days after discharge.
Table 5. In-hospital recurrent bleeding and related factors
Recurrent
Univariate logistic
Multivariate logistic
bleeding
regression
regression
Factors
Yes
(20)
No
(424)
OR (95% CI)
p
Age
≤ 60
16
302
0.62 (0.20, 1.89)
0.395
> 60
4
122
Gender
Female
2
143
4.58 (1.05, 20.01)
0.027*
Male
18
281
2.53 (0.73, 8.79)
0.13
1.58 (0.61, 4.05)
0.342
OR (95% CI)
P
5.60 (1.27, 24.76)
0.023*
Demographic
Patient’s medical history
Comorbid diseases
No
3
131
Yes
17
293
13
7
316
108
Past
UGIB
history
of
No
Yes
JMR 116 E3 (7) - 2018
23
JOURNAL OF MEDICAL RESEARCH
Recurrent
bleeding
Univariate logistic
regression
Multivariate logistic
regression
Factors
Yes
(20)
No
(424)
OR (95% CI)
p
0.95 (0.34, 2.68)
0.925
2.87 (0.91, 9.06)
0.061
OR (95% CI)
P
4.83 (1.80, 12.94)
0.002*
Hemodynamic status
Tachycardia
Heartbeat < 100
15
314
Heartbeat > 100
5
110
Low blood pressure
No
16
390
Yes
4
34
No intervention
10
219
Singular
intervention
6
210
0.63 (0.22, 1.75)
0.368
Combined
intervention
4
35
2.50 (0.74, 8.42)
0.127
Endoscopy
Intervention
Red blood cell transfusion in hospital
No
Yes
6
14
272
152
5
15
GBS
≤6
>6
4.18 (1.57, 11.09)
0.002*
120
295
1.22 (0.43, 3.43)
0.705
6
158
1.46 (0.55, 3.87)
0.448
14
253
Risk score
Rockall score
(complete)
<3
≥3
* GBS: Glasgow-Blatchford Bleeding Score; OR: Odds ratio; CI: Confidence interval;
*: Statistically significant
By using univariate logistic regression, only gender and red blood cell transfusion had an association with recurrent bleeding. Specifically, the odd of having recurrent bleeding in male was 4.58
times higher than female (95% CI: 1.05 - 20.01; p = 0.027) and patients who were required red
blood cell transfusion also had a higher odd of recurrent bleeding (OR = 4.18 (1.57, 11.09)). A
24
JMR 116 E3 (7) - 2018
JOURNAL OF MEDICAL RESEARCH
similar result was shown in multivariate regression when gender and blood transfusion remain
associated with recurrent bleeding.
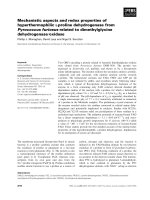
ROC curves analysis showed the prognosis ofthe Glasgow-Blatchford Score, the Preendoscopic and Complete Rockall score. All three scores demonstrated limitations in predicting in
-hospital bleeding (Figure 1).
Figure 1. ROC curves of Glasgow-Blatchford Score, Pre-endoscopic and Complete Rockall
score in predicting in-hospital recurrent bleeding
IV. DISCUSSION
According to our findings, the proportion of
in-hospital recurrent bleeding was 4.5% and
In our study, we reported the high rate of
the proportion of recurrent bleeding within 30
endoscopy performance within 24 hours after
days was only 1.1%. These results were lower
admission (93.47%) with a median time of 4
than other researches in Asia and South-East
hours. This rate was higher compared to the
Asia countries such as Iran (16.7%), Hong
multi-centered research at 17 major hospital in
Kong (8.8%), Thailand (7.8%) and similar to
2017 by Long et al which reported only 71.8%
another research in Vietnam (5.7%) [7 - 10].
with a longer median time (14.5 hours) [8]. It
This could be explained by difference of geo-
demonstrated the quick approach protocol in
graphic studies. Moreover, in our study, the
upper gastrointestinal bleeding in HMU hospi-
percentage of patients requiring interventions,
tal and showed the efficacy of on-call bleeding
especially combined endoscopic intervention
control team.
was lower than other foreign studies.
JMR 116 E3 (7) - 2018
25
JOURNAL OF MEDICAL RESEARCH
After endoscopic interventions, significant
99.1%. Significant changes in vital signs and
changes of patient’s vital signs were recorded,
blood pressure after endoscopic intervention-
especially in patients with admission hypoten-
were observed.
sion, which could be evaluated as the efficacy
parameter of endoscopic interventions.
The proportions of in-hospital recurrent
bleeding and recurrent bleeding within 30 days
When evaluating factors possibly relating
after discharge in non-variceal upper gastroin-
to recurrent bleeding, only gender and blood
testinal bleeding patients were low (4.5% and
transfusion were associated with recurrent
1.1%). Gender and blood transfusion indica-
bleeding. There was no association between
tion were factors associated with in-hospital
recurrent bleeding and age groups, patient’s
recurrent bleeding. Using risk scores such as
history, hemodynamic status, types of inter-
the Glasgow-Blatchford Score and the Rockall
vention and risk scores. It could be explained
score showed limit prediction about in-hospital
that the number of patients with recurrent
recurrent bleeding.
bleeding was small in our study. The utility of
REFERENCES
risk score such as the Glasgow-Blatchford
Score and the Rockall score (pre-endoscopic
1. Gralnek I., Dumonceau J-M., Kuipers
and complete) was mentioned in many re-
E et al (2015). Diagnosis and management of
search and was recommended in the guideline
nonvariceal
of European Society for Gastrointestinal Endo-
rhage: European Society of Gastrointestinal
scopy (ESGE) [1; 11; 12]. However, in our
Endoscopy (ESGE) Guideline. Endoscopy, 47
study, both scores showed poor predictive
(10), a1 - 46.
value on ROC curves. The reason might be
due to the small number of recurrences in our
study.
However, it should be noted that our study
had some limitations. Because our study
method was retrospective cohort research,
data were mostly collected from medical records, there fore, some data were not sufficient to be analyzed and sample selection
could not be randomized. Contacting patients
to identify their history of recurrent bleeding
could be affected by recall bias.
upper
gastrointestinal
hemor-
2. Barkun AN., Bardou M., Kuipers EJ et
al (2010). International consensus recommendations on the management of patients with
nonvariceal upper gastrointestinal bleeding.
Ann Intern Med, 152(2), 101 - 113.
3. Hreinsson JP., Kalaitzakis E., Gudmundsson S et al (2013). Upper gastrointestinal bleeding: incidence, etiology and outcomes in a population-based setting. Scand J
Gastroenterol, 48(4), 439 - 447.
4. Rotondano G (2014). Epidemiology and
Diagnosis of Acute Nonvariceal Upper Gastro-
V. CONCLUSION
Almost all (95.3%) patients received endo-
intestinal Bleeding. Gastroenterol Clin North
Am, 43(4), 643 - 63.
scopy within 24 hours. 48.4% of endoscopy
5. Van Leerdam ME (2008). Epidemiology
patients were performed at least one endo-
of acute upper gastrointestinal bleeding. Best
scopic intervention and success rate was
Pract Res Clin Gastroenterol, 22(2), 209 - 224.
26
JMR 116 E3 (7) - 2018
JOURNAL OF MEDICAL RESEARCH
6. Sengupta N., Tapper EB., Patwardhan
Bleeding Peptic Ulcers After Therapeutic En-
VR et al (2016). High Glasgow Blatchford
doscopy. Clin Gastroenterol Hepatol, 7(3), 311
Score at admission is associated with recur-
- 316.
rent bleeding after discharge for patients hos-
10. Bunchorntavakul C., Yodket Y.,
pitalized with upper gastrointestinal bleeding.
Singhasena N (2017). Clinical Characteris-
Endoscopy, 48(1), 9 - 15.
tics, Treatment Outcomes and Risk Assess-
7. Minakari M., Badihian S., Jalalpour P
ment of Patients with Acute Upper Gastroin-
et al (2017). Etiology and outcome in patients
testinal Bleeding in Rajavithi Hospital, Thai-
with upper gastrointestinal bleeding: Study on
land. J Med Assoc Thai, 100(2), 104.
4747 patients in the central region of Iran:
11. Monteiro S (2016). Upper gastrointes-
Upper gastrointestinal bleeding in Iran. J Gas-
tinal bleeding risk scores: Who, when and
troenterol Hepatol, 32(4), 789 - 796.
why? World J Gastrointest Pathophysiol, 7(1),
8. Long Dao Van (2015). A study on nonvariceal upper gastrointestinal bleeding in 17
big hospitals of Vietnam. Vietnam Medical
Journal, 426(1), 109.
9. Chiu PWY, Ng EKW, Cheung FKY et al
86.
12. Bozkurt MA., Peker KD., Unsal MG et
al (2017). The Importance of Rockall Scoring
System for Upper Gastrointestinal Bleeding in
Long-Term Follow-Up. Indian J Surg, 79(3),
188 - 191.
(2009). Predicting Mortality in Patients With
JMR 116 E3 (7) - 2018
27