Ebook Atlas of fetal MRI: Part 2
Bạn đang xem bản rút gọn của tài liệu. Xem và tải ngay bản đầy đủ của tài liệu tại đây (12.36 MB, 150 trang )
5
MR Imaging of Fetal Thoracic Abnormalities
DEBORAH LEVINE
INTRODUCTION
throughout the third trimester when the lungs display
higher signal intensity and larger size than in the early
second trimester (9). The aorta, superior vena cava,
inferior vena cava, and ductal arch all can be viewed
when the image is in the appropriate plane (Figs. 5.4 –
5.6) (44). The individual chambers of the heart are rarely
visualized secondary to constant cardiac motion, but at
times, the image is obtained either at just the right time
for a single-shot image or at the correct phase of the
cardiac cycle such that cardiac gating has occurred for
images obtained during a breathhold (Fig. 5.7).
A number of publications have described the benefit of
magnetic resonance (MR) imaging in the evaluation of
fetuses with thoracic abnormalities (1 –10). In a study by
Levine et al. (9), of 74 fetuses with thoracic abnormalities,
MR imaging provided additional information over sonography in 28 (37.8%) patients. However, MR information
regarding the thorax impacted care in only 6/74 (8.1%)
fetuses. Prenatal thoracic MR is most likely to impact
care in the fetal surgery patient and in the cases where
the diagnosis is unclear by sonography.
The Airway and Esophagus
NORMAL ANATOMY
The trachea, carina, and mainstem bronchi can be seen in
many examinations of the chest (Fig. 5.8). Small portions
of the esophagus are commonly visualized (9). The esophagus appears as a tubular structure in the posterior mediastinum. It is best visualized when the image acquisition
coincides with the fetus swallowing a bolus of amniotic
fluid or reflux occurs. The esophagus is then visualized
as it is distended and filled with amniotic fluid (Fig. 5.9).
Lung Signal Intensity
T2 lung signal intensity in normal lungs is higher in older
gestational age fetuses compared with younger gestational
age fetuses (Figs. 5.1 –5.3) (9,11). T1 signal intensity
similarly decreases with increasing gestational age (12).
Normal lung volumes have been documented by MRI
studies (11). There is growth of the lungs with increasing
gestational age. This growth is proportionate to fetal
body size.
The Diaphragm
Thoracic Vascularity
The diaphragm is visible as a thin dome-shaped band
separating the abdomen from the thorax. It has low
signal intensity on T2-weighted images and is of a signal
intensity slightly lower than that of the liver (14). It is
most clearly seen on the coronal and sagittal images
The main pulmonary arteries with first-order branches can
be seen as flow voids in the central lungs (Fig. 5.2) (9).
These are best visualized in the late second trimester and
91
92
Atlas of Fetal MRI
Figure 5.1 Normal lungs in early- to midsecond trimester. Axial and coronal T2-weighted
images at 14 (a and b) and 18 (c and d)
weeks gestational age show the lungs (L) and
the heart (H). The pulmonary vasculature is
difficult to assess at these early gestational ages.
s, stomach.
Figure 5.2 Normal lungs late second to third trimesters. Axial and sagittal T2-weighted images at 24 (a and b), 28 (c and d), and
32 (e and f) weeks gestational age. The lung signal intensity is now increased in comparison with the lungs in Fig. 5.1, and the pulmonary
vessels appear as prominent flow voids branching (arrows) from the hila. Note the descending aorta (arrowhead) anterior to the spine.
H, heart.
Fetal Thorax
93
Scaled signal intensity
5
4
3
2
1
15
20
25
30
Gestational Age (weeks)
35
40
Figure 5.3 Chart of lung signal intensity compared to gestational age in
normal lungs. Lung signal intensity on
T2-weighted images was graded on a
five-point scale as follows: 1, as bright as
fluid (using either amniotic fluid or cerebrospinal fluid at a similar distance from
the coil as comparison); 2, slightly less
than fluid; 3, intermediate between fluid
and muscle; 4, slightly greater than
muscle; or 5, similar to muscle. [From
Levine et al. (9)]
Figure 5.4 Great vessels in axial plane in fetus at 23 weeks
gestational age. Axial T2-weighted image shows the pulmonary
outflow tract (arrowhead), aortic outflow tract (* ), and superior
vena cava (arrow).
(Fig. 5.10). At least portions of the diaphragm can be
observed on most studies (15).
The Thymus
The thymus is best visualized in the third trimester when it
appears as an intermediate to low signal intensity structure
in the anterior mediastinum (Fig. 5.11). The normal size of
the thymus in the fetus has not yet been established.
Figure 5.5 Ductal arch and aortic arch. Oblique sagittal
T2-weighted images in two different fetuses show the ductal
arch (arrow in a) arising from the anteriorly located pulmonary
outflow tract and aortic arch (arrows in b) arising from the more
medially located aortic outflow tract. The ductal and aortic arch
supply the descending aorta, located anterior to the spine.
94
Atlas of Fetal MRI
Figure 5.6 Normal vascularity. Oblique coronal spectral
spatial water excitation sequence shows flowing blood as high
signal intensity. The inferior vena cava (arrowhead), aorta (thin
arrows), and superior vena cava (large arrow) are all wellvisualized. [From Levine et al. (13)]
Figure 5.7 Normal heart. Axial T2-weighted image at 19
weeks gestational age (a) and T1-weighted image at 26 weeks
gestational age (b) illustrate the heart and the interventricular
septum (arrowhead). Normally images are not cardiac gated,
and thus the chambers of the heart are not well-visualized. At
times, imaging serendipitously shows the cardiac chambers.
Figure 5.8 Normal airway. (a and b) Oblique coronal
T2-weighted images at 23 weeks gestational age show the right
and left mainstem bronchi (arrows). (c) Sagittal T2-weighted
image in a different fetus at 34 weeks gestational age shows
the trachea. (d) Coronal T2-weighted image in a fetus with a
CCAM (arrowhead) shows the carina and mainstem bronchi
(arrows).
Fetal Thorax
95
Figure 5.9 Normal distal esophagus. Axial
(a) and coronal (b) T2-weighted images in two
different fetuses with fluid in the distal esophagus. Fluid can be detected in the esophagus
(arrow) resulting from either swallowing or
refluxing.
Figure 5.10 Normal diaphragm. Sagittal (a)
and coronal (b) T2-weighted images at 31– 32
weeks gestational age show the diaphragm
(arrows) as a low intensity dome-shaped structure separating the thorax from the abdomen.
L, liver; K, kidney.
Figure 5.11 Normal thymus. Axial T2weighted images of the thymus (arrows) in
different fetuses at 33 (a and b), 34 (c), and
37 (d) weeks gestational age.
96
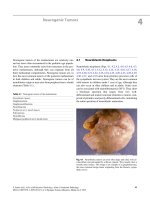
THORACIC ABNORMALITIES
Lung Masses
On sonography, the classic differential diagnosis for an
echogenic lung mass is congenital cystic adenomatoid
malformation (CCAM), sequestration, or congenital diaphragmatic hernia (CDH). Each of these may cause mediastinal shift. When the stomach is in the chest, the obvious
diagnosis is CDH. When the lesion has macrocysts, it is
assumed to be a CCAM. When systemic blood supply is
visualized, it is assumed to be a sequestration. Fetal MR
imaging can be helpful when the diagnosis is unclear,
but in most cases, it is only the potential fetal surgery
patients who will need an MR to assess prognostic
factors in association with CDH such as presence of
liver in the chest and measured lung volume.
The CCAM to Sequestration Spectrum
Congenital cystic adenomatoid malformations are classically described as pulmonary lesions with abnormal
Atlas of Fetal MRI
proliferation of bronchiolar structures that connect to the
normal bronchial tree. The vascular supply of a classic
CCAM is from the pulmonary artery with drainage into
the pulmonary veins. Sequestrations are pulmonary
tissues with vascular supply from the systemic circulation,
and lack of connection to the bronchopulmonary tree.
However, there is a wide spectrum of these anomalies
with much overlap (16,17). Both CCAMs and sequestrations appear as echogenic lung lesions on ultrasound. On
MR imaging, they typically have higher signal intensity
than normal adjacent lung tissue on T2-weighted imaging,
(3 – 5, 14) and lower signal intensity than normal lung on
T1-weighted imaging. If large, they can cause mediastinal
shift. Congenital cystic adenomatoid malformations may
have macrocysts that will be discretely visible (Figs.
5.12 and 5.13), although these tend to be better visualized
sonographically (Fig. 5.14).
When adjacent normal lung is compressed by a pulmonary mass, such as a CCAM or sequestration, it can
be visualized on MR as of slightly lower signal intensity
than adjacent normal lung (Fig. 5.15) (15).
Figure 5.12 Cystic appearing CCAM at 24
weeks gestational age. Oblique axial (a) and
sagittal (b) T2-weighted images show a high
signal intensity cystic appearing mass
(arrows) in the left lower lobe consistent
with a CCAM.
Figure
5.13 Lobular
appearing
CCAM at 20 weeks gestational age.
Axial (a) and sagittal (b) T2-weighted
images show a high signal intensity
lobular mass (arrows) in the left lung,
with mediastinal shift to the right. Note
the relatively low signal intensity of the
adjacent and contralateral lung. The
lesion is not large enough to be causing
atelectasis of the contralateral lung. The
relatively low signal intensity is due to
early gestational age. H, heart.
Fetal Thorax
97
Figure 5.14 Congenital cystic
adenomatoid malformation at 19
weeks gestational age, comparison of ultrasound and MR
imaging. (a) Sagittal sonogram
reveals a cystic lung mass
(arrows) with eversion of the
hemidiaphragm
(arrowheads).
Axial (b) and sagittal (c) T2weighted images show a high
signal intensity mass (arrows).
Individual cysts are not as well
appreciated as they are on the
sonogram. (d) Axial T1-weighted
image shows the lesion to be of
relatively low signal intensity. H,
heart.
Figure 5.15 Two CCAMs compressing normal intervening lung
in fetus at 24 weeks gestational
age. Coronal (a) and sagittal
(b) T2-weighted images show a high
signal intensity upper lobe mass
(white arrow) and slightly high
signal intensity lower lobe mass
(black arrows). Note the relatively
low signal intensity of the atelectatic
lung between the two lesions (arrowheads) and the intermediate signal
intensity of the normal lung (L)
on the right side of the chest. [From
Levine et al. (46)]
98
Atlas of Fetal MRI
Figure 5.16 Changing appearance of CCAM. Axial (a) and
sagittal (b) T2-weighted images
at 21 weeks show a high signal
intensity left-sided lung lesion
(arrows), with moderate mediastinal shift to the right. Axial (c)
and sagittal (d) T2-weighted
images at 37 weeks show a small
residual mass (arrowheads). The
mediastinal shift has resolved. At
this time, the mass was no longer
visible sonographically.
Figure 5.17 Sequestration at 27 weeks gestational age. Axial (a) and coronal (b and c) T2-weighted images show a mass (arrows)
filling the left hemithorax, with mediastinal shift to the right. The tissue in the left hemithorax is of slightly higher signal intensity
than the normal lung on the right. Systemic vascular supply was not visible on ultrasound or MR images, however, this was found to
be a sequestration at the time of postnatal surgery. H, heart.
Fetal Thorax
99
The normal and abnormal vasculature supplying
CCAMs and sequestrations can be visualized on MR
images. If a vessel arises from the aorta, the lesion is presumed to be a sequestration. The branching pattern of the
vessels supplying a CCAM can either have a normal
branching pattern or appear stretched (9). As these
lesions regress their signal intensity decreases (9).
A pleural effusion may be visualized transiently as the
lesion decreases in size. The lesion may become inapparent on sonography, but still be visible on MR imaging
(Fig. 5.16) (4,9).
Sequestrations classically are in the lower lobes
(Fig. 5.17). However, they may occur in the upper lobes
(Fig. 5.18). They may be infradiaphragmatic and masquerade as an adrenal mass (see Chapter 6, Fig. 6.30), or within
the leaves of the diaphragm (see Chapter 6, Fig. 6.30).
Occasionally, they span the diaphragm. The distinction
between CCAM and sequestration can be made in a homogenously high signal intensity lung lesion when systemic
vasculature (i.e., off the aorta) is visualized feeding the
lesion (Fig. 5.19).
Figure 5.18 Atelectatic sequestration at 32 weeks gestational
age. Coronal T2-weighted image shows a low signal intensity
lesion above the more normal appearing left lower lobe (LLL).
A pleural effusion is present. Systemic vascular supply was not
visible on ultrasound or MR images, however, this was found
to be a sequestration at the time of postnatal surgery. In our
experience, pleural effusions are often present as lung lesions
begin to resolve.
Figure 5.19 Sequestration at 35 weeks gestational age.
Coronal (a and b) and oblique sagittal (c) T2-weighted images
show a left-sided high signal intensity mass (arrow) spanning
the diaphragm. A vessel feeding the mass (arrowheads) originates from the aorta (A). S, stomach. (Courtesy of S. Ulrich,
Perth, Australia.)
100
Congenital Diaphragmatic Hernia
Congenital diaphragmatic hernia (CDH) is a developmental defect of the diaphragm with herniation of the abdominal viscera into the thorax. Although this typically occurs in
the posterolateral left hemidiaphragm (Figs. 5.20 –5.23),
right-sided, bilateral (Fig. 5.24), paraesophageal, and pericardial hernias can also occur.
The high morbidity associated with CDH is due to
pulmonary hypoplasia resulting from the compression of
the developing lungs by the herniated viscera. Because
in utero surgery is now available to treat CDH, it is important to accurately characterize the lesion in order to appropriately triage those patients who will benefit from surgery
(3,19). This is discussed in more detail in Chapter 10.
Fetal MR imaging permits the calculation of lung
volumes (12,20 –24). For these calculations, consecutive
Atlas of Fetal MRI
images are utilized to measure cross-sectional areas of
the lungs with area on each slice being multiplied by the
thickness of the section. In fetuses with suspected pulmonary hypoplasia on ultrasound, lung volumes as calculated
on MR are lower than those of normal fetuses (20). In
infants with poor respiratory outcome, lung volumes are
smaller than those with normal respiratory outcomes
(25). However, volume measurements alone have been
shown to be inaccurate for the prediction of outcome in
fetuses with left-sided CDH (26). Instead, relative lung
volume (measured lung volume divided by volume predicted for gestational age) has been suggested as an accurate manner to assess for pulmonary hypoplasia (20,27)
and has been demonstrated to be predictive of outcome
in fetuses with CDH (20).
Herniation of liver into the chest is associated with a
worse prognosis than when the liver is completely
Figure 5.20 Left-sided CDH with liver in the abdomen at 22 weeks gestational age. Axial (a) and coronal (b) T2-weighted images
show the stomach (S) in the chest. There is mediastinal shift to the right with the heart (H) on the right side of the chest. There are
small bowel loops in chest (arrowhead) and a slightly darker loop that likely represents colon (arrow). (c) Coronal T1-weighted
image shows the liver (L) in the abdomen. A bright loop of bowel in the chest most likely represents meconium in colon (arrow).
[From Levine et al. (46)]
Fetal Thorax
101
Figure 5.21 Left-sided CDH with liver in the
chest at 21 weeks gestational age. Axial (a),
coronal (b), and sagittal (c and d) T2-weighted
images demonstrate the stomach (S) in the
chest. There is mediastinal shift to the right
with the heart (H) on the right side of the
chest. A large portion of the liver (L) is in the
chest. The lung (arrows) can be visualized
posterior and superior to the herniated structures on the left and the right chest. Arrowheads
indicate small bowel in the chest.
Figure 5.22 Left-sided CDH at 31 weeks gestational age. Coronal T2-weighted images show the stomach (S), small bowel (arrowheads), colon (“c” indicated in the figure), and kidney (K) in the chest. The liver is in the abdomen. [(a) and (c) from Levine (31)]
102
Atlas of Fetal MRI
Figure 5.23 Left-sided CDH with organoaxial rotation of the stomach at 36 weeks gestational age. Sagittal left (a), sagittal right (b),
and coronal (c and d) T2-weighted images and coronal (e and f) T1-weighted images show a well-contained left-sided CDH. The stomach
(S) and a portion of the liver (L) are in the chest, but a large amount of normal appearing lung (arrows) is present. The axis of the stomach
is flipped with the greater curvature more superiorly located than the lesser curvature.
Fetal Thorax
103
Figure 5.24 Right-sided CDH (with probable left-sided component) with massive ascites and skin thickening at 30 weeks gestational
age. Sagittal (a) and coronal (b and c) T2-weighted images and coronal (d) T1-weighted image show a large right-sided CDH. Note the
abnormal signal intensity of the small bowel (arrowheads) being of low signal intensity on the T2-weighted images and high signal intensity on the T1-weighted image. The ascites is in contiguity with the fluid in the chest. The probable cause of the ascites and hydrops is the
abnormal liver position, leading to the obstruction of venous return. Thin arrow indicates compressed lung tissue. Large arrow indicates
skin thickening.
intra-abdominal (28 – 30). With ultrasound, the liver can
be difficult to visualize and liver position in the chest
is inferred from the visualization of abnormal position
of the hepatic vasculature. The liver can be observed
on MR imaging as a slightly low signal intensity structure on T2-weighted imaging that is of higher signal
intensity on T1-weighted imaging. In studies by
Hubbard et al. (3,31,32), MR imaging was determined
to be better than ultrasound at assessing the location of
the liver in the chest. However, in a study by Levine
et al. (9), there was 100% concordance between sonographic and MR determinations of liver position, with
100% accuracy based on postnatal surgical findings.
This high concordance rate is likely to be secondary to
the use of confirmatory sonography prior to MR
imaging, performed with the specific question of liver
location in any fetus with CDH.
The contents of CDH are clearly characterized by MR
imaging (8,29,32,33). The stomach tends to be more anteriorly located when the liver is in the abdomen and
becomes posteriorly displaced when the liver herniated
into the chest (29). Organoaxial volvulus of the herniated
stomach can occur and is diagnosed when the greater curvature is located superior to the lesser curvature (Fig. 5.23)
(29,34). Colon, with high signal intensity on T1-weighted
imaging and low signal intensity on T2-weighted imaging,
small bowel with fluid-filled loops, stomach, kidney,
and spleen, all can be well-visualized in hernias
(Figs. 5.20 –5.24).
In right-sided CDH, hepatic venous obstruction
can lead to ascites, hydrothorax, and skin edema
(Fig. 5.24) (35).
Pleural Effusion
A pleural effusion can occur as an isolated finding in the
fetus or in association with hydrops or other syndromes
(Fig. 5.25). Pleural effusions have the appearance of
fluid on MR imaging, being a high signal intensity collection surrounding the lungs on T2-weighted imaging.
Pericardial Effusion and Mediastinal
Masses
Pericardial effusions can be caused by infection, hydrops,
or pericardial tumor. Pericardial effusions surround the
heart, and when large will appear as anterior collections
that deviate the lungs posteriorly (Fig. 5.26). The most
likely etiology of a pericardial tumor is a teratoma. A pericardial teratoma appears as a heterogenous middle
mediastinal mass (Fig. 5.27). Anterior mediastinal
masses in the fetus can be due to teratomas or lymphangiomas (Fig. 5.28).
Lymphangiomas are benign tumors of the lymphatic
system and appear as cystic or septated cystic masses.
Although they typically occur in the neck or axilla, they
can grow quite large. Prognosis depends on the size and
location of the lesion as well as development of hydrops
104
Atlas of Fetal MRI
Figure 5.25 Pleural effusion at 19 weeks gestational age in fetus with trisomy 21. Axial (a), oblique coronal (b), and oblique sagittal
(c) T2-weighted images show a fluid collection (arrows) surrounding the lungs. Note how this pleural effusion appears different from
a pericardial effusion in Fig. 5.26.
Figure 5.26 Large pericardial
effusion at 18 weeks gestational
age. Sagittal (a) and axial (b) T2weighted images show a large
fluid collection (E) surrounding
the heart (H). The effusion compresses the lungs (arrows) posteriorly. Note how this effusion is
different from the more common
pleural effusions (Fig. 5.25) that
surround the lungs.
Figure 5.27 Mediastinal teratoma at 29 weeks gestational age. Coronal (a) and sagittal (b and c) T2-weighted images show a large
heterogenous mediastinal mass (arrows) that deviates the heart (H) inferiorly and to the right. Some normal appearing lung (L) is visualized posteriorly. Note ascites in the abdomen (A) and small pleural effusion (arrowheads).
Fetal Thorax
105
Figure 5.28 Large lymphangioma in fetus at 31 weeks gestational age. Sagittal (a) and axial (b) T2-weighted images of the chest show
the large tumor (T) with intrathoracic extent (arrows) seen as regions of high signal intensity in the anterior mediastinum. (c) Transverse
T2-weighted image orientated to maternal anatomy shows the multiple fluid levels within loculations of the tumor. MR volumetry showed
that the volume of the tumor was 1.5 times that of the fetus. (Courtesy of J. Kazan, Sao Paulo, Brazil.)
(36). Prenatal MR can be utilized to evaluate the extent of
the lesion and associated organ involvement (Fig. 5.28)
(37,38).
MR has been shown to be helpful in the diagnosis of a
mediastinal bronchogenic cyst that caused obstruction, by
characterizing the cyst and defining the hyperexpanded
lungs (Fig. 5.30) (10).
Bronchogenic Cyst
Foregut cysts represent 11– 18% of mediastinal masses in
infants and children (39). Most of these cysts are in the
perihilar region (39). They are lined with ciliated columnar
epithelium, and cause symptoms of airway obstruction
when they are adherent to the wall, or impinge upon the
lumen of the trachea or a major bronchus. A foregut cyst
on MR imaging is seen as a fluid-filled cyst of high
signal intensity (Fig. 5.29) (40). The cyst may be large
and there may be an associated vertebral body
abnormality.
Dark Lungs: Atelectasis, Compression,
and Pulmonary Hypoplasia
When a lung mass or large effusion is present, the adjacent
lung may be compressed. On T2-weighted imaging, this
lung has lower signal intensity than that of the noncompressed lung (Figs. 5.15 and 5.31) (3,9).
As discussed previously, MR imaging has been
suggested as a modality to assess the volume of the
lungs to predict pulmonary hypoplasia. The signal intensity of the lungs has also been suggested as being
Figure 5.29 Esophageal atresia and bronchogenic cyst at 20 weeks gestational age. Axial (a), coronal (b), and sagittal (c) T2-weighted
images show an absent stomach. There is a cyst (arrow) in the chest posterior to the heart, however, there is no mediastinal shift to suggest
a diaphragmatic hernia. This is most consistent with combined esophageal atresia and bronchogenic cyst, which is what was found postnatally. [(b and c) From Levine et al. (46)]
106
Atlas of Fetal MRI
Figure 5.30 Obstructing bronchogenic cyst. (a) Coronal T2-weighted image at 19 weeks gestational age shows a slightly high signal
intensity bi-lobed right-sided mass (arrows). Coronal (b–d), axial (e), and sagittal (f) T2-weighted images at 31 weeks show an enlarged
left lung herniating across midline. The left lung appears hyperinflated with stretched vessels. Lung parenchyma protrudes between ribs.
There is a high signal intensity mediastinal mass (arrowhead) just below aortic arch, at inferior margin of trachea. The right lung is compressed of lower signal intensity than the lung on the left. On follow-up both lungs appeared obstructed. The baby was delivered by ex utero
intrapartum treatment (EXIT) procedure and was placed on extracorporeal membrane oxygenation prior to clamping the umbilical cord. The
obstructing bronchogenic cyst was then surgically removed. H, heart. [(a, e, and f) from Levine et al. (10); (c) from Levine (31)]
Figure 5.31 Compressed lungs in fetus with massive
ascites at 27 weeks gestational age resulting from lymphatic leak. Coronal (a) and sagittal (b) T2-weighted
images show massive ascites (A) elevating the hemidiaphragms. Note the small lungs (arrows) of relatively low
signal intensity. The fetus was treated with large volume
paracentesis. At surgery, a lymphatic leak was documented. H, heart.
Fetal Thorax
prognostic for lung maturity (11) and for pulmonary hypoplasia. Low signal intensity of the lungs on T2-weighted
imaging has been described as consistent with pulmonary
hypoplasia (Fig. 5.32) (2,25). However, in the second
trimester, this finding may not yet be apparent even in
fetuses with anomalies known to occur in conjunction
with pulmonary hypoplasia such as bilateral renal agenesis
(9). Lung volume or a combination of lung volume with
lung signal intensity (25) will likely be a better indicator
of pulmonary hypoplasia than subjective assessment of
signal intensity alone.
Cardiac Abnormalities
Fetal MR imaging is less sensitive than ultrasound in the
diagnosis of cardiac abnormalities. As fetal MR scans
are not gated for fetal cardiac motion, cardiac chambers
are not adequately assessed (41). The small outflow
107
tracts also cannot be adequately evaluated with current
technology. However, attention should be paid to the size
of the heart (Fig. 5.33) and its position in the chest with
respect to fetal situs and abdominal situs (Figs. 5.34 and
5.35). Magnetic resonance imaging is helpful in better
characterizing associated findings in the cases of heterotaxy syndrome, for example visualization of polysplenia
and azygous continuation of the inferior vena cava
(Fig. 5.35). Magnetic resonance has been helpful and beneficial in supplementing sonography by displaying features
of congenital heart disease in the cases of hypoplastic left
heart syndrome (42), poststenotic dilatation in a case of
aortic stenosis (43), truncus arteriosus (44), single ventricle
(Fig. 5.36), and coarctation of the aorta (Fig. 5.37).
Although cardiac rhabdomyomas may be visualized
(Fig. 5.38) (45,46), in the cases of tuberous sclerosis, the
benefit of MR is the evaluation of the brain for intracranial
tubers.
Figure 5.32 Pulmonary hypoplasia at 22 weeks
gestational age in fetus with right-sided renal agenesis
and left-sided multicystic dysplastic kidney. Coronal
(a– c) and sagittal (d) T2-weighted images show the
enlarged left kidney (K) with multiple cysts. The
empty right renal fossa is shown by the lying down
adrenal sign (arrowheads). There is severe oligohydramnios. The lungs (L) are small and are of relatively
low signal intensity. H, heart. [From Levine et al. (46)]
108
Atlas of Fetal MRI
Figure 5.33 Cardiomegaly in association with intracranial
vascular malformation at 28 weeks gestational age. Coronal
T2-weighted images show an enlarged heart (H) spanning the
majority of the diameter of the chest. Large vessels (arrows)
in the neck extend up the dural arteriovenous malformation
(AVM).
Figure 5.34 Dextrocardia. Coronal T2-weighted image shows
the heart (h) on the right side of the fetus consistent with dextrocardia. L, liver.
Figure 5.35 Heterotaxy syndrome at 34 weeks gestational
age. Axial (a and b) and coronal (c) T2-weighted image of
fetus show right-sided stomach (S) and left-sided heart (h). MR
shows polysplenia (arrow) and two vessels are seen anterior to
the spine, the aorta (Ao), and the azygous vein (Av), consistent
with azygous continuation of the inferior vena cava. The esophagus (E) is also visualized. Coronal view (c) shows bilateral high
signal intensity hyparterial bronchi (arrowheads). [From Levine
et al. (9)]
Fetal Thorax
Figure 5.36 Single ventricle. Axial view of the heart showing
a single ventricle. R, right; PDA, patent ductus arteriosus; Pulm,
pulmonary. (Courtesy of K. Siddiqui, Danville, PA.)
109
Figure 5.38 Cardiac rhabdomyomas in fetus with tuberous
sclerosis at 24 weeks gestational age. Oblique axial T2-weighted
image of the heart shows two masses (arrows) with signal intensity similar to myocardium. Multiple other masses were also
present in the heart and in the subependymal regions of the
brain, consistent with tuberous sclerosis.
Pulmonary Agenesis
Esophageal Atresia
It has been suggested that nonvisualization of the mainstem bronchus in a fetus with mediastinal shift without
mass lesion was sufficient for the diagnosis of unilateral
pulmonary agenesis (6). Although these findings should
be absent in pulmonary agenesis, it is common to have
poor visualization of the airways and central pulmonary
vasculature on MR in the cases of unexplained mediastinal
shift (9).
After 19 weeks gestation, esophageal atresia should be one
of the first diagnoses considered with persistent nonvisualization of the stomach (Fig. 5.39). The increased incidence of karyotypic abnormalities with esophageal
atresia suggests that fetal karyotyping should be
Figure 5.37 Coarctation of the aorta. Oblique sagittal view of
the chest showing coarctation of the aorta. PDA, patent ductus
arteriosus. (Courtesy of K. Siddiqui, Danville, PA.)
Figure 5.39 Esophageal atresia in a fetus with an absent
stomach. Oblique sagittal T2-weighted image shows the fluid –
fluid proximal esophagus (arrowhead) posterior to the fluidfilled trachea (arrow). H, heart; L, liver.
110
Atlas of Fetal MRI
considered whenever the stomach is not visualized on
serial ultrasounds. Magnetic resonance imaging appears
to be accurate for establishing or ruling out a prenatal diagnosis of esophageal atresia and should be considered in
fetuses that are at high risk based on ultrasound findings.
Prenatal MR visualization of a distended esophagus in
fetuses with an absent stomach has been reported to be
100% sensitive and specific for esophageal atresia (7).
However, in another report, of three fetuses with esophageal atresia, the esophagus was visualized at the thoracic
inlet in 1/3 (33.3%) and not visualized at all in 2/3
(66.7%) fetuses (9). Associated polyhydramnios may be
present, especially in the third trimester.
Obstructed Hyperexpanded Lungs
Obstructed portions of lung can become hyperexpanded, and
if so, will be visualized as of higher signal than normal nonobstructed lung (Fig. 5.30). Laryngeal or tracheal atresias
can cause enlargement of both lungs. On MR imaging,
these are seen as bilateral enlarged lungs of relatively
increased signal intensity (Chapter 10, Fig. 10.4). The
dilated trachea and bronchi are visualized as filled with
fluid and there is eversion of the diaphragms (3).
7.
8.
9.
10.
11.
12.
13.
14.
CONCLUSION
15.
Fetal MR imaging is helpful in complex chest anomalies
where the sonographic diagnosis is unclear. Quantitative
data available with MR lung volumetry is helpful in
predicting outcome in fetuses with risk of pulmonary
hypoplasia. Prenatal MR is particularly helpful in
assessing organ involvement and predicting outcome in
fetuses with CDH.
16.
17.
18.
REFERENCES
19.
1.
2.
3.
4.
5.
6.
Coakley FV, Hricak H, Filly RA et al. Complex fetal disorders: effect of MR imaging on management—preliminary
clinical experience. Radiology 1999; 213:691– 696.
Ikeda K, Hokuto I, Mori K et al. Intrauterine MRI with singleshot fast-spin echo imaging showed different signal intensities in hypoplastic lungs. J Perinat Med 2000; 28:151–154.
Hubbard AM, Adzick NS, Crombleholme TM et al. Congenital chest lesions: diagnosis and characterization with prenatal MR imaging. Radiology 1999; 212:43– 48.
Quinn TM, Hubbard AM, Adzick NS. Prenatal magnetic
resonance imaging enhances fetal diagnosis. J Pediatr
Surg 1998; 33:553– 558.
Ohgiya Y, Gokan T, Hamamizu K et al. Fast MRI in obstetric diagnoses. J Comput Assist Tomogr 2001; 25:190 – 200.
Kalache KD, Chaoui R, Paris S et al. Prenatal diagnosis of
right lung agenesis using color Doppler and magnetic resonance imaging. Fetal Diagn Ther 1997; 12:360 –362.
20.
21.
22.
23.
Langer JC, Hussain H, Khan A et al. Prenatal diagnosis of
esophageal atresia using sonography and magnetic resonance imaging. J Pediatr Surg 2001; 36:804– 807.
Liu X, Ashtari M, Leonidas JC et al. Magnetic resonance
imaging of the fetus in congenital intrathoracic disorders:
preliminary observations. Pediatr Radiol 2001; 31:435– 439.
Levine D, Barnewolt CE, Mehta TS et al. Fetal thoracic
abnormalities: MR imaging. Radiology 2003; 228:379– 388.
Levine D, Jennings R, Barnewolt C et al. Progressive fetal
bronchial obstruction caused by a bronchogenic cyst diagnosed using prenatal MR imaging. Am J Roentgenol
2001; 176:49 – 52.
Duncan KR, Gowland PA, Moore RJ et al. Assessment of
fetal lung growth in utero with echo-planar MR imaging.
Radiology 1999; 210:197 – 200.
Duncan KR, Gowland PA, Freeman A et al. The changes in
magnetic resonance properties of the fetal lungs: a first
result and a potential tool for the non-invasive in utero demonstration of fetal lung maturation. Br J Obstet Gynaecol
1999; 106:122 – 125.
Conran RM, Stocker JT. Extralobar sequestration with
frequently associated congenital cystic adenomatoid malformation, type 2: report of 50 cases. Pediatr Dev Pathol
1999; 2:454 –463.
Cass DL, Crombleholme TM, Howell LJ et al. Cystic lung
lesions with systemic arterial blood supply: a hybrid of
congenital cystic adenomatoid malformation and
bronchopulmonary sequestration. J Pediatr Surg 1997;
32:986– 990.
Shinmoto H, Kashima K, Yuasa Y et al. MR imaging of
non-CNS fetal abnormalities: a pictorial essay. Radiographics 2000; 20:1227 – 1243.
Hubbard AM, States LJ. Fetal magnetic resonance imaging.
Top Magn Reson Imaging 2001; 12:93 – 103.
Vimercati A, Greco P, Vera L et al. The diagnostic role of
“in utero” magnetic resonance imaging. J Perinat Med
1999; 27:303 – 308.
Coakley FV, Lopoo JB, Lu Y et al. Normal and hypoplastic
fetal lungs: volumetric assessment with prenatal single-shot
rapid acquisition with relaxation enhancement MR
imaging. Radiology 2000; 216:107 – 111.
Rypens F, Metens T, Rocourt N et al. Fetal lung volume:
estimation at MR imaging-initial results. Radiology 2001;
219:236 –241.
Paek BW, Coakley FV, Lu Y et al. Congenital diaphragmatic hernia: prenatal evaluation with MR lung
volumetry—preliminary experience. Radiology 2001;
220:63– 67.
Mahieu-Caputo D, Sonigo P, Dommergues M et al. Fetal
lung volume measurement by magnetic resonance
imaging in congenital diaphragmatic hernia. Bjog 2001;
108:863 –868.
Tanigaki S, Miyakoshi K, Tanaka M et al. Pulmonary
hypoplasia: prediction with use of ratio of MR imagingmeasured fetal lung volume to US-estimated fetal body
weight. Radiology 2004; 232:767– 772.
Osada H, Kaku K, Masuda K et al. Quantitative and
qualitative evaluations of fetal lung with MR imaging.
Radiology 2004; 231:887 – 892.
Fetal Thorax
24.
25.
26.
27.
28.
29.
30.
31.
32.
33.
34.
35.
Walsh DS, Hubbard AM, Olutoye OO et al. Assessment of
fetal lung volumes and liver herniation with magnetic resonance imaging in congenital diaphragmatic hernia. Am J
Obstet Gynecol 2000; 183:1067 – 1069.
Williams G, Coakley FV, Qayyum A et al. Fetal relative lung
volume: quantification by using prenatal MR imaging lung
volumetry. Radiology 2004; 233:457–462.
Metkus AP, Filly RA, Stringer MD et al. Sonographic predictors of survival in fetal diaphragmatic hernia. J Pediatr
Surg 1996; 31:148 – 151.
Leung JW, Coakley FV, Hricak H et al. Prenatal MR
imaging of congenital diaphragmatic hernia. Am J Roentgenol 2000; 174:1607 –1612.
Adzick NS, Harrison MR, Glick PL et al. Diaphragmatic
hernia in the fetus: prenatal diagnosis and outcome in 94
cases. J Pediatr Surg 1985; 20:357 – 361.
Pumberger W, Patzak B, Prayer D et al. Fetal liver magnetic resonance imaging in anterior body wall defects: a
study of specimens from the museum of pathology.
J Pediatr Surg 2003; 38:1147 – 1151.
Hubbard AM, Adzick NS, Crombleholme TM et al. Leftsided congenital diaphragmatic hernia: value of prenatal
MR imaging in preparation for fetal surgery. Radiology
1997; 203:636 –640.
Levine D. Ultrasound versus magnetic resonance imaging
in fetal evaluation. Top Magn Reson Imaging 2001;
12:25– 38.
Beckmann KR, Nozicka CA. Congenital diaphragmatic
hernia with gastric volvulus presenting as an acute
tension gastrothorax. Am J Emerg Med 1999; 17:35– 37.
Gilsanz V, Emons D, Hansmann M et al. Hydrothorax,
ascites, and right diaphragmatic hernia. Radiology 1986;
158:243– 246.
Suzuki N, Tsuchida Y, Takahashi A et al. Prenatally diagnosed cystic lymphangioma in infants. J Pediatr Surg 1998;
33:1599– 1604.
Ruano R, Aubry JP, Simon I et al. Prenatal diagnosis of a
large axillary cystic lymphangioma by three-dimensional
111
36.
37.
38.
39.
40.
41.
42.
43.
44.
45.
46.
ultrasonography and magnetic resonance imaging. J Ultrasound Med 2003; 22:419– 423.
Kaminopetros P, Jauniaux E, Kane P et al. Prenatal
diagnosis of an extensive fetal lymphangioma using ultrasonography, magnetic resonance imaging and cytology.
Br J Radiol 1997; 70:750 – 753.
Snyder ME, Luck SR, Hernandez R et al. Diagnostic dilemmas of mediastinal cysts. J Pediatr Surg 1985; 20:810–815.
Gulrajani M, David K, Sy W et al. Prenatal diagnosis of a
neurenteric cyst by magnetic resonance imaging. Am J
Perinatol 1993; 10:304 – 306.
Levine D, Barnes PD, Sher S et al. Fetal fast MR imaging:
reproducibility, technical quality, and conspicuity of
anatomy. Radiology 1998; 206:549– 554.
Hata K, Hata T, Manabe A et al. Hypoplastic left heart syndrome: color Doppler sonographic and magnetic resonance
imaging features in utero. Gynecol Obstet Invest 1995;
39:70 –72.
Hata T, Makihara K, Aoki S et al. Prenatal diagnosis of
valvar aortic stenosis by Doppler echocardiography and
magnetic resonance imaging. Am J Obstet Gynecol 1990;
162:1068– 1070.
Muhler MR, Rake A, Schwabe M et al. Truncus arteriosus
communis in a midtrimester fetus: comparison of prenatal
ultrasound and MRI with postmortem MRI and autopsy.
Eur Radiol 2004; 14:2120 –2124.
Kivelitz DE, Muhler M, Rake A et al. MRI of cardiac rhabdomyoma in the fetus. Eur Radiol 2004; 14:1513 – 1516.
Levine D, Barnes PB, Korf B et al. Tuberous sclerosis in the
fetus: second-trimester diagnosis of subependymal tubers
with ultrafast MR imaging. Am J Roentgenol 2000;
175:1067– 1069.
Levine D, Hatabu H, Gaa J et al. Fetal anatomy revealed with
fast MR sequences. Am J Roentgenol 1996; 167:905–908.
Levine D, Stroustrup Smith A, Barbaras L et al. Compendium of Fetal MRI [image]. Available online of Beth
Israel Deaconess Medical Center Radiology department
website, 2004.
6
MR Imaging of the Fetal Abdomen and Pelvis
VANDANA DIALANI, TEJAS MEHTA, DEBORAH LEVINE
INTRODUCTION
Genitourinary System
The indications for magnetic resonance (MR) imaging of
the fetal abdomen and pelvis are less well established
than those of the fetal central nervous system and chest.
It has been demonstrated that in cases where the sonographic diagnosis is unclear, MR examinations can
provide important anatomic information that aids in diagnosis, parental counseling, planning delivery, and perinatal
surgical procedures (1 – 11).
The renal parenchyma is of intermediate signal intensity
on T2-weighted images, with high signal intensity in the
collecting system (Fig. 6.4) (12). A thick slice (20 mm)
heavily T2-weighted sequence can be helpful for visualizing the entire collecting system (Fig. 6.5) (14). The adrenal
gland is of relatively low signal intensity on T2-weighted
images (Fig. 6.4) and can be observed in the suprarenal
position. As fat is of high signal intensity on T2-weighted
sequences used for fetal imaging, the perinephric fat also
appears to be of high signal, and should not be mistaken
for ascites (Fig. 6.4).
The urinary bladder is visualized as a high signal intensity structure on T2-weighted images of the pelvis
(Fig. 6.6). Urinary jets can cause focal loss of signal in
the bladder (Chapter 10, Fig. 10.16).
The genitalia are typically well visualized on axial or
sagittal views (Figs. 6.7 and 6.8). The testicles descend into
the scrotum between 28 and 35 weeks and are intermediate
signal intensity structures within the scrotum.
NORMAL ANATOMY
Gastrointestinal Tract
The stomach is seen as a fluid-filled structure in the left
upper quadrant and is hyperintense on T2-weighted images
(Fig. 6.1) and hypointense on T1-weighted images. It is
well visualized by 14– 15 weeks of gestation. It may transiently not be visualized owing to emptying but should be
apparent at some point during a 20 min MR examination
of the fetal torso.
The normal small bowel is fluid-filled. The small bowel
wall is of intermediate signal intensity and the internal
fluid is of high signal centrally on T2-weighted images
(Fig. 6.2) and lower signal intensity on T1-weighted
images. The colon and rectum contain meconium which,
by the late second trimester, has low signal intensity on
T2-weighted images (Fig. 6.2) and high signal intensity
on T1-weighted images (Fig. 6.3) (12,13). The haustral
pattern of the large bowel is recognized after 25 weeks
of gestation (Figs. 6.2 and 6.3) (13).
Liver
The liver is of homogenous, low to intermediate signal
intensity on T2-weighted images, and slightly high signal
intensity on T1-weighted images (Fig. 6.9). The two lobes
of the liver are generally equal in size because of the distribution of the fetal circulation. The ductus venosus is visualized in the late third trimester (10). T1-weighted images
are typically utilized to assess for herniated liver in
fetuses with congenital diaphragmatic hernia (15).
113
114
Atlas of Fetal MRI
Figure 6.1 Normal stomach and spleen. Coronal T2-weighted images at 14 (a), 18 (b), 21 (c), and 34 (d) weeks gestational age. The
stomach (S) is of high signal intensity because of fluid content. The spleen (SP) is of homogenous low to intermediate signal intensity, just
lateral to the stomach. L, liver.
Gallbladder
The gallbladder is visualized as a fluid-filled structure
in the right abdomen and has high signal intensity on
T2-weighted images (Fig. 6.9) and low signal intensity
on T1-weighted images (10).
Spleen
The spleen is of similar signal intensity to the liver and
is visualized as a solid organ lateral to the stomach (10).
It has a homogenous, low to intermediate signal on
T2-weighted images (Fig. 6.1).
Umbilical Cord
The normal umbilical cord consists of two umbilical
arteries and one umbilical vein. The umbilical arteries
proceed from their origin at the iliac arteries along the
lateral margins of the urinary bladder (Fig. 6.6) and then
to the umbilicus. The cord insertion site into the abdominal
wall is well visualized on sagittal and axial images
(Fig. 6.10). The three vessels of the umbilical cord can
also be seen in cross-section on T2-weighted images,
because of the flow void in the vessels surrounded by
the high signal intensity of the amniotic fluid.
Abdominal Vasculature
The flowing vessels in the abdomen and pelvis are of low
signal intensity on T2-weighted images as a result of flow
void (Fig. 6.11) (7). On flow sensitive sequences such as
gradient echo, vascularity can appear hyperintense
(Chapter 5, Fig. 5.6) (10).
(text continued on page 121)
Fetal Abdomen and Pelvis
115
Figure 6.2 Normal small and large bowel. T2-weighted images at 25 (a), 30 (b), 33 (c), and 37 (d) weeks gestational age. The small
bowel (arrows) appears of high signal intensity and the colon (“c” indicated in the figure) of low signal intensity. B, bladder.
Figure 6.3 Normal colon. T1-weighted images at 24 (a) and 31 (b) weeks show the relatively high signal intensity of the colon (arrow)
and the liver (L).