Optimal placement and sizing of PVDG units in a distribution system
Bạn đang xem bản rút gọn của tài liệu. Xem và tải ngay bản đầy đủ của tài liệu tại đây (365.58 KB, 5 trang )
ISSN 1859-1531 - TẠP CHÍ KHOA HỌC VÀ CÔNG NGHỆ ĐẠI HỌC ĐÀ NẴNG, SỐ 11(132).2018, QUYỂN 2
69
OPTIMAL PLACEMENT AND SIZING OF PVDG UNITS
IN A DISTRIBUTION SYSTEM
TỐI ƯU VỊ TRÍ VÀ CÔNG SUẤT CÁC PVDG UNITS TRONG HỆ THỐNG PHÂN PHỐI
Thai Dinh Pham
Thu Duc College of Technology;
Abstract - This paper presents a meta-heuristic optimization
algorithm which is based on the intelligent foraging behavior of honey
bee swarm and called artificial bee colony (ABC). This algorithm is
applied to find out optimal placement and sizing of Solar
Photovoltaics Distributed Generation (PVDG) units under
considering multiple objective functions in a distribution system.
Considerations of the objective function include total power loss
reduction and voltage profile improvement while harmonic distortions
(THD and IHD) comply with harmonic standard IEEE-519. The
simulation study is implemented on the distribution system of IEEE
33 node test feeder. Obtained results show that suitable PVDG units
can bring more benefit in both economic and technical prospects.
Tóm tắt - Bài báo này trình bày một thuật toán tối ưu hóa dựa trên
hành vi tìm kiếm thức ăn thông minh của đàn ong và được gọi là
bầy ong nhân tạo (ABC). Thuật toán này được áp dụng để tìm ra
vị trí và công suất tối ưu của các đơn vị máy phát điện mặt trời
(PVDG Units) dưới sự xem xét nhiều hàm mục tiêu trong một hệ
thống phân phối. Hàm đa mục tiêu bào gồm việc giảm tổng tổn thất
điện năng trên lưới và cải thiện điện áp ở các điểm nút trong khi
sóng hài (THD và IHD) được giữ tuân theo tiêu chuẩn sóng hài cho
phép của IEEE-519. Nghiên cứu mô phỏng này được thực hiện
trên hệ thống phân phối của IEEE 33 node test feeder. Kết quả thu
được cho thấy các đơn vị PVDG được lắp phù hợp có thể mang
lại nhiều lợi ích cả về kinh tế lẫn kỹ thuật.
Key words - ABC; optimization algorithm; PVDG; power loss;
voltage profile; harmonic.
Từ khóa - ABC; thuật toán tối ưu; PVDG; công suất mất mát; điện
áp; sóng hài.
1. Introduction
Nowadays, the integration of renewable energy based
distributed generation (PVDG) units are common in the
distribution network due to many potential benefits. PVDG
units are connected to the system with its optimal location
and size and they can reduce total power losses, improve
voltage and power quality … However, incorrect location
and sizing can cause significant damage such as increased
losses, voltage flicker, fault current, and increased
harmonic distortion in the power system which has
nonlinear loads. Therefore, an effective solution needs to
perform under considering the multiple objective functions
to identify suitable location and sizing of PVDG units.
The received benefits depend on how optimally DG units
are installed. Most of the approaches in finding optimal
location and sizing of DG units are considered for loss
reduction and voltage improvement. There are many
presented approaches such as PSO, Fuzzy logic, ABC, GA
or method based sensitivity analysis. In Ref. [1], a Particle
Swarm Optimization (PSO) methodology has been applied.
PSO is one of the useful and popular methods. In that paper,
the author found the optimal DGs with objective function as
minimum total power loss and voltage in the constraints. It
is necessary to take suitable place and size DGs before
connecting DGs into the distribution system. However, that
paper only consider a single objective function are power
losses. A biology-based optimization method which is very
common as a genetic algorithm (GA) also presented in Ref.
[2] and [3]. These authors used GA as a method of
determining the placement and sizing of DGs. This paper
considers improving voltage as well as power loss reduction
with calculation in power generation and power losses. The
voltage stability and loss reduction are really enhanced after
properly installing DGs in the distribution system. Besides,
the author of Ref. [4] has found suitable DGs by using Big
Bang-Big Crunch method.
That paper tries to minimum power loss as well as
energy loss in a distribution system. A multi-objective
particle swarm optimization (MOPSO) is applied for
optimal placement and sizing of DGs under economic and
technical analysis [5]. Suitable DGs can bring significant
benefits from saving the cost of power losses and
purchasing power. Most previous researches have
overlooked an important element of harmonics. Actually,
when connecting DG units to the distribution system, the
harmonic (THD, IHD) will be changed. According to the
paper in [6], this is a nice paper which presented under
study some types of DGs in the small distribution system.
By using a genetic algorithm (GA), the location, the type,
and the sizes of DGs are successfully found in a
distribution system. The suitable location DG units can
reduce many problems related to power quality. In this
paper, power loss, voltage deviation, and harmonic become
the main issue which needs to be minimized.
However, with the distribution system and many
nonlinear loads, it will be a real-world problem. In
addition, with considering another aspect, THD and IHD
are not necessary to reduce to a minimum, because it will
not bring many benefits instead of minimum other factors
as power losses, emissions…
In this paper, a meta-heuristic algorithm which is called
artificial bee colony (ABC) has been presented. ABC’s
optimization technique was motivated by biogeography,
under the study of operation from employed bees,
onlookers, and scout bees in the natural environment.
ABC is applied to find optimal location and sizing of DG
units for total power loss and voltage profile index reduction
while total harmonic distortion (THD) and individual harmonic
distortion (IHD) reduction are maintained at harmonic standard.
70
Thai Dinh Pham
To evaluate the multiple objectives, a sum of the
weighted method is applied for deciding the fitness of
multi-objective function to obtain the best solution. The
weighted factor depends on the importance level between
the components in the objective function.
In this research, harmonic flow is solved based on the
exact three-phase component models, and combined with
forward/ backward sweep technique which is presented in
[7]. In the test cases, the different harmonic sources are
injected into some loads. With using the applied
methodology (ABC), it will become a strong optimization
technique for finding optimal location and sizing of
multiple PVDGs in a distribution system.
This paper introduced and applied a methodology
which is called artificial bee colony (ABC) in finding
optimal location and sizing of PVDG units in a distribution
system IEEE 33 node test feeder while maintaining
harmonic follow the standard IEEE-519.
2. Problem Formulation
The optimal location and sizing of PVDG units for
multiple objective functions are challenging which need to
solve. This paper focus on the main issue is total power
loss, voltage profile while maintaining total harmonic in
standard limits.
2.1. Opjective Function
The objective function includes 3 components: Total
power loss, voltage profile and harmonics (THD and IHD).
2.1.1. Total Power Loss
The total power loss (TPL) is an important factor for
economic and technical evaluation. The total active power
loss needs to be minimized and can be written by
Nbr
TPL = PL (n)
(1)
n =1
TPLwithDGs
F1 =
TPLwithoutDG
(2)
2.1.2. Voltage profile Index
Voltage profile index (VPI) is one of the elements to
evaluate in the distribution system. VPI can be calculated
from Eq.(3).
n
VPI =
where
i =1
|1 − Vi |
n
(3)
Vi is the voltage of each node (p.u), n is the total
number of node in the system. The ratio of VPI before and
after connecting PVDG units is shown as
F2 =
VPI withDGs
VPI withoutDG
H
h 2 1/ 2
( | Vi | )
i
h 1
100
THD (%) =
| Vi1 |
where
(5)
THD i is the total harmonic distortion at the ith node,
Vi h is the “h” order harmonic voltage at the ith node and Vi1
is the fundamental voltage at the ith node.
Individual harmonic distortion (IHD) is defined:
IHDi (%) =
| Vi h |
100
| Vi1 |
(6)
Where, IHD is the individual harmonic distortion at
the ith node.
By the harmonic standard IEEE-519, the total harmonic
distortion (THD) and individual harmonic distortion (IHD)
should not exceed 5 % and 3 %. In this work, F3 will be
divided into 2 parts: F3-THD and F3-IHD which are defined as:
For F3-THD,
F3 _ THD = 1 −
1
,
e
(7)
max(THD i )
=
, if max(THD i ) 5
where
5
= 0, if max(THD i ) 5
(8)
For F3-IHD,
where PL is the power loss of line in the distribution
system and Nbr is the number of the branches.
The ratio of total power loss with PVDG units and
without PVDG unit is shown as:
2.1.3. Harmonic
This article researches the system which has many
nonlinear loads and this is the cause of the harmonics.
When PVDG units are connected to the system, THD and
IHD will be changed dramatically. This change depends
entirely on the PVDG units location.
Total harmonic distortion (THD) is defined:
(4)
F3 _ IHD = 1 −
1
,
e
max( IHD i )
=
, if max( IHD i ) 3
where
3
= 0, if max( IHD i ) 3
(9)
(10)
Eq.(7) and Eq.(9) are divided into 2 parts. If THD or IHD
violates the harmonic standard limit, they will be gradual
convergence and help to reduce THD and IHD to limits. But
if THD and IHD are in the harmonic limits, the convergence
tends to focus on the rest of objective functions (F1 & F2).
This can help to obtain the best solution.
F3 will be averaged of F3-THD and F3-iHD as:
F3 =
F3 _ THD + F3 _ IHD
(11)
2
Finally, the objective function of the optimization will
be defined as below:
F= min(aF1+bF2+cF3) (12)
In this paper, a sum of the weighted method for multiobjective optimization is used for deciding the fitness value
ISSN 1859-1531 - TẠP CHÍ KHOA HỌC VÀ CÔNG NGHỆ ĐẠI HỌC ĐÀ NẴNG, SỐ 11(132).2018, QUYỂN 2
of the multi-objective function to obtain the best solution.
Minimizing the weighted sum depends on the components
that constitute the objective function. Because the total
power loss reduction has a highest impact on economic and
technology, the weight factor of F1 is the highest.
Harmonic is also quite important and to help reduce
harmonic in the limits quickly, the weight factor of F 3 will
be higher than F2.
2.2. Constraints
The constraints of the objective function (Eq.12) should
be kept in the limits as below:
2.2.1. The voltage limits
The voltage at each node should be kept with voltage
constraint as follows:
Vmin Vi Vmax , i = 1, 2, …, N
(13)
where Vi is the voltage at node ith and N is the node
number; Vmin and Vmax equal to 0.95 p.u and 1.05 p.u,
respectively.
2.2.2. Total harmonic voltage distortion & Individual
harmonic voltage distortion limits
Following the harmonic standard IEEE-519, total
harmonic voltage distortion and individual harmonic
voltage distortion should be met in the constraints as:
THDi (%) THDmax (%) = 5%
(14)
IHDi (%) IHDmax (%) = 3%
(15)
where THDmax and IHDmax are the maximum values of
total harmonic distortion and individual harmonic
distortion which are accepted in IEEE Std. 519.
2.2.3. The PVDGs capacity limits
The active power of DGs should be kept in the limits as
follows:
min
max
PDG
PDG , j PDG
N DG
j =1
PDG , j Pload ,
(16)
min
max
where, 0 1 , PDG
, j and PDG , j are the minimum and
maximum PVDG sizing, Pload is total active power of load
demand and NDG is the number of PVDG units.
3. Applied Methodology
3.1. PVDG units modeling issue
With the strong growth in the connection of PVDG
units into the distribution system, several methods have
been given to solve the optimization problems under
considering the different objective functions. Actually,
PVDG planning is one of the important issues which have
a significant impact on economic and technical prospects.
In this paper, PVDG units supply the active power directly
for the loads. With the optimal location and sizing, PVDG
units have the ability to reduce the power loss, voltage
profile index and maintain harmonic in the standard limits.
3.2. The characteristic of Applied Optimization Algorithm
71
This paper presents a meta-heuristic algorithm that is
called artificial bee colony (ABC) and was introduced by
Haraboga in 2005 [8]. Actually, ABC has common features
with other biology-based optimization methods as PSO,
GAs but it has more outstanding features. The algorithm is
found based on optimization technique inspired by the
intelligent foraging behavior of the honeybee swarm in
natural phenomenon.
The colony of artificial bees includes three kinds of bees:
employed bees, onlookers, and scout bees. The employed
bees are generated randomly for finding food-sources
(solutions). Due to dancing, these bees share the food
source's information with the Onlookers which are waiting
in the dance area of the hive. Food-sources will be evaluated
for each dancing (fitness values). Onlookers will observe the
quality of food-source that employed bees shared.
Realistically, with a good quality food- source, it really
attracts the attention of many bees rather than a bad foodsource. For onlookers and scout bees, once it discovers a
new food-source, it becomes the employed bee. Also, when
employed bees are abandoned, they become onlookers and
scout bees to find new food-sources. Employed bees, after
being generated to find food sources, will remember the
location of the food sources and continue to find new food
sources in the vicinity. If it discovers a new food source that
is evaluated to be of higher quality, it will remember the
location of the new food source and forget the poor quality
source of food. Once all employed bees have completed the
task, they will share the food source location with
Onlookers. Onlookers make the evaluation for all received
food sources and they will select a food source with a
probability related to quality [9].
3.3. Artificial bee colony optimization algorithm
Artificial bee colony optimization algorithm is applied
to solve the optimization problem in finding the suitable
placement and sizing of PVDG units. In this algorithm,
each food-source position is a solution to the problem.
This algorithm generates a randomly distributed initial
population of solution and the initial population of solution
xi can be defined by Eq.(17):
xi = xmin i + rand (0,1) * ( xmax i − xmin i ) (17)
where xmin i and xmax i are lower bound and upper bound of
parameter xi, respectively.
Each employed bee xi generates a new solution vi in
around of curent position as:
vik = xik + ik * ( xik − x jk )
(18)
where xj is a randomly selected candidate solution (i≠j), k is
a random dimension index, and ik is random within [-1 1].
If the fitness of vi is better than its parent xi, then update
xi which has great vi. All employed bees share information
with onlooker bees. Onlooker bees make the evaluation
with probabilistic selection which is based on a roulette
wheel selection mechanism as defined:
72
Thai Dinh Pham
pi =
Ffiti
(19)
n
F
i =1
fiti
where Ffit i is the fitness value of xi solution and n is the
swarm number.
Assume that the abandoned source is xi and the scout
bee finds out a new solution, it will be replaced with ith as:
(20)
xik = lbi + rand (0,1) *(ubi − lbi )
where ub and lb are opper and lower boundaries of the ith
dimension, respectively.
Initialize parameters, bus limit, sizing limit of unit, population
Random Initial solution within limit
Solve power flow and harmonic flow
No
Satisfied criterion ?
Yes
i>imax ?
Yes
Calculate the fitness value
No
Update to neighbor solution
Solve power flow and harmonic flow
No
Satisfied criterion ?
Yes
Calculate the fitness value and retain best solution
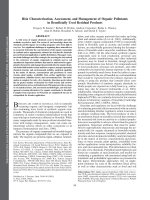
Figure 2. IEEE 33 node test feeder
As mentioned above, the total harmonic distortion and
individual harmonic distortion will be considered with
IEEE standard 519. The harmonic sources are directly
injected to loads of the distribution system with the detailed
information of harmonic spectrums which are shown in
Table 1. In this paper, the weight factors of multiple
objective functions are used with parameters (a, b, and c)
equal to 0.70, 0.10 and 0.20, respectively. There are 2
PVDG units connected to the system. The maximum of
active power is equal to 2.0 MW per PVDG unit; the
maximum power factor of DG units equals to 1.
In this research, nonlinear load positions at node 9, 14,
19, 23, 26 and 31 in the distribution system are shown in
Table 1.
Table 1. Harmonic spectrum
Harmonic
number
Yes
Ob>Obmax ?
No
Calculate Pi value and determine solution with high Pi value
Harmonic
order
5
5; 7; 11;
13; 17
Modify the determined solution, count (Ob)
Solve power flow and harmonic flow
Without PVDG
Yes
Limit reached ?
Yes
No
Generate new solution ramdomly
Solve power flow and harmonic flow
Satisfied criterion ?
No
Yes
Calculate the fitness value
Compare and save the best one
No
0.765; 0.627;
0.248; 0.127; 0.071
28; -180;
-59; 79; -253
Table 2. The results for applied method
No
Satisfied criterion ?
Angle
(degree)
Magnitude (%)
Iter >Itermax ?
Yes
Optimal solution
Location – Sizing
of PVDGs
With PVDGs
Node 14 - 0.8368 MW
Node 30 - 1.3098 MW
Node volt (min)
0.9131 p.u
0.9732 p.u
THD (max)
6.0331 %
3.9247 %
IHD (max)
3.9133 %
2.5465 %
Total power loss
0.2027 MW
0.0868 MW
Based on the obtained simulation results, 2 PVDG units
need to be connected to the system at node 14 and node 30
with capacity equal to 0.8368 and 1.3098 MW,
respectively. The total power loss is significantly reduced
from 0.2027 to 0.0868 MW.
0.375
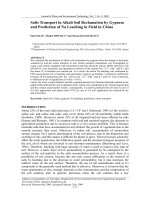
Figure 1. Flowchart of ABC’s algorithm
0.37
4. Simulation Results
The purpose of this research is to find optimal location
and sizing of PVDG units to improve voltage profile,
reduce total active power loss while maintaining harmonic
at IEEE standard 519. IEEE 33 node test feeder is selected
as an experienced case.
0.365
0.36
Fitness
The process of implementation is shown in the
flowchart (Figure 1). In the above flowchart, variable
values (i, Ob, Iter) will be updated by one unit after each
individual loop cycle.
0.355
0.35
0.345
0.34
0.335
0.33
0
5
10
15
20
25
Iter No.
30
35
40
45
50
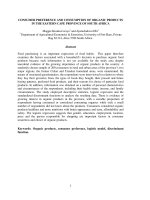
Figure 3. Convergence of ABC’s algorithm (50 iterations)
ISSN 1859-1531 - TẠP CHÍ KHOA HỌC VÀ CÔNG NGHỆ ĐẠI HỌC ĐÀ NẴNG, SỐ 11(132).2018, QUYỂN 2
The convergence of the algorithm seems pretty fast.
This is one of the outstanding features of this algorithm.
1
Without DG
With DGs
0.99
0.98
0.97
pu
0.96
0.95
0.94
0.93
0.92
0.91
0
5
10
15
20
Bus No.
25
30
35
73
5. Conclusion
Artificial bee colony (ABC) method is applied to find
the optimal location and sizing of PVDG units. The main
idea in this algorithm is based on bee behavior. In this
research, the multiple objective functions are to minimize
total power loss and improve voltage profile while
maintaining harmonic in standard limit. This paper does
not focus on reducing harmonics to a minimum; it only
maintains THD and IHD in the harmonic standard limits.
This will open more opportunity for finding the greater
fitness value. The suitable location and sizing of PVDG
units are successfully found out in the distribution system.
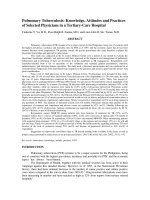
Figure 4. Volt profile without and with PVDG units
Volt profile is significantly improved after connecting
PVDG units and all node voltages are within acceptable
limits.
Figure 5. THD without and with PVDG units
Figure 6. Highest order IHD without and with PVDG units
THD and IHD (%) are reduced to the acceptable limits
thanks to the optimal connection of PVDG units and this is
one of the benefits of PVDG units properly installed.
REFERENCES
[1] Krischonme Bhumkittipich and Weerachai Phuangpornpitak,
“Optimal placement and sizing of distributed generation for power loss
reduction using Particle Swarm Optimization”, 10th Eco-Energy and
Materials Science and Engineering, Energy Procedia 34, 2013.
[2] M. Sedighizadeh, and A. Rezazadeh, “Using Genertic Algorithm for
Distributed Generation Allocation to Reduce Losses and Improve
Voltage Profile”, International Scholarly and Scientific Research &
Innovation, Vol.2, No.1, 2008.
[3] R. Sulistyowati, D. C. Rianwan, and M. Ashari, “PV Farm
Placement and Sizing Using GA for Area Development Plan of
Distribution Network”, International Seminar on Intelligent
Technology and Its Application, 2016.
[4] M.M. Othman, W. El-Khattam, Y. G. Hegazy and A. Y. Abdelaziz,
“Optimal placement and sizing of distributed generators in unbalanced
distribution systems using supervised Big Bang-Big Crunch method”,
IEEE Transaction on power system, vol.30, No.2, Mar. 2015.
[5] A. Ameli, S. Bahrami, F. Khazaeli and M. Haghifam, “A
multiobjective Partilce Swarm Optimization for sizing and placement
of DGs from DG owner’s and distribution company’s viewpoints”,
IEEE Transaction on power delivery, vol.29, No.4, Aug. 2014.
[6] Umar, Firdaus, M. Ashari, O. Penangsang, “Optimal location, size
and type of DGs to reduce power losses and voltage deviation
considering THD in radial unbalanced distribution systems”,
International Seminar on Intelligent Technology and Its
Application, 2016.
[7] J.H. Teng and C. Y. Chang, “Backward/ Forward sweep-based
harmonic analysis method for distribution systems”, IEEE
Transactions on Power Delivery, vol. 22, No. 3, Jul. 2016.
[8] Artificial
bee
colony
algorithm.
[online].
Avalible:
/>[9] S. Sajeevan and N. Padmavathy, “Optimal allocation and sizing of
distributed generation using artificial bee colony algorithm”,
International Research Journal of Engineering and Technology
(IRJET), vol. 03, Iss. 2, Feb. 2016.
(The Board of Editors received the paper on 01/10/2018, its review was completed on 26/10/2018)