Báo cáo y học: " Helicobacter pylori induces mitochondrial DNA mutation and reactive oxygen species level in AGS cells"
Bạn đang xem bản rút gọn của tài liệu. Xem và tải ngay bản đầy đủ của tài liệu tại đây (1.06 MB, 12 trang )
Int. J. Med. Sci. 2011, 8
56
I
I
n
n
t
t
e
e
r
r
n
n
a
a
t
t
i
i
o
o
n
n
a
a
l
l
J
J
o
o
u
u
r
r
n
n
a
a
l
l
o
o
f
f
M
M
e
e
d
d
i
i
c
c
a
a
l
l
S
S
c
c
i
i
e
e
n
n
c
c
e
e
s
s
2011; 8(1):56-67
© Ivyspring International Publisher. All rights reserved.
Research Paper
Helicobacter pylori induces mitochondrial DNA mutation and reactive
oxygen species level in AGS cells
Xue-Wen Huang
1,*
, Rui-Hua Luo
2,*
, Qi Zhao
3
, Zhong-Ze Shen
4
, Li-Li Huang
1
, Xian-Yuan An
1
, Lan-Jing
Zhao
1
, Jie Wang
5
, Yu-Zheng Huang
5
1. Department of Clinical Laboratory, Huadong Sanatorium, Wuxi, Jiangsu Province 214065, China
2. Department of Gastroscopy, Huadong Sanatorium, Wuxi, Jiangsu Province 214065, China
3. Department of Clinical Laboratory, People’s Hospital, Wuxi, Jiangsu Province 214023, China
4. Jiangsu Internation Travel Healthcare Center, Yangzhou Branch, Yangzhou, Jiangsu Province 225009, China
5. Jiangsu Institute of Parasitic Diseases, Wuxi, Jiangsu Province 214063, China
* Xue-wen Huang and Rui-hua Luo are co-first authors.
Corresponding author: Dr. Xue-wen Huang, E-mail:
Received: 2010.11.02; Accepted: 2011.01.01; Published: 2011.01.08
Abstract
To investigate the role of ROS in the helicobacter pylori (Hp) induced mtDNA mutations,
AGS cells were treated by extracts of Hp11638 or Hp11638M. The ROS levels, cytochrome
C reductions, and intracellular ATP levels were measured. The coding region and the D-Loop
region were amplified and sequenced. Results showed the ROS levels, cytochrome C re-
duction and mtDNA mutations were markedly increased and cell viability decreased after
treatment with both Hp extracts, and 616 mutations were detected in D-Loop region and 3
heteroplasmic point mutations in the Cytb gene. No mutations were found in the coding
region. The mutation rates of mtDNA D-Loop region were positively correlated with the
ROS levels and negatively to the ATP levels.
Key words: Helicobacter pylori; Reactive Oxygen Species; Mitochondrial DNA; Mutation.
Introduction
Helicobacter pylori (Hp) are Gram-negative mi-
croaerophilic bacteria. Hp infection represents a key
factor in the etiology of various gastrointestinal dis-
eases, ranging from chronic active gastritis without
clinical symptoms to peptic ulceration, gastric ade-
nocarcinoma, and gastric mucosa-associated lym-
phoid tissue lymphoma. H . p ylo r i -positive patients
have a 10 to 20% lifetime risk of developing ulcer
disease and a 1 to 2% risk of developing distal gastric
cancer [1]. The cytotoxin-associated gene A (CagA)
protein a nd vacuolating cytotoxin (VacA) protein are
the main virulence factors of Hp and closely relevant
with the occurrence of gastric ulcer and carcinoma [2].
Most H. pylori strains secrete VacA into the extracel-
lular space. After exposure of VacA to acidic or basic
pH, re-oligomerized VacA (mainly 6 monomeric
units) at neutral pH is more toxic [3]. CagA (120-145
kDa protein) is a highly anti-genic protein that is as-
sociated with a prominent inflammatory response. It
has a pathogenic effect on gastric and duodenal mu-
cosa leading to the development of peptic ulcers [4].
Studies have shown that Hp can induce reactive
oxygen species ( ROS ) p ro d uc tio n and programmed
cell death in human gastric epithelial cells [5,6]. R OS
are produced as a normal product of cellular meta-
bolism and include superoxide anion (O
2
•ˉ), hydro-
gen peroxide (H
2
O
2
), hydroxyl radical (HO•), nitric
oxide (NO•), etc. They are highly reactive due to the
presence of unpaired valence shell electrons and can
diffuse only an extremely short distance before they
Int. J. Med. Sci. 2011, 8
57
dissipate. Elevated levels o f ROS have been impli-
cated in cellular physiological and pathological
processes such as cell proliferation, apoptosis, diffe-
rentiation, carc inogenesis, etc [7]. Mitochondria are
the centre of energy metabolism in the cell and a ma-
jor source of ROS . The proportion of oxygen con-
v e r t e d i n t o O
2
• ˉ a c c o u n t s f o r a b o u t 1 -2 % o f t h e o v e r a l l
oxygen consumption [8]. Mitochondrial DNA
(mtDNA) is an extranuclear genetic material. mtDNA
is particularly susceptible to ROS generated by the
r e s p i r a t o r y c h a i n d u e t o i t s c l o s e p r o x i m i t y and l a c k o f
protective histones, and inefficient DNA repair sys-
tems [9].
Evidence shows Hp VacA c an activate the
p38/activating transcription factor 2-mediated sig-
naling pathway resulting in decrease in mitochondrial
membrane potential [10] and can induce suppression
of energy metabolism followed by mitochondrial
damage, leading to impairment of the cell cycle in
gastric epithelial cells [11]. Recent studies suggest Hp
can increase the mtDNA mutation in AGS cells a nd
mtDNA mutations have been found in Hp infected
gastric ulcer and carcinoma tissues [12,13]. However,
the role of ROS in the Hp induced mtDNA mutations
is still unknown and the impacts of Va cA and CagA
on the RO S production and mtDNA mutations are
poorly understood.
To investigate the ROS production and mtDNA
mutations in the Hp infected cells, AGS cells were
stimulated by the extract of NCTC Hp11638 (CagA+,
Va cA+) or the mutant Hp11638M (CagA+, VacA-).
The relationships between ROS and mtDNA muta-
tions as well as mutations in D-loop were evaluated.
Our results demonstrated the ROS levels and the
amount of mtDNA mutations in cells treated by the
extract of Hp11638 were markedly higher than those
in cells treated by Hp11638 mutant strain. Several
mutations in D-Loop region were also detected, but
Cox-I, Cox-II, Cox-III, ATPase6 and ATPase8 genes
had no mutations. Furthermore, 3 heteroplasmic point
mutations were identified in Cytb gene and Hp in-
duced mutations in D-Loop region were closely re-
lated to the bacterial virulence and the endogenous
ROS level.
Materials and metho ds
Cells and Hp Strains
AGS cells were purchased from Shanghai Insti-
tute of Cell. NCTC Hp 11638, NCTC Hp11638M a nd
E.coli ATCC 25922 were kindly provided by the De-
partment of Medical Microbiology and Parasitology,
Shanghai Jiaotong University School of Medicine.
Reagents
F12 culture medium (Hangzhou Jino Biology
Co., Ltd. China), fetal bovine serum (FBS), ampicillin,
penicillin and streptomycin (Shanghai
Bio-engineering Co., Ltd. China), br ai n heart inf us io n
agar and liquid medium (OXOID Co., Ltd. U K), LB
medium (Beijing Solarbio Co., Ltd. China), gas mix-
ture (5% O
2
, 85% N
2
, 10% C O
2
) (Shanghai Shenkai Gas
Co., Ltd. China), anti-CagA and anti-VacA polyclonal
antibodies (Santa Cruz, USA), AP conjugate d sec-
ondary antibody, CellTiter-Glo luminescent cell via-
bility assay kit (Cat.#G7570, Promega Co. USA), Di-
hydrorhdamine-123 (DHR-123) and oxidized cytoch-
rome c (S igma , USA) and AGS mtDNA extraction kit
GenMed Scientifics Co., Ltd USA) were used in the
present study.
Cells and Hp Culture
AGS cells w ere grown in the F12 culture me-
d i u m containing 10% FBS, 100 U/ml penicillin and
100 µg/ml streptomycin in a humidified atmosphere
of 5% CO
2
and 95% air at 37°C.
Hp was grown in the brain heart in fu si on agar
containing 7% defibered s h e e p b l o o d a n d H p s e l e c t i ve
antibiotic V.C.A. for 72 h. Colonies were identified by
Gram-s t a i n e d smear and biochemical reactions, and
the washed with 5 ml of brain heart infusion liquid
medium. The eluate was incubated with brain heart
infusion liquid medium containing 10% FBS and Hp
selector. The bacteria were cultivated at 37°C for 48 h
under a microaerophilic condition (5% O
2
, 85% N
2
,
10% CO
2
) with continuous shaking.
E. coli were maintained in the LB liquid medium
(containing 100 µg/ml ampicillin) at 37°C for 12 h
with continuous shaking.
Preparation of Hp and E.coli extract
The Hp a nd E. coli were harvested, centrifuged
at 12000 g for 10 min, washed 3 times with P BS , an d
then re-suspended in 5 ml of sterile double-distilled
water. The suspension was vigorously oscillated for
10 min and kept at room temperature overnight. O n
the next day, the supernatant was obtained and vi-
gorously oscillated for 10 min followed by centrifu-
gation at 12000 g for 10 min. The supernatant was
collected and the sediment was re-suspended in 5 ml
of sterile double-distilled water, and kept on the ice
followed by sonication 3 t i m e s (30 sec per time with
an interval of 4 5 se c). T hen, centrifugation wa s per-
formed at 12000 g for 10 min and the supernatant was
collected. All the supernatants were finally mixed and
freeze-dried. T h e d r y p o w d e r w a s d i s s o l v e d in 1 ml of
sterile double-distilled water and stored at -40℃ for
use. Immediately before use, the solution was centri-
Int. J. Med. Sci. 2011, 8
58
fuged at 18000 g for 10 min and the supernatant was
filtered through a 0.22 μm filter to remove bacteria
a n d m a c r o mol e c u l a r c o m p l e x ( m e m b ra n e s containing
lipopolysaccharide and flagella) [14]. The protein
concentration was determined with a DNA/Protein
Analyzer (Beckman Du 800). The protein concentra-
tion in the Hp11638 extract, Hp11638M extract a nd
E.coli ATCC25922 extract was 20 mg/ml, 30 m g / m l
and 28 mg/ml, respectively. Then, the pr ot ei n co n-
centrations of Hp11638M extract and E. coli extract
were adjusted to 20 mg/ml.
Detection of CagA and VacA protein using
SDS-PAGE and Western Blot
Five microliters of extracts were mixed tho-
roughly with 20 μl of loading buffer, which were then
boiled for 5 min. Te n microliters of the mixture were
subjected to SDS–PAGE, and bands were captured.
Treatments of AGS cells
AGS cells in the logarithmic phase were divided
into two groups. Cells in on e g r o u p w ere grown i n t h e
medium containing 1 μmol/L DHR-123 and 60
μg/ml, 120 μg/ml, 240 μg/ml, 480 μg/ml or 960
μg/ml Hp extract for 24 h and those in the other
group maintained in the medium containing 480
μg/ml Hp extract and 1 μmol/L of DHR-123 for 3 h , 6
h, 9 h, 1 2 h and 24 h. Cells in the blank control were
grown in the culture medium alone. In the negative
control group, Hp extract was replaced with E.coli
extract. Cells in the positive control group were in-
cubated in the medium containing 1 µ mol/L
DHR-123 and 50 µmo l/ L H
2
O
2
for 24 h.
Detection of ROS using Flow cytometry
Cells were washed with PBS once. After trypsin
digestion, AGS cells were re-suspended in PBS and
1×10
4
viable cells were measured in each sample by
FACScalibur (BD Bioscience). Histogram analysis was
performed to analyze the mean fluorescence intensity
of rhodamine 123 and ROS level can be expressed as
the intensity of fluorescence [15]. All experiments
were repeated for three times and data were expresses
as
Χ
± SD.
Analysis of Cytochrome c reduction
Cytochrome c reduction directly reflects the
generation o f O
2
• ˉ i n c e l l s . T o further confirm the R OS
levels, cytochrome c reduction was determined. After
trypsin digestion, AGS cells were re-suspended in
culture medium and cell density was adjusted to
3×10
6
/ml. Then, cells were incubated with cy toch-
rome C (50 μ mo l/ l) for 15 min and centrifuged at 200
g for 10 min at 4℃. The absorbance of supernatant
was measured using a spectrophotometer at 550 nm.
The absorbance can be converted into the reduction of
cytochrome c by the extinction coefficient for cytoch-
rome c (2.1×10
4
M
-1
cm
-1
). The results were expressed
as unit nmol/3×10
6
AGS cells/15 min [16]. The me-
dium containing 5 0 μ mol /l reduced cytochrome C
alone served as a blank control in the detection of
absorbance. The experiment was repeated 3 ti m e s a nd
data were expressed as
Χ
± SD.
Detection of cell viability
Mitochondria play a major role in cellular func-
tion su ch as the productions of ATP and R OS. Ele-
vated R OS l ev el can ca use oxidative damage directly
to mtDNA resulting in abnormality in ATP produc-
tion. Therefore, the amount of ATP was further de-
termined aiming to indirectly detect the cell viability
and the mitochondrial activity and fu nction [17]. After
trypsin digestion, cell concentration was adjusted to
3×10
5
/ml w ith medium and the ATP level was tested
according to the manufacturer’s instruction. The in -
tensity of the Luminescence (RLU) signals represents
the cell viability.
Extraction of mtDNA of AGS cells
After trypsin digestion, AGS cells were then
suspended in PBS a nd AGS mtDNA extraction was
performed according to the manufacturer’s instruc-
tions.
PCR amplification, sequencing and comparison
of various mtDNA segments
The primers for mtDNA D-Loop region were
synthesized by Shanghai Sangong Co., Ltd. (Table 1)
and a total of 50 μl of mixture used for amplification.
The products were sequenced by S ha ng ha i Sangong
Co., Ltd. immediately after purification. The primers
for sequencing were t hos e f or amplification.
Us ing the DNA Star software, mtDNA se-
quences of AGS cells after H p e x t r a c t treatment were
compared w ith those in the bl an k control (AGS cells).
mtDNA mutation is defined as both sequences are
different from the those in controls. If two peaks at a
particular point are observed in the sequence, only
when the lower-intensity peak accounted for more
than 20% of the specific peak, a mixture of signals
from two bases can be determined, and hence hete-
rogeneous mutation that occurs at this locus can be
identified [18].
Int. J. Med. Sci. 2011, 8
59
Table 1 Primers sequence of mtDNA genes
Sequence Forward primer (5’→3’) Reverse primer (5’→3’) Anticipated length (bp)
D-Loop ATTCTAACCTGAATCGGAGG GATGCTTGCATGTGTAATCT 1528
ATPase8 CCCGGACGTCTAAACCAAACC GGGGATCAATAGAGGGGGAAATA 512
ATPase6 AATTACCCCCATACTCCTTACACT GGGTCATGGGCTGGGTTTTACTAT 857
COX-I CCTCGGAGCTGGTAAAAA GGGGGTTCGATTCCTTC 1654
COX-II ACTACCCCGATGCATACACCACA GGGCAATGAATGAAGCGAACAG 1333
COX-III GCCGTACGCCTAACCGCTAACA TCGTAAGGGGTGGTTTTTCTATG 1177
Cyt b CGCACGGACTACAACCACGAC GGACAGGCCCATTTGAGTATTTTG 1212
Statistical Analysis
Data were analyzed wi th SAS vers ion 11.0 sta-
tistical softwar e. Comparisons between multiple
groups were performed with one way analysis of va-
riance. Differences among groups were evaluated by
Newman-Keuls’ Q-test. Differences between two
groups were evaluated wi th t or t’ test. The mtDNA
mutation rates were assessed with the chi-square test.
The relationship between ROS and mtDNA mutation
rate was assessed using a linear correlation test.
Results
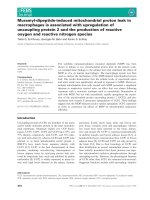
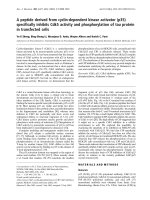
CagA and VacA proteins
As shown in Fig. 1a a n d b , the CagA protein (120
kDa) and VacA protein (95 kDa) were expressed in the
wide type Hp11638, whereas only the CagA protein
was identified in the mutant Hp11638M.
Fig.1 Detection of CagA and VacA protein by Western
B l o t . a : C a g A p r o t e i n ( a r r o w ) b : V a c A p r o t e i n ( a r r o w ) . L a n e
1: Marker; Lane 2: Hp 11638M; Lane 3: Hp11638.
ROS levels in the AGS cells
C o m p a r e d w i t h t h e b l a n k c o n t r o l , t h e R O S l e v e l s
of the negative control were no obvious change at all
stimulated concentration and duration. (The ROS le-
vels were not significantly changed in the blank con-
trols and negative controls)
When compared with the negative control, the
ROS levels i n the AGS cells were markedly increased
after stimulation wi th Hp11638M e xtr act or Hp11638
extract (Fig. 2). Moreover, th e ROS levels in AGS cells
treated with 480 µg/ml and 960 µg/ml Hp11638M
extract and with 240 µg/ml, 480 µg/ml and 960
µg/ml Hp11638 extract were remarkably higher than
those in th e positive control (310.67±24.01, P<0.01)
(Fig. 3b-g). Furthermore, the ROS levels in AGS cells
stimulated by Hp11638 extract of difference concen-
trations were significantly higher than those in cells
treated by Hp11638M extract of corresponding con-
centrations (P<0.05) (Fig. 3c and f, other illustrations
were not listed). As shown in Fig. 4, a similar trend
was observed in the cytochrome c reduction.
As s ho wn in Table 2, the ROS levels in the AGS
cells stimulated by Hp11638M extract and Hp11638
extract were dramatically higher than those in the
negative control (P<0.01), and the ROS level elevated
with the prolongation of stimulation (P<0.01). After
treatment with Hp11638M for 12 h and 24 h and wi th
Hp11638 for 6 h , 9 h, 12 h and 24 h, the ROS levels
were significantly higher than in the positive controls
(P<0.01). In addition, the ROS levels after stimulati on
by Hp11638 extract were remarkably higher than after
stimulation by Hp11638M extract at the same time
point (P<0.05). Similar trend was also observed in the
cytochrome c reduction (Fig. 5).
0 1 2 0 2 4 0 3 6 0 4 8 0 6 0 0 7 2 0 8 4 0 9 6 0 1 0 8 0
0
5 0 0
1 0 0 0
1 5 0 0
2 0 0 0
2 5 0 0
H p 1 1 6 3 8 M
H p 1 1 6 3 8
C o n c e n t r a t io n o f H p e x t r a c t s ( µg / m l )
R O S l e v e l s
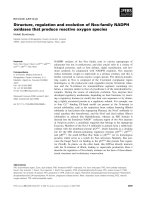
Fig.2 The ROS levels in the AGS cells after treatment with
different Hp extracts of various concentrations. The ROS
levels increased with the increase in the concentration of
H p e x t r acts. The ROS levels after Hp11638 treatment were
markedly higher than after mutant Hp11638M treatment at
each concentration (P<0.05).
Int. J. Med. Sci. 2011, 8
60
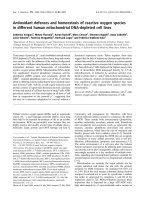
Fig.3 ROS levels in the AGS cells after24 h of stimulation by Hp extracts of various concentrations. a: Negative control.
Cells were stimulated by 960 µg/ml E. coli extract and the ROS level was 3; b: Positive control. Cells were incubated with
c u l t u r e m e d i u m c o n t a i n i n g 1 µ m o l / l D H R -12 3 a n d 5 0 µ m ol / l H
2
O
2
a n d t h e R O S l e v e l w a s 1 8 8 ; c : C e l l s w e r e st i m u l a t e d b y
480 µ g / m l H p 1 1 6 3 8 M e x t r a c t a n d t h e R O S l e v e l w a s 8 7 4 ; d : C e l l s w e r e s t i m u l a t e d b y 9 6 0 µ g / m l H p 1 1 6 3 8 M e x t r a c t a n d t h e
ROS level was 1334; e: Cells were stimulated by 240 µg/ml Hp11638 extract and the ROS level was 835; f: Cells were
stimulated by 480 µg/ml Hp11638 extract and the ROS level was 1395; g: Cells were stimulated by 960 µg/ml Hp11638
extract and the ROS.