Examining influenced factors of the preparation phase on total construction time delay of buildoperate-transfer transport projects in Vietnam
Bạn đang xem bản rút gọn của tài liệu. Xem và tải ngay bản đầy đủ của tài liệu tại đây (331.79 KB, 13 trang )
Transport and Communications Science Journal, Vol. 70, Issue 3 (09/2019), 201-213
Transport and Communications Science Journal
EXAMINING INFLUENCED FACTORS OF THE PREPARATION
PHASE ON TOTAL CONSTRUCTION TIME DELAY OF BUILDOPERATE-TRANSFER TRANSPORT PROJECTS IN VIETNAM
Nguyen Hoang-Tung1*, Pham Diem-Hang1
1
Faculty of Construction Management, University of Transport and Communications, No. 3
Cau Giay Street, Hanoi, Vietnam.
ARTICLE INFO
TYPE: Research Article
Received: 24/7/2019
Revised: 25/8/2019
Accepted: 16/9/2019
Published online: 15/11/2019
/>*
Corresponding author
Email: ; Tel: 0936038389
Abstract. The involvement of private investors in public works has been widely-known
under the scheme of Public-Private Partnerships (PPP) world-wide. Although being started
in early years of the twenty-one century, the PPP scheme in Vietnam is still waiting for its
booming period due to an incomprehensive regulation system. As of an approval of some
important PPP decrees, the period of 2010-2018 is considered as a remarked period for the
PPP development in Vietnam, especially in transport sector. Using the neural network
approach, this study contributes to the literature by providing an insight of 48 build-operatetransfer (BOT) transport projects completed in the period. Findings of this study are
meaningful to the field because they highlight several influenced factors of the project
preparation phase those affect total completed construction time of the investigated
projects.
Keywords: Public-Private Partnerships, Build Operate Transfer, Transport, Vietnam,
Project Delay.
© 2019 University of Transport and Communications
1. INTRODUCTION
Public-Private Partnerships (PPP) is known as an essential alternative approach for
developing infrastructure of a country due to its role in pushing up economic values [1] or
201
Transport and Communications Science Journal, Vol. 70, Issue 3 (09/2019), 201-213
fostering the sustainability of the sector [2].
Motivated by financial benefits of the PPP scheme, researchers firstly approach the PPP
on a viewpoint of an actual project [3] that is to focus on cost, concession, equity and contract
analyses [4]. Such analyses are then upgraded into complicated financial models for various
research objectives [5]. Financial aspects are also considered in numerous studies on the
partnership between public and private sectors [6]. In addition, risk and success factors are of
researchers’ interests, in a particular of risk evaluation and allocation [7,8]. Moreover, a large
number of studies have been conducted on management viewpoints, for example,
procurement management [9], contract management [10] and performance management [11].
Of the governmental viewpoint, several topics have been shaped including modelling
governance [12], implementing governance [13] and regulations [14].
In the context of developing countries, despite a common sense that the PPP scheme will
improve project efficiencies and attract capital investments of private investors, numerous
shortcomings have been identified. A study of Agarchand and Laishram [2] showed an
unsatisfactory performance of PPP projects in India which is mainly due to procurement
issues. Another research effort of Babatunde and others [15] has pointed out ten group factors
considered as barriers to PPP projects in Nigeria context. Among those, a problem caused by
delays has been revealed including receiving payments [16], negotiations, lengthy
bureaucratic procedures or political debates [17,18].
Of Vietnam context, a large portion of PPP projects were found inefficient and/or not
able to achieve their investment objectives [19]. The main reason for such inefficiency is
probably due to a weak legal framework [20]. Up to our latest awareness, it is surprisingly
noted that most of studies of Vietnam context is to focus on legal framework issues, for
example, identifying factors for a successful PPP implementation [21], thus lacking of a
systematic view based on practical evidences of numerous project implementations.
In particular, as of reports of the government inspectorate of Vietnam on the
implementation of various BOT transport projects, it is noted that a large portion of the
projects is behind their schedules [22, 23]. Numerous causes of the delay have been reported,
for example, settlement issues, funding issues, etc. These causes are of both the preparation
phase and the implementation phase. While regulatory efforts of Vietnamese authorities are
urgently made to solve the problem [24], it is obvious that such efforts take time to be
effective. As such, it is needed to look for supporting solutions to deal with the problem of
project construction delays.
In a notion that risk allocation is one of key barriers preventing private sector in
participating in PPP transport projects in Vietnam [25], and construction delays are probably
among critical causes increasing the negative exposure of project risks, we argue that project
delays should be considered a kind of risk and this risk should be aware of at a very first stage
of a project implementation. In other words, factors that allow us to recognize the problem of
202
Transport and Communications Science Journal, Vol. 70, Issue 3 (09/2019), 201-213
construction delays should be identified as soon as possible at the preparation phase. It is
however that there are no studies in Vietnam context considering such important issue.
Motivated by the above-mentioned shortcomings, this study aims to investigate
influenced factors of the preparation phase those affect total construction time of buildoperate-transfer (BOT) transport projects completed during a period of 2010 to 2018. Several
related issues are also revealed to provide a better understanding of the BOT projects in
transport sector of Vietnam during the investigation period.
To serve the purpose of this study, various factors of the preparation phase those are
potential in affecting total construction time are firstly theoretically identified. These factors
and total construction time delay are then empirically obtained by a questionnaire interview
with project-related parties. Based on the collected data, the relationship between the
investigated factors and total construction time delay is determined using a data mining
technique called multilayer perceptron (MLP). Results of the MLP model allow us to
determine the role of each of the factors in affecting total construction time delay.
2. MODELLING APPROACH
The investigated factors
Being the first study exploring influenced factors of the preparation phase on total
construction time delay, various factors have been considered including experiences of the
project management unit, experiences of investors, status of cost modification, number of
investors, site dispersion, new construction involvement and number of provinces.
As suggested by a critical role of experiences in performance of PPP projects [26],
experiences of investors and the project management unit have been investigated. The project
management unit acts as the one to coordinate all stakeholders of a project, as such its
experiences may take a critical role in deciding the smoothness of project implementation,
thus contributing to the project total construction time. Investors are known to have a strong
influence on most of the project activities, their experiences can therefore be considered as an
important factor in affecting project construction time.
In awareness of numerous issues related to legal framework, norms, administrative
procedures and site clearance of PPP projects [24], numerous factors are supposed to affect
project total construction time. Cost modification before the start of construction work may
affect construction contractors’ implementation strategies, thus indirectly affect the total
construction time. Because of different administrative procedures and issues of benefit
confliction, number of investors and provinces involved in a project can also be seen as
factors those contribute to a longer “waiting time” of a project implementation. Finally, noted
as a major problem of project delay in the practice of Vietnam [23], the problem of site
clearance is investigated through two factors of the preparation phase including site dispersion
and new construction involvement. While numerous site locations may increase negotiation
203
Transport and Communications Science Journal, Vol. 70, Issue 3 (09/2019), 201-213
time with local citizen, the involvement of new construction work obviously requires time for
site clearance that has a high risk of project delay.
Multilayer perceptron
The MLP has been widely used in various disciplines. Of transport studies, the technique
is widely employed in traffic forecasting [27] and service performance [28]. The outstanding
advantage of MLP is to strongly detect complicated patterns and/or trends between input and
output data. Advantages and disadvantages of MLP can be found in several studies [29].
The multilayer perceptron has a network of nodes. These nodes act as processing
elements. The elements are arranged in three or more layers typically including input layer,
hidden layers and output layer. This is illustrated in Figure 1.
Hidden layers
Input layer
Output layer
Connection
weights
Figure 1. Components of a multilayer perceptron network.
In principle, when data is available at input layers, calculations will be performed in
successive layers until each of output nodes has its value. Such values show the class
appropriateness of the input data. A node is considered as an artificial neuron which produces
the weighted sum of inputs under consideration of bias. The sum is then processed under an
activation function. This process is described as follows:
m
j = ji xi + j and j = f j ( j )
(1)
i =1
Where j is a linear combination of inputs xi ; j is the bias; 𝜏𝑗𝑖 is connection weights
and ji is the output of a node.
An activation functions acts a link to connect the weighted sums in a layer to unit values
in the next layer. In this study, the activation function for hidden layers is hyperbolic tangent
and the activation function for output layer is softmax. The functions have following forms:
Hyperbolic tangent:
𝑒 𝜔 −𝑒 −𝜔
𝑓(𝜔) = tanh(𝜔) = 𝑒 𝜔 +𝑒 −𝜔
204
(2)
Transport and Communications Science Journal, Vol. 70, Issue 3 (09/2019), 201-213
𝑒𝑥𝑝(𝜔𝑘 )
𝑓(𝜔𝑘 ) = ∑
Softmax:
𝑗 𝑒𝑥𝑝(𝜔𝑗 )
(3)
Where k, j are indicators of nodes.
The hyperbolic tangent uses real-valued arguments and transforms them to the range (–1,
1), whilst softmax uses a vector of real-valued arguments to produce a vector whose elements
are within the range (0, 1) and sum to 1.
Of training mechanism, Batch training strategy is employed. Details of the Batch training
can be found at Jang and others work [30]. The training need a pass of all training data before
updating the synaptic weights. In other words, it processes all information of the training
dataset. The training is preferred by researchers due to its direct approach in minimizing the
total error.
3. DATA
Data collection
A data survey has been implemented in Fall 2018. Interviewees are from the Ministry of
Transport and project-related Provincial People Committees. The same questionnaire set has
been repeatedly used for different interviewees. There are no specific requirements towards
the number of the interviewees. The survey is stopped when all needed information of the
investigated projects is obtained. Interviewees were asked to fill in a two-dimension table in
which each row contains information of a project and each column indicates a tier of
information. After two weeks of the survey implementation, data collected is screened to
make sure similar answers are obtained for the same question. This guarantees the reliability
of the survey data.
A total of 51 completed BOT transport projects have been investigated through out the
country. After data screening process, three projects are excluded due to contradict data
sources, thus data of 48 projects is used for analyses. Various factors of the preparation phase
of a project have been investigated, in which total construction time delay is calculated by
subtracting actual total construction time to planned total construction time. List of
investigated BOT projects and factors are presented in Table 1a and 1b.
Table 1a. List of investigated BOT projects.
1
2
3
4
5
6
Bypass road of Vinh city and expansion of NH No.1A
section Ben Thuy - Hatinh City
Expansion of NH No.1 section Km672+600 Km704+900 in Quang Binh province
Expansion of NH No.1 section Km947 - Km987 in
Quang Nam province
Expansion of NH No.1 section Km1212+400-Km1265
in Binh Dinh and Phu Yen provinces
Expansion of NH No.1 section Km741+170Km756+705 in Quang Tri province
Upgrading of NH No.18 section Uong Bi City - Ha
Long City
25
26
27
28
29
30
205
Construction of Phuoc Tuong - Phu Gia Tunnel, NH No.1A in
Thua Thien Hue province
Expansion of NH No.1 section Km987 - Km1027 in Quang Nam
province
Construction of Co Chien bridge NH No.60 in Ben Tre and Tra
Vinh provinces
Bypass of NH No.1 section Phu Ly City and upgrading NH No.1
section Km215+775-Km235+885 in Ha Nam
Expansion of NH No.1 section Northern side of Bac Lieu City and
Correction of some flooded sections of NH No.1
Upgrading of Ho Chi Minh road (NH No.14) section
Km1793+600 đến Km1824+00 in Dak Nong province
Transport and Communications Science Journal, Vol. 70, Issue 3 (09/2019), 201-213
7
Bypass road of NH No.1 Section Bien Hoa City
31
Upgrading NH No.91 section Km14+000 - Km50+889
8
Upgrading of NH No.1 Section Phan Thiet - Dong Nai
32
Expansion of NH No.1 with 4 sections in Ninh Thuan province
9
Expansion of NH No.1 section Km368+400 ÷
Km402+330 in Thanh Hoa and Nghe An provinces
33
Upgrading of Ho Chi Minh road section from NH No.2 to Huong
Non and Expansion of NH No.32 section from Co Tiet to Trung
Ha Bridge
34
Expansion of NH No.1 section Km2118+600 - Km2127+320,75
and Bypass construction for NH No.1 section Soc Trang City
35
Rehabilitation of NH No.20 section
Km268+000 in Lam Dong province
36
Upgrading of Phap Van- Cau Gie road
10
11
12
13
14
15
16
17
Upgrading of Ho Chi Minh road (NH No.14) section
No.38 bridge - Dong Xoai village in Binh Phuoc
province
Expansion of NH No.1 section Km597+549-Km605
and Km617-Km641 in Quang Binh province
Upgrading of Ho Chi Minh road (NH No.14) section
Pleiku (Km1610) - No. 110 bridge (Km1667+570) in
Gia Lai province
Upgrading of Ho Chi Minh road (NH No.14) section
Km1738+148 - Km1763+610 in Dak Lak
Expansion of NH No.1 section Km791A+500Km848+875 in Thua Thien Hue province
38
39
Expansion of NH No.1 section Km1642 - Km1692 in
Binh Thuan province
Expansion of NH No.1 section Km1374+525 Km1392 and section Km1405 - Km1425+500
40
41
18
Expansion of NH No.1 section Km1488-Km1525 in
Khanh Hoa province
42
19
Construction of a new Viet Tri bridge passing Lo river
NH No.2
43
20
Expansion of NH No.1 section Can Tho - Phung Hiep
44
21
Expansion of NH No.1 section Hanoi - Bac Giang
45
22
23
24
Expansion of NH No.1 section Km1125-Km1153 in
Binh Dinh province
Upgrading of NH No.19 section Km17+027 Km50+00 and section Km 108+00 - Km131+300
Expansion of NH No.1 section Km1063+877 Km1092+577 in Quang Ngai province
Construction of Hoa Lac - Hoa Binh road and Upgrading NH
No.6 section Xuan Mai - Hoa Binh
Construction of Thai Nguyen -Cho Moi road and Upgrading NH
No.3 section Km75 - Km100
Construction of Thai Ha bridge passing Hong river connecting
Thai Binh and Ha Nam provinces to Cau Gie expressway, Phase 1
Upgrading NH No.10 section Quan Toan bridge to Nghin bridge
in Hai Phong City.
Construction of Viet Tri - Ba Vi bridge connecting NH No.32 to
NH No.32C in Hanoi City and Phu Tho province
Upgrading NH No.38 section connecting NH No.1 to NH No.5 in
Bac Ninh and Hai Duong provinces
46
47
48
Upgrading NH No.18 section Bac Ninh - Uong Bi
Table 1b. List of investigated factors.
No.
Name of Factor
Unit
No.
Name of Factor
Unit
-
9
Planned construction time
Month
Yes/No
10
Actual construction time in months
Month
No. of site
location
11
Total planned cost (PC)
Mil. USD
1
No. of provinces
2
New
construction
involvement
3
Site dispersion
4
GDP Per Capital
USD
12
PC by Government
Mil. USD
5
Experiences
of
management unit
Year
13
PC by Investor
Mil. USD
6
Experiences
investor
Year
14
PC by Loan
Mil. USD
7
Project length
Km
15
Cost modified status
Yes/No
8
No. of investors
Total construction time Delay
Month
of
-
-
Construction of Deo Ca tunnel NH No.1 in Phu Yen and Khanh
Hoa province
Bypass of NH No.1 and road surface improvement section Cai
Lay village of Tien Giang province
Construction of Bypass section Ninh Hoa Village and Upgrading
NH No.26 section Km3+411- Km11+504 and section Km91+383
- Km98+800
Construction of NH No.38 section from Yen Lenh bridge to Vuc
Vong intersection
Upgrading NH No.10 section from La Uyen bridge to Tan De
bridge and Bypass of Dong Hung village
37
Construction of My Loi bridge at Km34+826 (NH
No.50) in Long An and Tien Giang provinces
Km123+105,17
206
Transport and Communications Science Journal, Vol. 70, Issue 3 (09/2019), 201-213
It should be noted that although various cost-related factors are collected, not all of them
are potential influenced factors of total construction time delay. In particular, total planned
cost and its dividends including PC by government, PC by Investor and PC by Loan are
mainly to provide a rough picture of project scopes as well as the involvement of private
sectors in projects. These factors are mainly used for descriptive and statistical group analyses
to provide a general understanding of the investigated projects.
3. ANALYSES
Descriptive Analyses
Characteristics of investigated factors are summarized in Table 2. As can be seen from
the table, in average, BOT projects are involved in more than a province with nearly a haft of
them having new construction package as well as a separation of site locations. The average
GDP per capital of the investigated provinces are more than 2000 USD indicating a medium
income of the citizen. Investors and management units are all experienced in doing their jobs,
in which management units have an average of more than 10 years in project management and
investors averagely have more than 20 years doing investment work. With an approximate of
35 km long per project, it is observed that each project has nearly two investors and
approximately 111 million USD of the total investment cost. In addition, the cost modification
is not rare among the investigated projects. Finally, in average, the projects are 4 months
behind their schedules, making a note on the project delay situation of the BOT projects.
Table 2. Investigated factors
N
Minimum
Maximum
Mean
Std. Deviation
No. of provinces
48
1.00
2.00
1.27
.45
New construction involvement
48
.00
1.00
.40
.49
Site dispersion
48
1.00
2.00
1.33
.48
GDP Per Capital
48
1030.00
4196.00
2099.36
803.54
Experiences of management unit
48
6.00
19.00
10.85
2.95
Experiences of investor
48
2.00
49.00
20.79
14.58
Project length
48
2.00
145.00
35.85
27.84
No. of investors
47
1.00
4.00
1.79
.88
Planned construction time
47
9.00
95.00
27.15
14.00
Actual construction time
47
13.00
86.00
31.04
13.95
Total planned cost (PC)
48
19.73
887.48
111.23
125.24
PC by Government
48
.00
236.77
7.91
35.32
PC by Investor
48
2.96
119.68
15.67
16.89
PC by Loan
48
16.77
531.02
87.66
79.08
Cost modified status
48
.00
1.00
.33
.48
Total construction time delay
47
-22.00
61.00
3.89
13.46
207
Transport and Communications Science Journal, Vol. 70, Issue 3 (09/2019), 201-213
In addition, Pearson correlation analyses showed that there are significant associations
between experiences of investors and planned construction time (coefficient = -.294;
Sig.2tailed = .045); GDP per capital and actual construction time (coefficient = .416;
Sig.2tailed = .004); and GPD per capital and project length (coefficient = .302; Sig.2tailed =
.037). A significant correlation between total construction time delay and planned
construction time is also observed (coefficient = -.484; Sig.2tailed = .001). It should be noted
that although there are insignificant correlations, the relationship trends between investigated
factors and total construction time delay are reasonable. In particular, delay increases when
there is an involvement of new construction or there is a greater experience of management
units and/or investors as well as a greater number of investors. And delay decreases when
there is a lower number of involved provinces and/or site locations.
Statistical group analyses
With an aim to explore some investment trends, group comparison analyses have been
conducted. Results of independent sample T-test analyses are presented in Table 3.
Table 3 showed that there is a significant difference in the means of planned investment
cost by loan between two groups of GDP. Project locations having GDP per capital higher
than 2000 USD will attract a higher loan from borrowers. A similar phenomenon is also
observed in term of project length. In particular, projects with more than 25km road length
receive a higher loan from borrowers.
Table 3. Group comparison by factors
By GDP per capital (Group 1 ≥ 2000 USD, Group 2 < 2000 USD)
Levene's Test
t-test for Equality of Means
95% Confidence
F
Sig.
t
df
Sig. (2-
Mean
Std. Error
Interval of the
tailed)
Difference
Difference
Difference
Lower
PC by Loan
4.33
.04
(Mil.USD)
Upper
2.31
46.00
.03
50.72
21.91
6.61
94.83
2.16
24.33
.04
50.72
23.52
2.21
99.23
By Project length (Group 1 ≥ 25 km, Group 2 < 25 km)
Levene's Test
t-test for Equality of Means
95% Confidence
F
Sig.
t
df
Sig. (2-
Mean
Std. Error
Interval of the
tailed)
Difference
Difference
Difference
Lower
PC by Loan
(Mil.USD)
3.53
.07
Upper
2.18
46.00
.03
50.82
23.30
3.92
97.72
2.99
36.71
.00
50.82
16.98
16.41
85.23
208
Transport and Communications Science Journal, Vol. 70, Issue 3 (09/2019), 201-213
Multilayer Perceptron Analyses
A multilayer perceptron analysis has been conducted to examine the relationship between
total construction time delay and its covariates. There are seven covariates considered for
analysis including experiences of management units, experiences of investors, cost modified
status, number of investors, site dispersion (i.e., number of site locations), number of
provinces and involvement of new construction (i.e., a new road section is built). These
factors are selected in a nature that they are factors those can be controlled in the project
preparation phase and that they potentially affect the project schedule in the construction
phase. In a belief that a longer construction schedule has a higher probability of delay due to a
longer exposed time for uncertainty, the planned construction time is considered as an
influenced factor. As results, with 90% of the cases for training and 10% of the cases for
testing, the model showed a good predicting ability with a 2.8% of incorrect prediction. A
summary of the model is presented Table 4; the network information is presented in Table 5;
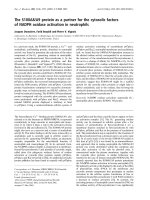
and the importance of covariates in predicting the dependent variable is presented in Figure 2.
Table 4. Model summary
N
Sample
Percent
Training
36
90.0%
Testing
4
10.0%
40
100.0%
Valid
Excluded
8
Total
Training
48
Cross Entropy Error
8.438
Percent Incorrect Predictions
2.8%
1 consecutive step(s) with no decrease in errora
Stopping Rule Used
Testing
Cross Entropy Error
10.651
Percent Incorrect Predictions
75.0%
Dependent Variable: Delay; a. Error computations are based on the testing sample.
Table 5. Network information
Input Layer
Factors
1
Planned construction time in months
Covariates
1
Experiences of management unit
2
Experiences of investor
3
Modified status
4
No. of investors
5
Site dispersion
6
New construction involvement
7
No. of provinces
Number of Unitsa
26
209
Transport and Communications Science Journal, Vol. 70, Issue 3 (09/2019), 201-213
Rescaling Method for Covariates
Hidden Layer(s)
Number of Hidden Layers
1
Number of Units in Hidden Layer 1
Activation Function
Output Layer
Standardized
Dependent Variables
a
22
Hyperbolic tangent
1
Delay
Number of Units
20
Activation Function
Softmax
Error Function
Cross-entropy
a. Excluding the bias unit
As observed in Figure 2, number of investors, experiences of management unit and number of
provinces are top three strongest factors affecting the total construction time of the
investigated BOT road projects. The following-up strong factors are the involvement of new
construction, number of site locations and experiences of investors. The weakest factors are
status of cost modification and planned construction time.
Figure 2. The importance of factors toward total construction time delay
4. DISCUSSION
Motivated by a belief that a good preparation can lead to a positive outcome, this study
aims to examine impacts of various influenced factors of the project preparation phase on the
total construction time of a BOT road project. Of the Vietnam context, acting as the first study
focusing on identifying the risk of construction delay soon at the preparation phase, findings
based on analyses of a large number of BOT road projects showed several important
contributions to the practice of Vietnam.
First, it is found that more experienced investors tend to require a shorter project
210
Transport and Communications Science Journal, Vol. 70, Issue 3 (09/2019), 201-213
completion time. Other finding of this study, however, showed that a shorter planned
construction time is associated with a longer construction time delay. This can be seen as a
trade-off case where investors absolutely can set a long planned construction time to eliminate
delays. It is however not their desire because they want to shorten the construction phase to
proceed to the operation phase. This implies that a delay should be viewed in a trade-off scale
and thus it is not always negative.
Second, GDP per capital should be a referred factor when making investment activities
because the factor was found significantly positively associated with planned construction
time and project length. In other words, project scope and construction time tend to be higher
in a more developed location. Project managers should be aware of this for a better estimation
of construction time which may consequently contribute to a change from a negative delay
status to a positive delay status and vice versa.
Third, the statistically differences in loan amount between groups of GDP per capital and
between groups of project length indicated that borrowers (e.g., commercial banks) have a
more positive belief on a success of a project located in equal-or-more 2000 USD-GDP-percapital area as well as a success of an equal-or-longer-than-25km project. This is probably
because travellers in more developed area may have a higher willingness to pay for road
usage, thus contributing to a faster payback for BOT investors. Similarly, a larger project
scope may indicate a more important project thus more users are going to use the project and
this therefore guarantees the project success.
Fourth, results of multilayer perceptron model showed that the top three most influenced
factors on total construction time delay are number of investors, experiences of management
unit and number of provinces. With two out of top three factors are related to number of
stakeholders, it is suggested that there is probably an issue of interest conflict among
stakeholders [31] or a lack of a good coordination between stakeholders [18,32]. As such,
future projects should focus on the problem of interest conflict as well as the coordination
between stakeholders. Selecting a management unit with a good experience profile should
also be important in reducing construction time delay.
5. CONCLUSIONS
Being the first study considering factors causing construction delay at the preparation
phase, based on analyses of 48 BOT transport projects, this study has contributed to the
literature several important findings, especially in Vietnam context. First, there are needs to
consider a trade-off between total planned construction time and its delays, and a reasonable
construction time estimation respectively to project scope and level of development of project
area. And that, project capital is likely more secured by borrowers in equal-or-longer-than25km project length and/or equal-or-more 2000 USD in GDP per capital of project area.
Notably, project managers should focus on issues of interest conflict, of coordination between
stakeholders and experiences of management units because they are the top strongest
211
Transport and Communications Science Journal, Vol. 70, Issue 3 (09/2019), 201-213
influenced factors of the preparation phase toward total completed construction time delay of
the investigated projects. Future studies should address some limitations of this study
including a limited number of investigated projects and the reliability of data provided by
various interviewees.
REFERENCES
[1] X. Zhang, Critical success factors for public–private partnerships in infrastructure development, J.
Constr. Eng. Manag., 131 (2005) 3–14.
[2] N. Agarchand, B. Laishram, Sustainable infrastructure development challenges through ppp
procurement process: Indian perspective, Int. J. Manag., 10 (2017) 642-662.
/>[3] R.L.K. Tiong, Comparative study of bot projects, J. Manag. Eng., 6 (1990) 107–122.
[4] R.L.K. Tiong, Competitive advantage of equity in bot tender, J. Constr. Eng. Manag., 121 (1995)
282–289. />[5] K.C. Iyer, M. Sagheer, Hierarchical structuring of ppp risks using interpretative structural
modeling, J. Constr. Eng. Manag., 136 (2010) 151–159.
[6] M. Sohail, D.A.C. Maunder, D.W.J. Miles, Managing public transport in developing countries:
stakeholder perspectives in Dar es Salaam and Faisalabad, Int. J. Transp. Manag., 2 (2004) 149–160.
[7] X. Jin, G. Zhang, Modelling optimal risk allocation in PPP projects using artificial neural
networks, Int. J. Proj. Manag., 29 (2011) 591–603.
[8] M.P. Abednego, S.O. Ogunlana, Good project governance for proper risk allocation in public–
private partnerships in Indonesia, Int. J. Proj. Manag., 24 (2006) 622–634.
[9] E. Reeves, D. Palcic, D.Flannery, R.R. Geddes, The determinants of tendering periods for ppp
procurement in the UK: an empirical analysis, Appl. Econ., 49 (2017) 1–12.
[10] F.M. Liou, C.P. Huang, Automated approach to negotiations of BOT contracts with the
consideration of project risk, J. Constr. Eng. Manag., 134 (2008) 18–24.
[11] J. Yuan, A.Y. Zeng, M.J. Skibniewski, Q. Li, Selection of performance objectives and key
performance indicators in public–private partnership projects to achieve value for money, Constr.
Manag. Econ., 27 (2009) 253–270. />[12] M. Dunn-Cavelty, M. Suter, Public–private partnerships are no silver bullet: an expanded
governance model for critical infrastructure protection, Int. J. Crit. Infrastruct. Prot., 2 (2009) 179–187.
[13] S.H. Bhuiyan, A crisis in governance: urban solid waste management in Bangladesh, Habitat
International, 34 (2010) 125–133.
[14] O.M. Rouhani, H.O. Gao, R.R. Geddes, Policy lessons for regulating public–private partnership
tolling schemes in urban environments, Transp. Policy, 41 (2015) 68–79.
[15] S.O.Babatunde, S. Perera, L. Zhou, C. Udeaja, Barriers to public private partnership projects in
developing countries, Eng. Constr. Archit. Manag., 22 (2015) 669–691.
[16] K. Gidado, PFI implementation and evaluation model for developing economics: example of
Nigeria. Proceeding of the 2010 International Conference on Engineering, Project, and Production
Management, Pingtung, Taiwan, 14-15, 2010 available at: www.ppml.url.tw/EPPM/conference/2010
212
Transport and Communications Science Journal, Vol. 70, Issue 3 (09/2019), 201-213
[17] A.P.C. Chan, P.T.I. Lam, D.W.M. Chan, E. Cheung, Y. Ke, Potential obstacles to successful
implementation of public -private partnerships in Beijing and the Hong Kong special administrative
region, Journal of Management in Engineering, 26 (2010) 30-40.
[18] E. Akampurira, D. Root, W. Shakantu, Stakeholder perceptions in the factors constraining the
development and implementation of public private partnerships in the Ugandan electricity sector,
Journal of Energy in Southern Africa, 20 (2009) 2-9.
[19] T. Quoc Cuong, Policy analysis for improving performance of PPP projects in Vietnam: A Case
Study from BOT Phu My Bridge Project, Published master thesis, TU Delft, Delft University of
Technology, 2010.
[20] H. T. T. Giang, Public-Private Partnerships: Development of road infrastructure in Vietnam,
Published PhD thesis, University of Transport & Communications and Transport, Vietnam, 2012.
[21] L. A. Tuan, Principal factors for Private Public Partnership (PPP) implementation in Vietnam: a
mixed methods study, Published PhD thesis, University of Technology Sydney, 2016.
[22] The government inspectorate of Vietnam, Report on regulation implementation of BT, BOT
contracts in transport section in Hanoi city, No. 1785/TB-TTCP, 2017.
[23] The government inspectorate of Vietnam, Report on regulation implementation of BT, BOT
contracts in transport section in Ho Chi Minh city, No. 2242/TB-TTCP, 2017.
[24] The government of Vietnam, Report on PPP implementation results, No.25/BC-CP, 2019.
[25] Than Thanh Son, A study on risk allocation under PPP scheme for road infrastructure of Vietnam,
Doctoral dissertation, University of Transport & Communications, Vietnam, 2015.
[26] T. Liu, Y. Wang, S. Wilkinson, Identifying critical factors affecting the effectiveness and
efficiency of tendering processes in Public–Private Partnerships (PPPs): A comparative analysis of
Australia and China, International Journal of Project Management, 34 (2016) 701–716.
[27] B. Gültekin Çetiner, Murat Sari, Oğuz Borat. A Neural Network Based Traffic-Flow Prediction
Model, Mathematical and Computational Applications, 15 (2010) 269-278.
[28] Concepcion Garrido, Rocio de Ona, Juan de Ona, Neural networks for analyzing service quality
in public transportation, Expert Systems with Applications, 41 (2014) 6830-6838.
/>[29] V. Tu. Jack, Advantages and disadvantages of using artificial neural networks versus logistic
regression for predicting medical outcomes, Journal of Clinical Epidemiology, 49 (1996) 1225-1231.
[30] J. S. R. Jang, C. T. Sun, E. Mizutani, Neuro-fuzzy and soft computing, Prentice Hall, USA, 1997.
[31] A. Akintoye, C. Hardcastle, M. Beck, E. Chinyio, D. Asenova, Achieving best value in private
finance initiative project procurement, Construction Management and Economics, 21 (2003) 461-470.
/>[32] R. Lamech, S. Kazim, What international investors look for when investing in developing
countries: results from a survey of international investors in the power sector, Energy and Mineral
Sector Board. Discussion Paper No. 6, The World Bank, Energy and Mining Sector Board,
Washington, DC, 2003.
213