Assessing the molecular diversity in groundnut (Arachis hypogaea L.) genotypes using microsatellite-based markers
Bạn đang xem bản rút gọn của tài liệu. Xem và tải ngay bản đầy đủ của tài liệu tại đây (386.68 KB, 11 trang )
Int.J.Curr.Microbiol.App.Sci (2019) 8(9): 983-993
International Journal of Current Microbiology and Applied Sciences
ISSN: 2319-7706 Volume 8 Number 09 (2019)
Journal homepage:
Original Research Article
/>
Assessing the Molecular Diversity in Groundnut (Arachis hypogaea L.)
Genotypes Using Microsatellite-Based Markers
Hasanali Nadaf1*, G. Chandrashekhara, B.N. Harish Babu1 and D.L. Savithramma1,2
1
Department of Genetics and Plant Breeding, University of Agricultural and
Horticultural Sciences Shivamogga, India
2
Department of Genetics and Plant Breediing, University of Agricultural Sciences
Bengaluru, India
*Corresponding author
ABSTRACT
Keywords
Groundnut, DNA
extraction, PCR
amplification,
molecular diversity,
SSRs, dendrogram,
polymorphic
information content,
Jaccard’s similarity
coefficient
Article Info
Accepted:
15 August 2019
Available Online:
10 September 2019
Groundnut (Arachis hypogaea L.) production is constrained by a myriad of biotic and
abiotic stresses which necessitate the development and use of superior varieties for
increased yield. Germplasm characterisation both at the phenotypic and molecular
level becomes important in all plant breeding programs. The aim of this study was to
characterise groundnut genotypes at molecular level using simple sequence repeats
(SSR). A total of 30 SSR markers were screened and 20 were found to be polymorphic
with an average polymorphic information content (PIC) value of 0.57. Of the 66
groundnut genotypes studied, 57% showed very close relationship (~80% similarity)
with one or more genotypes among themselves. The remaining 43% of the groundnut
genotypes were distant from each other and could therefore serve as effective parental
material for future work. In this study, the SSRs were found to be quite discriminatory
in discerning variations between and among groundnut genotypes even where the
level of variation was low. Microsatellite based markers therefore represent a useful
tool for dissecting genetic variations in most of the cultivated crops, especially in
groundnut.
Introduction
Application of molecular markers in plant
breeding has established the need for
information on varieties in DNA sequence
even in those crops where little genetic and
cytogenetic information is available; DNA
markers provide a reliable means of estimating
the genetic relationship between genotypes
compared to morphological markers (Gepts,
1993). But, their application in groundnut
enhancement is lagging behind because of
limited knowledge of its genome.
Subrahmanyam et al. (2000) selected 70
genotypes exhibiting variation for several
morphological, physiological and other
characters and studied polymorphism using
random amplified polymorphic DNA (RAPD)
assay wherein only seven out of 48
983
Int.J.Curr.Microbiol.App.Sci (2019) 8(9): 983-993
oligonucleotide primers were polymorphic.
Out of total 408 bands, 27 (6.6%) bands were
polymorphic. Dwivedi et al. (2001) selected
26 accessions and 8 primers for random
amplified polymorphic DNA assay to
determine genetic diversity. The genetic
similarity (Sij) was ranged from 59.0 to 98.8
per cent with an average of 86.2 per cent. Both
multidimensional scaling and unweighted pair
group method with arithmetic averages
(UPGMA) dendrogram revealed the existence
of five distinct clusters. Some accessions with
diverse DNA profile (ICG 1448, 7101, 1471,
99106 and 99014) were identified for mapping
and genetic enhancement in groundnut. Raina
et al. (2001) used 71 random and 29 SSR
primers to assess genetic variation and interrelationships among sub-species and botanical
varieties of cultivated groundnut. They
reported that 42.7 and 54.4 per cent
polymorphism from RAPD and SSR primers,
respectively. Also the dendrogram based on
RAPD, ISSR and RAPD + ISSR data
precisely organized the five botanical varieties
of two sub-species into five clusters and
established phylogenetic relationships among
cultivated groundnut and Arachis wild species.
Sohaib Roomi et al. (2014) studied molecular
diversity of seventy accessions of Arachis
hypogaea using 30 SSRs. Fifteen out of thirty
primers generated polymorphic bands. The
number of polymorphic loci detected was
ranged from 2 to 4 per primer, with an average
of 2.6 loci per primer. All accessions were
then divided into six clusters at 0.67
coefficient of similarity. Xiaoping Ren et al.
(2014) evaluated 196 peanut (Arachis
hypogaea L.) cultivars of China using one
hundred and forty-six polymorphic simple
sequence repeat (SSR) markers, which
amplified 440 polymorphic bands with an
average of 2.99, and the average gene
diversity index was 0.11. A model-based
population structure analysis divided these
peanut cultivars into five subpopulations (P1a,
P1b, P2, P3a and P3b).
For molecular characterization of 48 selected
groundnut advanced breeding lines with
different phenotypic attributes, Frimpong et
al., (2015) used 53 simple sequence repeats
(SSR) markers. Out of 53 SSR markers
screened, 25 were found to be polymorphic
among
selected
lines
with
average
polymorphic information content (PIC) of
0.57 and about 33 per cent of the groundnut
genotypes were distant from each other and
therefore can serve as effective parental
material for future breeding work.
Materials and Methods
A total of 66 groundnut genotypes were used
for the molecular diversity analysis using 30
SSRs, DNA isolation of genotypes was carried
out using modified CTAB method as
described below.
Two grams of fresh leaf sample (18-25 days)
was crushed in liquid nitrogen with a pinch of
PVP, then 500 μl of CTAB extraction buffer
was added and crushed finely, extract was
transferred to 2 ml eppendorf tube. Later 500
μl of CTAB extraction buffer was added to
mortar. Now all the leftover extract was
poured into the eppendorf tube, 2-3μl of
mercaptoethnol was added to each tube and
vortexed for better mixing. The mixture was
kept in water bath at 65-70 ºC for 45-60 min.
Mixture was centrifuged at 12000 rpm for 1518min; then slowly the supernatant was
pipetted out into another 2 ml eppendorf tube
and add 500-600 μl of chloform :
isoamylalcohol (24:1) and shaken well;
mixture was centrifuged at 12000 rpm for 20
min. The supernatant was pipetted out to
another 2 ml eppendorf tube and 500μl of
freshly
prepared
phenol:
chloroform:
isoamylalcohol (25:24:1) was added and
mixed thoroughly; then mixture was again
centrifuged at 12000 rpm for 20 min. Aqueous
upper layer was pipetted out to a 1.5 ml
eppendorf tube, to this 500-600μl of chilled
984
Int.J.Curr.Microbiol.App.Sci (2019) 8(9): 983-993
isopropanol was added and kept for overnight
at -20˚C. Next day tubes were shaken well and
centrifuged at 14000 rpm for 20-25min. A
pellet formation at the bottom of tube was
noticed and the supernatant was discarded; the
pellets were added with 50-100 μl of 70%
ethanol (freshly prepared) and centrifuged at
12000 rpm for 10-15 min for washing step.
Afterwards ethanol was decanted off and
pellets were kept for drying for 4-5 hr. After
drying, 30-50μl of 1x TE buffer was added by
looking at the size of the pellet and stored at 20˚C (Hostington et al., 1997).
contamination and effectively deciphered
molecular diversity in groundnut crop as cited
by different groundnut researchers in the last
one decade.
dNTPs: The four dNTPs viz., dATP, dCTP,
dGTP and dTTP were obtained from private
firm.
Taq DNA polymerase: Taq DNA polymerase
and 10x Taq assay buffer were obtained from
private firm.
Preparation of master mix for PCR
Polymerase chain reaction was carried out
as follows
Requirements for polymerase chain reaction
SSR primers: A total of 30 SSR primers
(Table 1) used for the present investigation
were synthesized by a private firm. The basis
for selection of these SSR primers was that,
they have shown association with foliar
disease resistance, tolerance to aflatoxin
Master-mix was prepared by mixing different
components in the proportion as shown below,
and master mix was distributed to each tube
(9μl/tube) and 1μl of template DNA from each
genotype was added to make the final volume
10μl. After completion of the PCR, the
products were stored at - 40˚C until the gelelectrophoresis was done.
Components of PCR master mix as given below:
Sl. No
1
2
3
4
5
6
Components
10x Assay buffer
dNTPs (2 mM)
Primer (5 pM)
Taq DNA Polymerase
Nano-pure water
DNA template
Total
Quantity
(μl/tube)
2
1
2
0.33
3.67
1
10
Steps followed in PCR reaction are described as follows:
Sl. No
Step
1
2
3
Denaturation
Annealing
Primer extension
4
Final extension
Temperature
(ºC)
94
45-65
72
72
Duration/cycle
(min)
2
2
3
10
985
No. of
cycles
1
30
1
Int.J.Curr.Microbiol.App.Sci (2019) 8(9): 983-993
Gel-electrophoresis was conducted using
Metaphor-agarose for fine separation of PCR
products procedure followed is described
below.
Metaphor-agarose was used for the separation
of amplified PCR products of high resolution
separation of 20 bp-800 bp DNA fragments. It
can be best used for recovering fragments upto 800 bp. The PCR product was mixed with 2
μl of loading dye (Bromphenol blue) and was
loaded in 4 per cent metaphor agarose gel of
0.5x TAE buffer containing Ethidium bromide
(10 l/100 ml). Gel was run at 90 volts for 3 hr.
The banding pattern in the gel was captured by
using gel documentation system (Uvitech,
Cambridge, England).
The amplified fragments were scored as ‘1’
for presence and ‘0’ for the absence of a band
to generate a binary matrix. Similarity
coefficients were calculated. A dendrogram
was constructed based on similarity
coefficient values using clustering technique
of unweighted pair group arithmetic mean
(UPGMA) using SHAN module of NTSYSpc
version 2.0 (Rohlf, 1998).
Results and Discussion
Totally thirty SSR markers were used to
assess the diversity among the genotypes
under study. Out of 30 SSRs, twenty were
polymorphic and remaining 10 were
monomorphic (Table 2). The polymorphism
percentage for primers ranged from zero (S70)
to 100 per cent (GM-1986) with an overall
average of 74.32 per cent. Number of
amplified fragments ranged from 1 to 6 in a
given SSR primer. On an average 3.15 bands
per primer were amplified. Ten SSR primers
viz., GM-1864, pPGPseq-2F05, GM-1502,
GM-2084, GM-2348, S-03, S-83, S-21, S-70
and pPGSseq19D9 showed monomorphic
bands in all genotypes. The PIC (polymorphic
information content) values were calculated to
identify most polymorphic primer and it
ranged from 0 (GM 1864) to 0.83 (GM-1986)
with mean PIC of 0.57 per primer. The SSR
primer, GM-1986 (0.83) has shown highest
PIC value followed by GM-1991 (0.77) and
PM 35 (0.75).
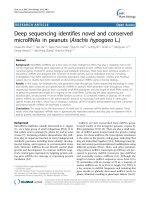
To assess the diversity among the 66
groundnut genotypes Jaccard’s similarity
coefficient was calculated using NTSYSpc v.
2.2 and a dendrogram was generated based on
the unweighted pair-group method with
arithmetic mean (UPGMA) procedure (Figure
1). The mean similarity indices for 66
genotypes was 0.76 with a range 0.37 to 0.98
indicating that accessions had 76 per cent of
their SSR alleles in common. The genotypes
ICGV-15143 and Dh-101 were most diverse
in comparison with other genotypes.
The dendrogram revealed 16 distinct clusters
at similarity coefficient of 0.78. ClusterII
(38) has highest number of genotypes
followed by cluster-III (7), cluster-I (5),
cluster IV
(3) and cluster XIV (2) remaining eleven
clusters were found solitary in nature.
Genotype TMV-2 has similarity coefficient of
0.70 and 0.77 with J-11 and JL-24,
respectively.
Twenty out of the 30 SSR markers (66.67%)
successfully amplified polymorphic fragments
in all the 66 groundnut genotypes tested. The
SSR markers have amplified a total of 74
alleles with an average of 3.15 alleles per
marker. A number of reports on the use of
SSR markers to characterise groundnut have
produced results similar to those obtained in
this study. For example, Mace et al., (2006),
who used 23 SSR primers to study 22
groundnut genotypes with varying levels of
resistance to rust and early leaf spot, recorded
52% polymorphism.
986
Int.J.Curr.Microbiol.App.Sci (2019) 8(9): 983-993
Table.1 Description of the SSR primers used in the experiment
Sl.No
1
2
Primer name
pPGSseq19D9
GM1954
Sequence
F: TGTTGCCCACTGTTCTAATCA
R: TCAAATGGCATAGTCTCCCC
F: GAGGAGTGTGAGGTTCTGACG
No. of base pairs
21
20
22
R: TGGTTCATTGCATTTGCATAC
F: CAGCTTTCTTTCAATTCATCCA
R: CACTTCGTGTTCTTCCTGCTC
F: ACCCTTCTTCTCCACATCCAC
R: GGTTTGGGGCTTAACAGAGAC
F: CAGCCCCTTTCTTTTAATCCA
R: CATTATGAGGGAAGCCAGACA
F: CAATTCATGATAGTATTTTATTGGACA
R: CTTTCTCCTCCCCAATTTGA
F: CTGATGCATGTTTAGCACACTT
R: TGAGTTGTGACGGCTTGTGT
21
22
21
21
22
21
21
27
20
22
20
Reported in groundnut as
Linked to aflatoxin tolerance
Reference
Hong et al., (2009)
Linked to rust resistance
Yol et al.,(2016)
Linked to early leaf spot resistance
Zongo et al.,(2017)
Linked to early leaf spot resistance
Zongo et al.,(2017)
Linked to early leaf spot resistance
Zongo et al.,(2017)
Linked to rust resistance
Mondal and Badigannavar
(2010)
Mondal and Badigannavar
(2010)
3
GM1911
4
GM1883
5
GM1000
6
PM 50
7
PM 179
8
PM 35
F: TGTGAAACCAAATCACTTTCATTC
R: TGGTGAAAAGAAAGGGGAAA
24
20
Linked to rust resistance
Mondal and Badigannavar
(2010)
9
pPGPseq-2B10
Mace et al.,(2006)
pPGPseq-2F05
GM 1502
Linked to late leaf spot and rust
resistance
Molecular diversity studies
Mace et al.,(2006)
11
12
S 84
Molecular diversity studies
Frimpong et al. (2015)
13
GM 2637
Molecular diversity studies
Frimpong et al. (2015)
14
GM 1577
Molecular diversity studies
Frimpong et al. (2015)
15
GM 1937
Molecular diversity studies
Frimpong et al. (2015)
16
GM 1986
20
24
20
24
21
21
24
25
21
23
21
21
21
21
21
21
Linked to late leaf spot resistance
10
F: AATGCATGAGCTTCCATCAA
R: AACCCCATCTTAAAATCTTACCAA
F: TGACCAAAGTGATGAAGGGA
R: AAGTTGTTTGTACATCTGTCATCG
F: TTCCTTTACACACACGCACAC
R: TGGAGGAAATGTAGGGAAAGG
F: CAGCCAATATGTCACAACCCTAAT
R: CTCCCACTACAAATCTCCAATCAAT
F: ATGCTCTCAGTTCTTGCCTGA
R: AAGGAGCCAGCTAGCTACATAGT
F: GCGGTGTTGAAGTTGAAGAAG
R: TAACGCATTAACCACACACCA
F: TTCATCCTCTGCTTCCTTTGA
R: TGACCAAACCCATCATCATCT
F: GCTGCTGCAAGTCTTAAGGAA
R: AAAGTGTCAGGTGCAAAGCAT
Molecular diversity studies
Frimpong et al. (2015)
987
Linked to rust resistance
Frimpong et al. (2015)
Int.J.Curr.Microbiol.App.Sci (2019) 8(9): 983-993
Continued…………
Sl.No
17
Primer name
GM 2084
Sequence
F: CGCAGAAATGAACCGAAATTA
R: GGATGCATTCTTCTTCCTCCT
No. of base pairs
21
21
Reported in groundnut as
Molecular diversity studies
Reference
Frimpong et al. (2015)
18
GM 1991
F: GAAAATGATGCCGAGAAATGT
R: GGGGAGAGATGCAGAAAGAGA
21
21
Molecular diversity studies
Frimpong et al. (2015)
19
GM 2053
F: ACAAGGAAAACCCATCCAATC
R: ACGTGATGGATTCTTGTGGAG
21
21
Molecular diversity studies
Frimpong et al. (2015)
20
GM 1834
F: GAAGCAAGAAACCAACCAAGTC
R: GTGATAAAGCGGCCACAATAG
22
21
Molecular diversity studies
Frimpong et al. (2015)
21
S 93
F: TTGGGGAAATACAGAATAACG
R: CTCCCACATCCCCACCAT
21
18
Molecular diversity studies
Frimpong et al. (2015)
22
GM 2348
F: ACACAAGAACCACCAAAAGCA
R: CAGCGCCATTTCTCAACTATC
21
21
Molecular diversity studies
Frimpong et al. (2015)
23
S 03
F: GCACCAATTTTGTCCCTGAT
R: AAGGGGTTTGCACGTAAATG
20
20
Molecular diversity studies
Frimpong et al. (2015)
24
S 83
F: CTTGAACTTATTTTTGGTGGGTGAAC
R: CAAGGGAGAATGAAGAATGCTAAG
26
24
Molecular diversity studies
Frimpong et al. (2015)
25
S 23
F: CTGGAAGTGGTCCTGTTGGT
R: GCTGCTCCTGTCTCTGGAAT
20
20
Molecular diversity studies
Frimpong et al. (2015)
26
S 21
F: AGTCCTACTTGTGGGGGTTG
R: TCCCTTTTGCAGTGAAATCC
20
20
Molecular diversity studies
Frimpong et al. (2015)
27
S 70
F: CCTTTCCCATTCCATTAGC
R: GTCCGAGTTGAGGAACAACAA
19
21
Molecular diversity studies
Frimpong et al. (2015)
28
S 80
F: GGCGTCCCATTGCTTAC
R: AGAATGCGTTGATGTTATGAA
17
21
Molecular diversity studies
Frimpong et al. (2015)
29
GM 1864
F: CAACACACCCAGTCACTCTCTC
R: TCCTTTCTGATGTTCTGTGTGTG
22
23
Molecular diversity studies
Frimpong et al. (2015)
30
GM 1959
F: GTGTTCTCAGCCATCTTTTCG
R: GTGAAGGTGTTGTGAATGCAG
21
21
Molecular diversity studies
Frimpong et al. (2015)
Note: F: Forward primer; R-Reverse primer
988
Int.J.Curr.Microbiol.App.Sci (2019) 8(9): 983-993
Table.2 Polymorphism of markers used in the present investigation
Sl.
No.
1
2
3
4
5
6
7
8
9
10
11
12
13
14
15
16
17
18
19
20
21
22
23
24
25
26
27
28
29
30
Marker name
GM 1986
GM 1991
PM 35
GM 1577
GM 2053
GM 1959
S 84
GM 1911
GM 2637
GM 1954
GM 1937
S 80
GM 1883
S 93
GM 1834
PM 179
S 23
pPGPseq-2B10
GM 1000
PM 50
GM 1864
pPGPseq-2F05
GM 1502
GM 2084
GM 2348
S 03
S 83
S 21
S 70
pPGSseq19D9
Average
Polymorphic
information content
0.83
0.77
0.75
0.75
0.75
0.75
0.74
0.71
0.69
0.58
0.50
0.50
0.49
0.49
0.44
0.42
0.42
0.40
0.30
0.08
Monomorphic
Monomorphic
Monomorphic
Monomorphic
Monomorphic
Monomorphic
Monomorphic
Monomorphic
Monomorphic
Monomorphic
0.57
989
Polymorphism
(%)
100
100
100
100
25
100
100
100
100
100
100
100
100
100
50
50
50
100
50
50
0
0
0
0
0
0
0
0
0
0
74.32
No. of
Alleles
6
6
4
4
4
4
4
4
4
3
2
2
2
2
2
2
2
2
2
2
2
1
1
1
1
1
1
1
1
1
3.15
Int.J.Curr.Microbiol.App.Sci (2019) 8(9): 983-993
Figure.1 Genetic diversity among 66 groundnut genotypes generated using the unweighted pair group method with arithmetic mean
(UPGMA) procedure based on the Jaccard’s similarity coefficient created with NTSYSpc v. 2.2
990
Int.J.Curr.Microbiol.App.Sci (2019) 8(9): 983-993
In a study with 31 groundnut genotypes that
exhibited different levels of resistance to
bacterial wilt, Jiang et al., (2007) also found
that 29 of the 78 SSR primers were
polymorphic, and amplified a total of 91
polymorphic loci with an average of 2.25
alleles per marker. Similarly, Tang et al.,
(2007) employed 34 SSR markers to
determine the genetic diversity in four sets of
24 accessions from the four botanical
varieties of cultivated groundnut, and found
that 16 primers were polymorphic. This led to
the conclusion that abundant inter-variety
SSR polymorphism exists in groundnut.
indicates the existence of variation for the
traits at molecular level in the groundnut
genotypes used in the present investigation,
and they can be used in QTL mapping, and/or
marker-assisted breeding activities (for
example, marker-assisted backcrossing and
marker-assisted recurrent selection) in
groundnut.
Taken together, the results of this study
demonstrate that SSR markers can be very
effective in discerning variations among the
66 different groundnut genotypes despite their
close relatedness, a finding consistent with
other studies (Cuc et al., 2008; Carvalho et
al., 2010). The mean PIC value of 0.57
suggests that the primers were highly
polymorphic (Pandey et al., 2012) and can be
applied to different groundnut populations in
breeding programs and these findings are in
confirmation with those obtained by
Frimpong et al., (2015).
The PIC values obtained in the present study
have ranged from 0.08 for marker PM-50 to
0.83 for GM-1986, yielding a mean PIC value
of 0.57.These results are in accordance with
Frimpong et al., (2015). Totally 74 bands
were amplified, of which 55 were
polymorphic
yielding
mean
percent
polymorphism of 74.32 %. These results are
in accordance with the study conducted by
Shoba et al., (2010) wherein they assessed the
diversity of 11 groundnut genotypes using 17
SSR markers, recorded 24% polymorphism.
Mondal and Badigannavar (2010) similarly
used 26 SSR primers to amplify 136 bands
and showed that 76.5% were polymorphism
in 20 cultivated groundnut genotypes that
differed in resistance to rust and late leaf spot
disease.
The cluster analysis showed similarity of 38
per cent between genotypes Dh-101 and
ICGV-15143 making them as highly diverse
among present genotypes. This can be
explained by their origin itself, ICGV-15143
is a germplasm accession whereas Dh-101 is
an improved cultivar. Most of the solitary
clusters (9) are ICGV lines except KCG-2 and
VB, which can also be explained by their
origin as all the ICGV lines are germplasm
accessions.
Marker GM1911 (PIC=0.71) in this study,
was reported to be linked with drought
tolerance QTL (Ravi et al., 2011; Gautami et
al., 2012), while markers GM1577
(PIC=0.75) and GM1991 (PIC=0.77) were
reported to be linked with the QTLs
governing tolerance to late leaf spot disease
(Sujay et al., 2012) and these results are in
accordance with Frimpong et al., (2015).
References
Carvalho, M. A., Quesenberry, K. H., and
Gallo,
M.
(2010),
Comparative
assessment of variation in the USA
Arachis pintoi (Krap. and Greg.)
germplasm collection using RAPD
profiling and tissue culture regeneration
ability. Plant Syst. Evol. 288: 245-251.
Cuc, L. M., Mace, E. S., Crouch, J. H.,
Quang, V. D., Long, T. D., and
The
identification
of
polymorphism
associated with these important traits,
991
Int.J.Curr.Microbiol.App.Sci (2019) 8(9): 983-993
Varshney, R. K. (2008), Isolation and
characterization of novel microsatellite
markers and their application for
diversity assessment in cultivated
groundnut (Arachis hypogaea L.). BMC
Plant Biol. 8: 55.
Dwivedi, S. L., Gurtu, S., Charndra, S.,
Yuejin, W. and Nigam, S. N., 2001,
Assessment of genetic diversity among
selected groundnut germplasm RAPD
Analysis. Plant Breeding., 120: 345-349
Frimpong, R. O., Sriswathi, M., Ntare, B. R.
and Dakora, F. D., 2015, Assessing the
genetic diversity of 48 groundnut
(Arachis hypogaea L.) genotypes in the
Guinea savanna agro-ecology of Ghana,
using microsatellite-based markers.
African J. of Biotch., 14(32): 24842493.
Gautami, B., Pandey, M. K., Vadez, V.,
Nigam, S. N., Ratnakumar, P.,
Krishnamurthy, L., Radhakrishnan, T.,
Gowda, M. V. C., Narasu, M. L.,
Hoisington, D. A., Knapp, S. J., and
Varshney, R. K. (2012), Quantitative
trait locus analysis and construction of
consensus genetic map for drought
tolerance traits based on three
recombinant inbred line populations in
cultivated groundnut (Arachis hypogaea
L.). Mol. Breed. 30: 757-772.
Gepts, P., 1993, The use of molecular and
biochemical markers in crop evolution
studies. In: Evolution Any Biology,
Volume 27 (Ed. Hecht), Plenum Press,
New York.
Hostington, D. M., 1997, laboratory protocol
(CIMMYT)
Applied
molecular
Genetics
laboratory
3rd
edition
(CIMMYT) Batur Mexico D E CTI.
Jiang, H., Liao, B., Ren, X., Lei, Y., Mace, E.
S., FU, T., and Crouch, J. H. (2007),
Comparative assessment of genetic
diversity of peanut (Arachis hypogaea
L.) genotypes with various levels of
resistance to bacterial wilt through SSR
and AFLP analyses. J. Genet. Genomics
34: 544-554.
Mace, E. S., Phong, D. T., Upadhyaya, H. D.,
Chandra, S., and Crouch, J. H., 2006,
SSR analysis of cultivated groundnut
(Arachis hypogaea L.) germplasm
resistant to rust and late leaf spot
diseases. Euphytica., 152: 317–330.
Mondal, S., and Badigannavar, A. M., 2010,
Molecular diversity and association of
SSR markers to rust and late leaf spot
resistance in cultivated groundnut
(Arachis hypogaea L.). Plant Breed.,
129: 68-71.
Pandey, M. K., Monyo, E., Ozias-Akins, P.,
Liang, X., Guimaraes, P., Nigam, S. N.,
Upadhyaya, H. D., Janila, P., Zhang, X.,
Guo, B., Cook, D. R., Bertioli, D. J.,
Michelmore, R., and Varshney, R. K.
(2012), Advances in Arachis genomics
for peanut improvement. Biotechnol.
Adv. 30: 639-651.
Raina, S. N., Rani, V., Kojima, T., Ogihara,
Y., Singh, K. P., Devrmath, R. M.,
2001, RAPD and ISSR finger prints an
useful genetic markers for analysis of
genetic diversity, varietal identification
and phylogenetic relationships in peanut
(Arachis hypogaea L.) cultivar and wild
species. Genome., 44: 763-772.
Ravi, K., Vadez, V., Isobe, S., Mir, R. R.,
Guo, Y., Nigam, S. N., Gowda, M. V.
C., Radhakrishnan, T., Bertioli, D. J.,
Knapp, S. J., AND Varshney, R. K.
(2011), Identification of several small
main-effect QTLs and a large number of
epistatic QTLs for drought tolerance
related traits in groundnut (Arachis
hypogaea L.). Theor. Appl. Genet. 122:
1119-1132.
Rohlf, F. J., 1998, NTSYSPC numerical
taxonomy and multivarietal analysis,
Version 2. 0. Applied Biostatics, New
York.
Shoba,
D.,
Manivannan,
N.,
and
Vindhiyavarman, P. (2010), Genetic
992
Int.J.Curr.Microbiol.App.Sci (2019) 8(9): 983-993
diversity
analysis
of
groundnut
genotypes using SSR markers. Electron.
J. Plant Breed. 1: 1420-1425.
Sohaib, R., Bibi, S., Arshad, I., Muhammad,
S., Izhar, M., Muhammad, A., Zia.,
Muhammad, Z. A., Farooq, R., Abdul,
G, and Nabila, T, 2014, SSR based
genetic diversity analysis in a diverse
germplasm of groundnut (Arachis
hypogaea L.) from Pakistan. Australian
J Crop Sci., 8(1): 55-61.
Subrahmanyam, P., Gurtu, S., Nageswara
Rao, R. C. and Nigam, S. N., 2000,
Identification of DNA polymorphism in
cultivated groundnut using random
amplified polymorphism DNA (RAPD)
assay. Genome., 43: 656-660.
Sujay, V., Gowda, M. V. C., Pandey, M. K.,
Bhat, R. S., Khedikar, Y. P., Nadaf, H.
L., Gautami, B., Sarvamangala, C.,
Lingaraju, S., Radhakrishnan, T.,
Knapp, S. J., and Varshney, R. K.
(2012), Quantitative trait locus analysis
and construction of consensus genetic
map for foliar disease resistance based
on two recombinant inbred line
populations in cultivated groundnut
(Arachis hypogaea L.). Mol. Breed. 30:
773-788.
Tang, R., Gao, G., He, L., Han, Z., Shan, S.,
Zhong, R., ZHOU, C., JIANG, J., LI,
Y., AND ZHUANG, W. (2007),
Genetic
diversity
in
cultivated
groundnut based on SSR markers. J.
Genet. Genomics. 34: 449-459.
Xiaoping Ren., Huifang Jiang., Zhongyuan
Yan., Yuning Chen., Xiaojing Zhou., LI
Huang., Yong Lei., Jiaquan HUANG.,
Liying Yan., Yue Qi., Wenhui Wei and
Boshou LIAO, 2014, Genetic Diversity
and Population Structure of the Major
Peanut (Arachis hypogaea L.) Cultivars
Grown in China by SSR Markers. PLoS
ONE., 9(2): e88091.
How to cite this article:
Hasanali Nadaf, G. Chandrashekhara, B.N. Harish Babu and Savithramma, D.L. 2019.
Assessing the Molecular Diversity in Groundnut (Arachis hypogaea L.) Genotypes Using
Microsatellite-Based Markers. Int.J.Curr.Microbiol.App.Sci. 8(09): 983-993.
doi: />
993