báo cáo khoa học: " TILLING for allergen reduction and improvement of quality traits in peanut (Arachis hypogaea L.)" pdf
Bạn đang xem bản rút gọn của tài liệu. Xem và tải ngay bản đầy đủ của tài liệu tại đây (4.22 MB, 13 trang )
RESEARCH ARTICLE Open Access
TILLING for allergen reduction and improvement
of quality traits in peanut (Arachis hypogaea L.)
Joseph E Knoll
1,2
, M Laura Ramos
1
, Yajuan Zeng
1
, C Corley Holbrook
2
, Marjorie Chow
3
, Sixue Chen
3
,
Soheila Maleki
4
, Anjanabha Bhattacharya
1
and Peggy Ozias-Akins
1*
Abstract
Background: Allergic reactions to peanuts (Arachis hypogaea L.) can cause severe symptoms and in some cases
can be fatal, but avoidance is difficult due to the prevalence of peanut-derived products in processed foods. One
strategy of reducing the allergenicity of peanuts is to alter or eliminate the allergenic proteins through
mutagenesis. Other seed quality traits could be improved by altering biosynthetic enzyme activities. Targeting
Induced Local Lesions in Genomes (TILLING), a reverse-genetics approach, was used to identify mutations affecting
seed traits in peanut.
Results: Two similar copies of a major allergen gene, Ara h 1, have been identified in tetraploid peanut, one in
each subgenome. The same situation has been shown for major allergen Ara h 2. Due to the challenge of
discriminating between homeologous genes in allotetraploid peanut, nested PCR was employed, in which both
gene copies were amplified using unlabeled primers. This was followed by a second PCR using gene-specific
labeled primers, heteroduplex formation, CEL1 nuclease digestion, and electrophoretic detection of labeled
fragments. Using ethyl methanesulfonate (EMS) as a mutagen, a mutation frequency of 1 SNP/967 kb (3,420 M
2
individuals screened) was observed. The most significant mutations identified were a disrupted start codon in
Ara h 2.02 and a premature stop codon in Ara h 1.02. Homozygous individuals were recovered in succeeding
generations for each of these mutations, and elimination of Ara h 2.02 protein was confirmed. Several Ara h 1
protein isoforms were eliminated or reduced according to 2D gel analyses. TILLING also was used to identify
mutations in fatty acid desaturase AhFAD2 (also present in two copies), a gene which controls the ratio of oleic to
linoleic acid in the seed. A frameshift mutation was identified, resulting in truncation and inactivation of AhFAD2B
protein. A mutation in AhFAD2A was predicted to restore function to the normally inactive enzyme.
Conclusions: This work represents the first steps toward the goal of creating a peanut cultivar with reduced
allergenicity. TILLING in peanut can be extended to virtually any gene, and could be used to modify other traits
such as nutritional properties of the seed, as shown in this study.
Background
Peanut (Arachis hypogaea L.) is an important source of
oil and protein, and because of their nutritional benefits
and versatility, peanuts and peanut-deriv ed products are
used extensively in processed foods. Unfo rtunately,
reports of allergic reactions to peanuts are becoming
increasingly common, and severe allergic reactions to
peanuts can be fatal [1]. Avoidance is the best strategy
to prevent allergic reactions, but due to the prevalence
of peanuts in food products, avoidance can be difficult.
Even food which does not specifically contain peanut
products, but was processed on equipment also used for
handling peanuts, can still contain significant amounts
of allergens to trigger allergic response in some patients.
Peanuts contain at least 11 potentially allergenic pro-
teins, according to the Internationa l Union of Immuno-
logical Societies (IUIS) [2]. Knocking out the genes
responsible for production of allergenic proteins would
be one strategy for reducing the allergic potential of
pean uts. However, many of these allergens are seed sto-
rage proteins which make up a cons iderable amount
of the total seed protein. Major allergen Ara h 1, for
* Correspondence:
1
Department of Horticulture/NESPAL, University of Georgia-Tifton Campus,
Tifton, GA 31793, USA
Full list of author information is available at the end of the article
Knoll et al. BMC Plant Biology 2011, 11:81
/>© 2011 Knoll et al; licensee BioMed Central Ltd. This is an Open Access article distributed under the terms of the Creative Commons
Attribution L icense (http://cre ativecommons.org/licenses/by/2.0), which permits unrestricted use, distribution, and reproduction in
any medium, provided the original work is properly cited.
example, makes up 12-16% of total seed protein, and
Ara h 2 from 5.9-9.3% [3]. It is unknown how many of
these proteins can be elimin ated without sacrificing
quality or viability, although Chu et al. [4] used trans-
genic silencing to eliminate Ara h 2 and Ara h 6 protein
in peanut seeds, and observed no adverse effects on via-
bility. Though such results are promising, there are
many regulatory obstacles which must be overcome for
a transgenic peanut to be used as food.
Another strategy is to use mutagenesis to knock out
the allergen genes, or possibly to alter the sequences of
major allergenic epitopes in those proteins. This can be
accomplished though TILLING (Targeting Induced
Local Lesions in Genomes), a technique in which a
mutagenized pop ulation can be scr eene d for individuals
carrying mutations in any known gene of interest.
TILLING is a PCR-based technique which relies on
mismatch cleavage by CEL1 nuclease to identify single-
nucleotide or small insertion/deletion mutations. TIL-
LING was init ially developed as a r everse-genetics tool
in the model species Arabidopsis thaliana[5], but has
since been applied to important crop species including
rice (Oryza sativa L.) [6], maize (Zea mays L.) [7], and
soybean (Glycine max (L.) Merr.) [8], to name just a few.
In a previous study we reported the genomic characteri-
zation of the major allergen gene Arah2[9]. Genes encod-
ing the two isoforms, Ara h 2.01 and Ara h 2.02, are
homeologous genes representing ortho logs from diploid
ancestors, most likely A. duranensis (A genome) and A.
ipaensis (B genome). In this study we show that the major
allergen Arah1gene is also present in two copies, each
belonging to separate subgenomes. Gene-specific primers
were develope d to identify mutations in each of the two
Arah1and two Arah2genes through TILLING.
In addition to allergen reduction, seed oil composition
is another quality trait in peanut that could be targeted
using the TILLING approach. Monounsaturated fatty
acids are less prone to oxidation than polyunsaturated
fatty acids, and thus contribute to better f lavor and
longer storage life of peanut oil [10]. In addition, mono-
unsaturated fatty acids are nutritionally desirable, and
are believed to contribute to cardiovascular health. Lino-
leic acid (18:2) is a polyunsaturated fatty acid which
typically makes up around 15-43 % of peanut oil [11]. In
developing seeds it is produced from the monounsatu-
rated oleic acid (18:1) by the action of Δ
12
fatty acid
desaturase (AhFAD2). Two homeologous AhFAD2
genes have been identified in peanut, one originating
from each subgenome, designated AhFAD2A and
AhFAD2B[12]. Reduction in the activity of AhFAD2
increas es the ratio of oleic to linoleic acid, but only one
functioning allele is required to confer a normal oleate
phenotype [13]. Mutations in each of the AhFAD2 genes
were also identified using TILLING.
Results
Determination of Gene Copy Numbers, and Gene-Specific
Amplification
Prior to TILLING in a polyploid such as peanut it is
necessary to determine the copy number and perform the
molecular characterization of any gene of interest, because
most genes exist in multiple copies. Co-amplification o f
multiple homologo us sequences would likely result in an
excessive number of fragments on TILLING gels, and dif-
ficulty in identification of mutations. Also when a muta-
tion is identified, it is necessary to know which gene copy
has been altered. In peanut, which is an allotetraploid,
genes encoding the two isoforms of Ara h 2 are homeolo-
gous, representing orthologs from diploid ancestors [9].
The open reading frames of t hese two g enes are highly
similar, with the major difference being an in-frame inser-
tion of 36 bp in Arah2.02, resulting in an insertion of
12 amin o acids containing an extra copy of the seque nce
DPYSPS, a known allergenic IgE-binding epitope [14, 15].
Gene-specific primer pairs yielded amplicons of 1,280 bp
for Ara h 2.01 and 1,227 bp for Arah2.02(Table 1). Each
primer pair amplified only one band of expected size from
the A- or B-subgenome, and also from the putative pro-
genitors A. duranensis and A. ipaensis, respectively [16].
Furthermore, the specific amplification was confirmed by
sequence analysis (data not shown).
Prior to designing PCR primers for Ara h 1, two geno-
mic clones of Ara h 1 were found in GenBank. The first
accession [GenBank : AF432231] was reported by Viq uez
et al. [17] and is identical to the c DNA sequence of
accession L34402 whose encoded protein i s designated
Ara h 1.0101 by IUIS [2] (isoform Ara h 1.01). A second
genomic clone [GenBank: AY581852] was reported by
Li et al. [18] and is nearly identical to accession L38853
Table 1 Summary of amplicon sizes and frequencies of
mutations identified by TILLING in two different EMS
treatments
Amplicon Screened 0.4% EMS/
12 hr.
1.2% EMS/
4.5 hr.
Total
Gene bp No. of Mutations:
Ara h 1.01 2211 2011 2 2 4
Ara h 1.02 1666 1466 1 0 1
Ara h 2.01 1278 1078 7 2 9
Ara h 2.02 1226 1026 2 3 5
Ah FAD2A 1228 1028 5 0 5
Ah FAD2B 1221 1021 3 0 3
Total: 8830 7630 20 7 27
Plants
Screened:
2441 979 3420
kb/SNP: 931 1067 966
For number of bp screened, 200 bp is subtracted to adjust for the 100-bp
regions at the top and bottom of TILLING gel images that are difficult to
analyze.
Knoll et al. BMC Plant Biology 2011, 11:81
/>Page 2 of 13
whose protein is referred to by Chassaigne et al. [19] as
isoform 2. For clarity we will refer to this isoform as
Ara h 1.02 even though this is not an official IUIS desig-
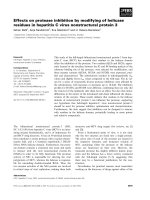
nation. PCR amplification using primers 1306 and 1307
(Table 2) produced two PCR products appearing as a
doublet on agarose gel (2,241 bp for Arah1.01,and
2,031 bp for Arah1.02; Figure 1). Amplicons from
gene-specific PCR were 2,211 bp for Arah1.01and
1,666 bp for Ara h 1.02 (Figure 1; Table 1). Analysis of
Ara h 1 PCR product s from A. hypogaea and its diploid
progenitors showed the presence of both genes in
A. hypogaea, but only one copy in each diploid. The pri-
merpairspecifictoArah1.01(1306/1308; Table 2)
amplified only in A. hypogaea and A. ipaensis (B gen-
ome), while the primer pair specific to Arah1.02
(1306/1309; Table 2) amplified only in A. hypogaea and
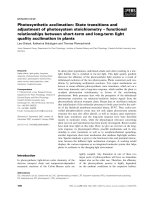
A. duranensis (A genome; Figure 1). Using the known
sequence information, Southern blot analysis of genomic
DNA from A. hypogaea was carried out to confirm that
no additional copies of Arah1arepresentinthepea-
nut genome. Genomic DNA digested with HindIII,
which has no cut sites within either gene, yielded two
nearly overlapping fragments of approximately 6.5 kb
each when probed with a full-length Ara h 1.01 probe
(PCR product of primers 1306/1308). DNA was also
digested with EcoRI, which has one cut site in each copy
of Ara h 1. Southern blot analysis revealed four frag-
ments, two from each homeolog, as expect ed. Lastly, the
DNA was cut with AseI, which cuts Arah1.01(two
adjacent cut sites within the second intron), but not Ara
h1.02. As expected, three fragments were produced
(Figure 2). EcoRI-digested plasmids carrying either Ara
h1.01or Ara h 1.02 were also loaded as controls; the
probe recognized both copies of the gene (data not
shown).
Another target for TILLING, the Δ
12
-fatty acid desa-
turase gene AhFAD2 has been characterized in studies
by Jung et al. [12], López et al. [20], and Patel et al. [21].
This gene is also present in two copies, one in each sub-
genome of A. hypogaea. T he gene sequences are highly
conserved between the two, except for an insertion of
Table 2 PCR primers used in this study.
Primer no. Description Sequence (5’-3’)
813 5’ Ara h 2 GGAGTGAAAAAGAGAAGAGAATA
817 3’ Ara h 2 TCAAGATGGTTACAACTCTGCAGCAACA
815 5’ Ara h 2.01 CGATTTACTCATGTACAATTAACAATAGAT
816 5’ Ara h 2.02 ATCACCTTAAATTTATACATATTTTCGG
371 3’ Ara h 2 CAGCAACAAAACATAGACAACGCC
1306 5’ Ara h 1 GAGCAATGAGAGGGAGGGTT
1307 3’ Ara h 1 CCTCCTTGGTTTTCCTCCTC
1308 3’ Ara h 1.01 TTCTCAGGAGACTCTTTCTCAGG
1309 3’ Ara h 1.02 CCTCCTCTTCTTCCCACTCTTG
1048 3’ AhFAD2 CTCTGACTATGCATCAG
1055 5’ AhFAD2A GATTACTGATTATTGACTT
1101 5’ AhFAD2B CAGAACCATTAGCTTTG
1458 3’ AhFAD2 CAGAACTTGTTCTTGTACCAATAAACACC
1459 5’ AhFAD2B TCAGAACCATTAGCTTTGTAGTAGTGC
1460 5’ AhFAD2A GATTACTGATTATTGACTTGCTTTGTAG
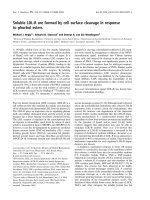
Figure 1 PCR amplification of Ara h 1 isoforms on 1% agarose
gel. Lane 1: DNA size standard. Lanes 2-5: primers 1306/1307
amplify both isoforms of Ara h 1. Lanes 6-9: primers 1306/1308
amplify only Ara h 1.01. Lanes 10-13: primers 1306/1309 amplify only
Ara h 1.02.GG=A. hypogaea cv. Georgia Green, Ad = A. duranensis
(A genome), Ai = A. ipaensis (B genome), -ve = negative control.
Figure 2 Southern blot analysis of Ar a h 1 in A. hypogaea cv.
Georgia Green. The blot was probed with a full-length genomic
fragment of Ara h 1.01, which was PCR-amplified from a plasmid,
then labeled with
32
P. Lane 1: Genomic DNA digested with HindIII
(no sites within either gene). Lane 2: Genomic DNA digested with
EcoRI (one site in each gene). Lane 3: Genomic DNA digested with
AseI (two adjacent cut sites in Ara h 1.01 (B-genome), but none in
Ara h 1.02 (A-genome)).
Knoll et al. BMC Plant Biology 2011, 11:81
/>Page 3 of 13
19 bp in AhFAD2A (or a deletion in AhFAD2B), 80 bp
upstream of the start codon. Gene-specific primer
sequences utilizing this indel produce amplicons nearly
identical in size: 1,228 bp for AhFAD2A and 1,221 bp
for AhFAD2B (Table 1).
Peanut TILLING Populations and Mutation Frequencies
Several populations were created using ethyl methane-
sulfonate (EMS) and one with diethylsulfate (DES). The
concentration of mutagen and time of treatment were
selected from preliminary experiments that gave 30%-
50% seed germination. From the DES-treated M
2
popu-
lation, 352 plants were screened for all six genes, and no
mutations were detected. Two EMS mutagenesis treat-
ments were tested in this study, 1.2% for 4.5 h and 0.4%
for 12 h. A total of 3,420 EMS-treated M
2
plants were
screened, each for all six genes (7,630 bp/plant; Table
1). Twenty-seven SNPs were detected and confirmed.
The overall mutation frequency fo r EMS was 1 SNP/9 67
kb. For 1.2% EMS at 4.5 h, the mutation rate was 1
SNP/1,067 kb (979 plants). The mutation frequency for
0.4% EMS for 12 h was slightly higher at 1 SNP/931 kb
(2,441 plants), although this difference probably is not
signi ficant. Most of the nucleotide changes were G to A
or C to T, as expected for EMS-induced transitions.
Several unusual mutations were found in AhFAD2A and
AhFAD2B, which may not be the result of the EMS
treatment (Table 3). If that is the case, then the average
mutation frequency would be 1 SNP/1186 kb.
Ara h 2 Mutations
In total, nine SNPs were identified in Arah2.01,and
five in Arah2.02. The first two amino-acid changes
identified were in Arah2.01in lines 20-6 (L 49 F) and
37-4 (R 55 H; Table 3) . Line 37-4 actually h ad two
nucleotide changes in this gene, but one of them was
silent. These two mutations were confirmed in the M
3
and M
4
generations using TILLING. DNA from M
3
or
M
4
individuals was analyzed both alone and mixed with
wild type DNA. Homozygotes were identified when
SNPs were detected in mixed samples but not in the
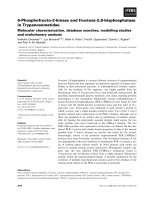
corresponding unmixed samples. Homozygous mutants
allowed the testing of IgE binding on the altered pro-
teins from seed extracts. Total protein extracts from
homozygous M
4
lines of 20-6 and 37-4 were normalized
for loading equal amoun ts of Ara h 2.01, as measured
by anti-Ara h 2 chicken polyclonal antibody, and were
tested for binding to serum from four patients with pea-
nut hypersensitivity (HW, DAM, CM, and NF). The
IgE-immunoblot showed no differences between the
native Ara h 2.01 present in the peanut cultivar Georgia
Green (GG) [22] and t he Ara h 2.01 allelic variants
detected by TILLING in lines 20-6 and 37-4 (Figure 3).
Although the mutations were generated in cultivar
Tifrunner [23] there is no difference between the Ara h
2.01 proteins of these two cultivars.
Four more silent mutations were found in Ara h 2.01,
one of which is identical to the silent mutation in line
37-4. One other amino ac id change (A 82 T) was also
identified in Ara h 2.01. Three amino acid changes were
identified in Arah2.02, but two of them (D 70 N) are
identical (Table 3). This change occurs in the second
DPYSPS motif, which is a known allergenic epitope
[14,15]. The third amino acid change (R 62 Q) also lies
within an allergenic ep itope, just before the first
DPYSPS motif (Additional File 1). Because homozygous
seed has not yet been recovered, the ability of these
mutant proteins to bind IgE has not yet been tested,
although these look to be promising candidates for
reduced allergenicity of Ara h 2.02. A G to A mutation
Table 3 Mutations identified by TILLING in this study
Treatment:0.4% EMS for 12 hr.
Gene Nucleotide
Change
Predicted AA
Change
Population Plant
ID
Ara h 2.01 C145 ® T L49 ® F 05 20-6
Ara h 2.01 G164 ® A R55 ® H 05 37-4
Ara h 2.01 G192 ® A silent 05 37-4
Ara h 2.01 G186 ® A silent 07G 78-4
Ara h 2.01 C80 ® T silent 07G 90-4
Ara h 2.01 G357 ® A silent 07JKEMS1 65
Ara h 2.01 G186 ® A silent 08GH 250
Ara h 2.02 G185® A R62 ® Q 07G 89-5
Ara h 2.02 G3 ® A disrupted start
codon
08GH 2
Ara h 1.01 C1392® T R333 ® W 07G 95-1
Ara h 1.01 C586 ® T silent 07JKEMS1 99
Ara h 1.02 C304 ® T R102 ® Stop 07JKEMS1 133
AhFAD2A A448 ® G N150 ® D 05 4-3
AhFAD2A A448 ® G N150 ® D 05 55-4
AhFAD2A A448 ® G N150 ® D 05 138-
10
AhFAD2A C718 ® T silent 07G 113-5
AhFAD2A C761 ® T P254 ® L 07JKEMS1 72
AhFAD2B A442 insertion frameshift 05 69-8
AhFAD2B A442 insertion frameshift 07G 81-4
AhFAD2B
C566 ® T
silent 07JKEMS1 2
Treatment:1.2% EMS for 4.5 hr.
Gene Nucleotide
Change
Predicted AA
Change
Population Plant
ID
Ara h 2.01 G243 ® A A82 ® T 06EF 13-6
Ara h 2.01 G192 ® A silent 06LREMS1 8-4
Ara h 2.02 G208 ® A D70 ® N 06EF 23-7
Ara h 2.02 G208 ® A D70 ® N 06EF 26-1
Ara h 2.02 G -315 ® A upstream,
probably silent
06EF 62-6
Ara h 1.01 C1609 ® T P405 ® L 06EF 53-3
Ara h 1.01 G1704 ® A E437 ® K 06EF 56-3
Knoll et al. BMC Plant Biology 2011, 11:81
/>Page 4 of 13
was also found 315 bp upstream of the start codon of
Ara h 2.02; however, it does not appear to be located
within any important promoter elements.
Lastly, a G to A transition was identified in the start
codon of Arah2.02. A downstream ATG is out of
frame, and so a protein knockout was expected. Two
M
3
seeds were recovered, a small chip was taken from
each for protein analysis, and the seeds were planted.
Both seeds grew into phenotypically normal plants.
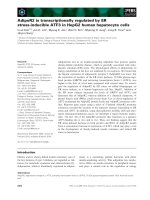
SDS-PAGE analysis of the seed protein extracts con-
firmed that one of the seeds was indeed missing the 21
kD band which represents the Ara h 2.02 protein [9],
and was thus homozygous for the mutation (Figure 4A).
The other seed appeared to have a reduced quantity of
Ara h 2.02; DNA sequence analysis (data not shown)
confirmed that this plant was a heterozygote. Western
blot analysis (Figure 4B) also confirmed the absence of
Ara h 2.02 protein in the homozygous mutant. Further
analysis with 2-D difference gel electrophoresis (2-D
DIGE) confirmed that both of the Ara h 2.02 isoforms,
shown to differ by a two amino acid truncation at the
carboxy terminus [24], were missing in the homozygous
mutant line (Figure 4C).
Ara h 1 Mutations
In the longest amplicon, Ara h 1.01 (2,211 bp), signals
from both IRDye channels sometimes were not visible
on Li-Cor gels due to background and fragment length,
but SNPs identified from single-channel signals were
later verified by sequencing. Four mutations have been
confirm ed in Arah1.01(Table 1). One of these, a C to
T transition at bp position 593, is silent, but the other
three are predicted to induce amino acid changes: R 333
W, P 405 L, and E 437 K (Table 3; Additional File 2).
Theargininetotryptophanchangeatposition333lies
within epitope 12 [25]. Only one mutation was con-
firmed in Ara h 1. 02; a premature sto p codon is
produced at bp position 304 by a C to T mutation. This
is expected to result in a truncated protein of 102
amino acids (Line 133; Additional File 2). All four of
these non-silent mutations have been confirmed in the
M
3
generation by TILLING. A CAPS (cleaved amplified
polymorphic sequence) marker was developed to detect
the Ara h 1.02 truncation mutant in succeeding genera-
tions. The wild-type amplicon contains six BslIsites,
one of which is deleted in the mutant. This marker was
used to identify a homozygous mutant in the M
4
gen-
eration (Figure 5).
Both Ara h 1 proteins appear as a thick band of
approximately 63.5 kD on SDS-PAGE [26]. Although
the two genes encode proteins of slightly different sizes,
we were unable to resolve both of them with one-
dimensional electrophoresis. Thus, 2D SDS-PAGE and
2D-DIGE were attempted to confirm the absence of the
protein in seeds of the homozygous Arah1.02trunca-
tion mutant. From the 2-D PAGE and 2-D Western blot
(Additional File 3) it was not possible to resolve only
two distinct Ara h 1 isoforms, an expected result based
on published 2-D gel analyses for Ara h 1 [19]. Multiple
post-translational protein modifications (i.e. various
cleavage products or glycosylation) are produced from
the two isoforms of Ara h 1. However, there was a defi-
nite difference in the relative Cy3 (wild-type) and Cy5
(mutant) signal intensities for the group of spots in the
pI range of 5.9-6.4 representing Ara h 1. From these
data it is not possible to conclude that the Ara h 1.02
isoform has been completely eliminated. However, quan-
titative analysis of the 2-D DIGE mutant and wild-type
gels showed that the intensities of three pI 5.9-6. 0 spot s
representing Ara h 1 (Figure 6A, spots 474, 482, 485)
were reduced 2.4-2.6-fold in the mutant, but others with
ahigherpIappearedtoincrease (1.5-3.5-foldTable 4),
although these isoforms were less abundant than the
lower pI isoforms in both wild-type and mutant. Also,
Figure 3 IgE binding analysis of seed protein ext racts from M
4
generation of Ara h 2.01 mutant lines 20-6 and 37-4. A - Equal amount
of total protein from seeds of wild type (Georgia Green; Lane 1), mutant line 37-4 (Lane 2), and mutant line 20-6 (Lane 3) loaded on SDS-PAGE
stained with Coomassie blue. B - IgE inmunoblot performed with serum from patients with peanut hypersensitivity (HW, DAM, CM, and NF).
Lane numbers are the same as in panel 4A.
Knoll et al. BMC Plant Biology 2011, 11:81
/>Page 5 of 13
spots 482 a nd 485/491 which appear as dou blets in the
wild-type (Figure 6B) appear as single spots in the
mutant (Figure 6C), suggesting that several protein pro-
ducts have indeed been eliminated in the mutant.
AhFAD2 Mutations
One silent mutation was found in each of AhFAD2A and
AhFAD2B, and one predicted amino acid change (P 254
L) was found in AhFAD2A. All three of these mutations
were C to T transitions, typical for EMS-induced muta-
tions. Several mutations were also identified in these
genes which were not typical: an A-insertion, observed
twice in AhFAD2B, and three identical A to G mutations
in AhFAD2A (Table 3). These are unusual for EMS-
induced mutations, but it is perhaps the location and
frequency of these mutations which is most intriguing.
The A-insertion in AhFAD2B occurs 442 bp after the
start codon, causing a frameshift, and likely resulting in a
truncated protein due to a premature stop codon (line
81-4; Additional File 4). This mutation was identified in
two different M
2
plants in our TILLING populations.
Using a CAPS marker [27], this mutation has been
shown to be stably inherited in the M
3
generation derived
from one of our TILLING mutants (data not shown). In
AhFAD2A, three different M
2
plants were found to con-
tain the same mutation, an A to G transi tion at 448 bp
Figure 4 Analysis of seed protein extracts from Ara h 2.02 knockout mutant.A-CoomassiebluestainedSDS-PAGE of seed protein
extracts, with equal amounts of total protein loaded in each lane. Lane wt: wild type (Tifrunner). Lane 1: homozygous mutant. Lane 2:
heterozygote. B - Western blot of seed protein extracts using anti-Ara h 2 antibodies, which recognize both isoforms of the allergen. Antibodies
also recognize Ara h 6. Lane wt: wild type (Tifrunner). Lane 1: homozygous mutant. Lane 2: heterozygote. C - 2D DIGE analysis of seed protein
extracts from wild-type (Tifrunner) labeled with Cy3 (green) and Ara h 2.02 knockout mutant labeled with Cy2 (red). The white box denotes the
four spots representing Ara h 2 isoforms.
Knoll et al. BMC Plant Biology 2011, 11:81
/>Page 6 of 13
after the start codon. This is predicted to change the
amino acid at position 150 from asparagine to aspartic
acid (line 4-3; Additional File 4).
Discussion
In TILLING populations of diploids such as sorghum
(Sorghum bicolo r (L.) Moench) [28] and Lotus japonicus
[29], phenotypic mutants were frequently observed. In
contrast, very few phenotypic mutations were observed
in field or greenhouse-grown M
2
peanut plants in this
study, most likely due to genetic buffering caused by
polyploidy, similar to that observed in TILLING popula-
tions of tetraploid and hexaploid wheat (Triticum aesti-
vum L.) [30]. In EMS-mutagenized hexaploid wheat, a
mutation frequency of 1 SNP/24 kb has b een reported,
and 1 SNP/40 kb was reported in tetraploid wheat [30].
The mutation rate observed in this study on peanut is
much lower than that reported for wheat and lower
than Arabidopsis (1 SNP/~300 kb [4]), or most legumes
including soybean (1 SNP/140-550 kb depending on
treatment [8]), and pea (Pi sum sativum L.; 1 SNP/669
kb [31]; 1 SNP/200 kb [32]). It is similar to or higher
than that in some populations of barley (Hordeum vul-
gare L.; 1 SNP/2500 kb [33], 1 SNP/1000 kb [34]) and
Figure 5 Identification of Ara h 1.02 truncation mutant by
CAPS marker analysis. A - Primers 1306/1309 were used to
amplify Ara h 1.02 from M
3
individuals. PCR products were cut with
BslI and then separated on 2% agarose gel. Lane 1: DNA size
marker. Lane 2: wild-type control (Tifrunner). Lanes 3-7: individual
M
3
plants. The 293 bp fragment indicates presence of the mutant
allele. The homozygous mutant (Lane 6) lacks the 230 bp fragment.
B - Diagram of the amplified fragment of Ara h 1.02. Vertical lines
represent BslI cut sites. The cut site denoted in red is eliminated by
the mutation.
Figure 6 2D DIGE analysis of Ara h 1.02 truncation mutant. Protein extracted from seeds of homozygous wild-ty pe (Tifrunner) was labeled
with Cy3 (green), and seed protein from Ara h 1.02 truncation mutant was labeled with Cy5 (red). Labeled proteins were separated by 2-D DIGE
with a pI range of 5.3-6.5. Region of 2-D gel where most Ara h 1 protein separates is shown in detail. A - Two-color image. Wild-type protein is
green; mutant protein is red. B - Single-color image of wild-type protein only. C - Single-color image of mutant protein.
Knoll et al. BMC Plant Biology 2011, 11:81
/>Page 7 of 13
rice (1 SNP/1000 kb [35]). As with barley and rice,
mutation density potentially could be improved by using
alternate genotypes, treatment conditions, or choice of
mutagens [6,36]. No mutations were detected in the
DES-mutagenized population, even though this chemical
was used to recover a high oleic acid mutant of pea nut
[37]. In the present study, an incubation time of 4.5 h at
a concentration of 0.25% was substantially different
from that used by Moore [37] (15 min at 1.5%). With
the longer incubation time of 4.5 h, no germination
occurred at a concentration greater than 0.5%.
The IgE-immunoblot showed no differences between
the wild-type Ara h 2.01 and the Ara h 2.01 allelic
variants detected by TILLING in lines 20-6 and 37-4
(Figure 3), despite the fact that both of these changes
affect known IgE epitopes [14,15]. Although a reduction
in IgE binding was not detected with these two allelic
variants, it has been shown that a small change in this
protein can indeed have this desired effect. In a recent
study Ramos et al. [38] identified a naturally occurring
variant (a serine to threonine change at position 73) in
an accession of A. duranensis that showed 56-99%
reduction in IgE binding compared to wild-type Ara h
2.01. The arginine to tryptophan change at position 333
in Ara h 1.01 lies within epitope 12 [25]. Although it is
unlikely that this residue is critical for IgE binding [25],
and the other two amino acid changes do not reside
within known epitopes, the possibility of reduced IgE
affinity cannot be completely ruled out until these pro-
teins are tested.
The Ara h 1.01 and Arah1.02genes code for pro-
teins with predicted sizes of 71.3 and 70.3 kD, respec-
tively, but the mature proteins extracted from seeds
appear as a single 63.5 kD band on SDS-PAGE [26].
The N-terminal amino acid sequence of the purified
proteins does not match the predicted N-terminal
sequence; rather it is located 78 or 84 amino acids
downstream, depending on the isoform [39,40]. These
first 78 or 84 amino acids, along with an included 25
amino acid signal peptide, are cleaved off during post-
translational processing. The 53 or 59 amino acid
cleaved peptides contain six of the seven cysteines
found in Ara h 1 isoforms [40] and three of the aller-
genic epitopes [41], and are hypothesized to form disul-
fide bridges conferring a stable conformation similar to
plant antifungal peptides [40]. In our Ara h 1.02 trunca-
tion mutant, the truncation occurs downstream of the
cleavage site potentially leaving the cleaved peptide
intact. It remains to be seen whether the cleavage pro-
duct is still produced and stable in seeds of the mutant.
A previously described mutant allele of AhFAD2B
contains an A-insertion 442 bp after the start codon,
causing a frameshift, and likelyresultsinatruncated
protein due to a premature stop co don [20]. This
mutant allele has been reported previously in multiple
independently derived cultivars which have a high oleic
to linoleic acid ratio (high O/L), most likely due to the
inactivity of AhFAD2B [27]. The same mutation was
identified in two different M
2
plants in our TILLING
populations. It is possible that this m utant allele is pre-
sent at a low frequency in the source seed for the TIL-
LING population, although these seed were produced
before extensive breeding for the high O/L trait was
initiated in the USDA-ARS program. Furthermore, inde-
pendent generation of this mutant allele has been
reported in China and the U.S. [27]. Even more surpris-
ing, three different M
2
plants were found to contain a
reversion to the wild-type allele of AhFAD2A, an A to G
transition at 448 bp after the start codon, whereas the
TILLING population parent, ‘Tifrunner’, possesses the
mutant allele. This reversion is predicted to change the
amino acid at position 150 from asparagine to aspartic
acid and restore functionality to the desaturase enzyme.
In most runner-type peanut cultivars, the AhFAD2A
protein is presumed to be inactive due to the presence
of the asparagine residue at position 150 [42]. The
aspartic acid residue is likely an important component
of the active site of the enzyme and is highly conserved
among fatty acid desaturases from other plants,
including A. duranensis,fromwhichAhFAD2A likely is
derived[13].Basedonasurveyofthemini-coreofthe
U.S. peanut germplasm coll ection, Chu et al. [42] found
that the aspartic acid residue also appears to be con-
served among Spanish and Valencia market types of
peanut, but the inactive allele was found to be common
(75%) among Virginia and Runner market-types. In our
three independent TILLING mutants, the asparagine
has been mutated back to aspartic acid, most likely
restoring the function of AhFAD2A. In a recombinant
AhFAD2A protein with the aspartic acid restored at
position 150 by site-directed mutagenesis, Bruner et al.
[43] showed that its full function is indeed restored.
Table 4 Change in abundance of Ara h 1 protein
isoforms in homozygous truncation mutant, relative to
wild-type
Spot
No.
pI Mass
(kD)
Max
Volume
Volume
Ratio
Abundance
474 5.90 56,559 1,596,575 -2.57 Decreased
482 5.96 56,281 2,763,712 -2.40 Decreased
485 6.02 56,147 1,360,494 -2.67 Decreased
491 6.04 56,052 1,480,757 -1.27 Similar
501 6.10 55,805 639,866 1.55 Increased
505 6.18 55,745 827,950 1.53 Increased
517 6.28 55,488 338,574 1.51 Increased
530 6.35 55,220 270,914 3.00 Increased
553 6.42 54,463 131,587 3.57 Increased
(Spot numbers correspond to Figure 6.)
Knoll et al. BMC Plant Biology 2011, 11:81
/>Page 8 of 13
Both the frequency and the nature of these two muta-
tions are atypical of mutations induced by EMS, includ-
ing the other mutations observed in this study. It is
unclear whether these mutations are due to the EMS
treatment, outcrossing, or genetic impurity in the start-
ing seed, but the latter appears to be the most likely
explanation. If that is the case, then assessment of
geneticpurityatspecificlocimaybeanotherusefor
mismatch-based mutation detection.
Conclusions
These experiments represent the initial steps toward the
development of a hypoallergenic peanut. Because genetic
variation for allergens is limited in cultivated peanut,
mutagenesis is necessary to generate variation. We have
shown that TILLING is a useful technique for screening
mutagenized populations of peanut for induced changes in
allergen genes. When multiple seed storage proteins with
reduced IgE binding are identified, o r more knockout
mutations are found, the next step will be a concerted
breeding effort to combine these mutant alleles into one
plant. TILLING, CAPS markers, or a more efficient SNP
assay can be used as tools to track the inheritance of these
alleles in the breeding process. TILLING in peanut can be
extended to virtually any gene, and could be used to assist
in the modification of other traits such as disease resis-
tance, stress tolerance, early maturity, or as shown in this
study, nutritional properties of the seed.
Methods
Southern Blot Analysis of Ara h 1
DNA for Southern blot analysis was isolated from young
leaves of peanut (Arachis hypogaea L.) cv. Georgia
Green [22] using the DEAE-cellulose-based technique of
Sharma et al. [44]. Twenty micrograms of purified geno-
mic DNA was digested overnight with AseI, EcoRI, or
HindIII, and was then loaded on a 0.7% agarose gel and
electrophoresed in TBE buffer at 45 V for approximately
nine hours. EcoRI-digested pCR-4 TOPO plasmids (Invi-
trogen, Carlsbad, CA) carrying either Ara h 1.01 or Ara
h1.02(clones derived from PCR products using primer
pairs 1306/1308 and 1306/1309, respectively; Table 2)
were also loaded in adjacent lanes as positive controls.
The DNA was transferred to Genescreen Plus nylon
membrane (Perkin-Elmer, Boston, MA) overnight using
the alkaline transfer method [45]. The membrane was
probed with a full-length genomic fragment of Ara h
1.01, which was PCR-amplified from a plasmid carrying
the fragment. The probe was labeled with a
32
P-dCTP
using the Random Primed DNA Labelling Kit (Roche,
Indianapolis, IN). Unincorporated label was removed
using Sephadex G-50 (Sigma, Saint Louis, MO). Hybri-
dization and washing conditions were as described by
Sambrook and Russell [45]. The final wash was carried
out at 65°C for 15 min. in 0.5 × SSC buffer (75 mM
NaCl, 7.5 mM sodium citrate, pH 7.0) with 0.1% SDS.
The blot was visualized by exposure to a Storage Phos-
phor Screen (Amersham Biosciences, Piscataway, NJ)
which was then scanne d using a Storm 840 imaging
system (Amersham Biosciences).
Mutant Peanut Populations
Ethyl methanesulfonate (EMS) or diethylsulfate (DES)
treatments were used to induce mutations in the peanut
cultivar ‘ Tifrunner’ [23]. Seeds were imbibed in tap
water for 10-12 hour s. The tap water was then replaced
with aqueous solution of mutagen. Three mutagen treat-
ments were tested: 0.4% EMS for 12 h, 1.2% EMS for 4.5
h, or 0.25% DES for 4.5 h. Seeds were soaked in the
mutage n solution in 2L Fernbach flasks on a rotary sha-
ker, and were then washed t hree times in deionized
water. (Washes were collected for d isposal). The seeds
were then rinsed in running water overnight. The M
1
seeds were planted in the field, and one pod was har-
vested from each plant to generate an M
2
population.
M
2
seeds were planted in either the field or greenhouse,
and M
3
seed was harvested from them to create perma-
nent TILLING populations.
The entire population will not be distributed because
of limited seed availability, although screening for speci-
fic mutant genes and distribution of individual lines is
possible.
DNA Isolation and Quantification for TILLING
Young leaf tissue was collected from individual M
2
plants, frozen using liquid nitrogen, and either stored at
-80°C or lyophilized directly in 96-well collection plates.
It was then ground into powder by vortexing with three
to four 3-mm stainless-steel grinding balls in 2-ml flat-
bottom microcentrifuge tubes, or using a GenoGrinder
2000 (OPS Diagnostics LLC, Bridgeview, NJ), set at 500
strokes/min for 20 sec (liquid nitrogen-frozen tissue), or
1 min (lyophilized tissue). Genomic DNA was extracted
using the DNeasy 96 Plant Kit (Qiagen Inc. USA, Valen-
cia, CA) according to the manufacturer’sinstructions.
The DNA was quantified by fluorometry using either
PicoGreen (Invitrogen, Carlsbad, CA) or Hoechst 33258
dye in a FluoroCount (Packard/Perkin-Elmer, Waltham,
MA) microplate reader. Samples of purified DNA were
also run on agarose gel to verify quality. Individual DNA
samples were diluted to a working concentration of 5 ng/
μl. Individual DNA sampl es wer e then four-fold pooled
in 96-well format. For verification of individual mutants,
genomic DNA from ‘Tifrunner’ was used as the control.
Primer Design and PCR
Since Ara h 2 genes are small and without introns, dif-
ferences in the upstream regions of these two genes
Knoll et al. BMC Plant Biology 2011, 11:81
/>Page 9 of 13
were used to design gene-specific primers for TILLING
(Primers 815 and 816). Based o n the available sequence
information in GenBank, primers 1306 and 1307 were
designed to amplify both copies of Ara h 1. Indels near
the 3’ end of the open reading frame allowed us to
design gene-specific primers 1308 (Ara h 1.01) and 1309
(Ara h 1.02). Primer sequences 1055 (AhFAD2A)and
1101 (AhFAD2B) utilize the indel 80 bp upstream of the
start codon to amplify one specific gene copy. These
primers are identical to primers aF19 and bF19 used by
Patel et al. [21]. For amplification with IRDye-labeled
primers, longer oligos are preferred, so primers 1458,
1459, and 1460 were designed. All primer sequences
used in this study are shown in Table 2.
Because peanut DNA is highly complex, a first r ound
of unlabeled PCR was used to increase the concentra-
tion of target sequences for subsequent labeled PCR.
Based on available sequence information and suitability
of priming sites, prim ers for the first round of PCR
were designed to amplify both copies of Arah2,both
copies of Arah1, or one specific copy of AhFAD2.The
first PCR was carried out in a 25 μl final volume con-
taining 10 ng gDNA, 0.5 U JumpStart Taq DNA Poly-
merase in 1 × PCR Buffer (Sigma, Saint Louis, MO), 0.2
mM each dATP, dCTP, dGTP and dTTP, and 0.2 μM
each forward and reverse primers, under the following
conditions: 94°C for 1 min; followed by 8 cycles at 94°C
for 35 sec, 58°C for 35 sec (-1°C/cycle), 72°C for 100
sec. The touchdown cycles were followed by 30 cycles
of 94°C for 35 sec, 50°C for 35 sec, 72°C for 100 sec,
with a final extension of 72°C for 7 min. Reactions were
conducted using either a Gene Amp 9700 (Applied Bio-
systems, Carlsbad, CA) or a PTC-200 (MJ Research,
Waltham, MA) thermal cycler.
An aliquot (2 μl) from a 1:40 dilution of the first PCR
product was used as input for a second round of PCR,
carried out in 10 μl final volume with 0.2 mM each
dNTP, 0.25 U ExTaq HS DNA Polymerase (TaKaRa Bio
Inc, Shiga, Japan) with IRDye-labeled primers (MWG
Biotech, Huntsville, AL), designed to specifically amplify
one gene copy. Labeled and unlabeled primers (100 μM
stocks) were mixed into a cocktail in a ratio of 3 parts
IRD-700-labeled 5’ primer: 2 parts unlabeled 5’ primer:
4 parts IRD-800-labeled 3’ primer: 1 part unlabeled 3’
primer. Concentrations of primer cocktail, PCR buffer,
and MgCl
2
were optimized for each individual gene.
Touchdown PCR was conducted in a PTC-200 thermal
cycler (MJ Research, Waltham, MA) as follows: dena-
turation at 95°C for 2 min followed by 6 cycles of 94°C
for 30 sec, 58°C for 30 sec (-1°C/cycle), temperature
ramp +0.5°C/sec to 72°C for 80 sec; then 45 cycles of
94°C for 30 sec, 52°C for 30 sec with a temperature
ramp +0.5°C/sec to 72°C for 80 sec. This was followed
by a final extensio n at 72°C for 7 min. PCR was
immediately followed by the heteroduplex formation
step: denaturation at 99°C for 10 min, 70 cycles of rean-
nealing at 70°C for 20 sec, decreasing 0.3°C/cycle, with a
final hold at 4°C.
Preparation of Celery Juice Extract (CEL1 Nuclease)
Celery juice extract (CJE), containing CEL1 nuclease,
was prepared following the purification protocol from
Till et al. [46] with minor modifications. The endonu-
clease activity and the concentration were tested using a
plasmid nicking assay as follows: 200 ng of circular plas-
mid were incubated with 10 μl of CJE dilution in 1 ×
CELI Buffer (10 mM MgSO
4
,10mMHEPES,10mM
KCl, 0.02% Triton X-100, 0.002% bovine serum albu-
min) in 20 μl final volume. After incubation at 45°C for
15 min, the sample was placed on ice and 10 μlof0.15
M EDTA was added to stop the reaction. The digestion
products were analyzed on 1% agarose gel. The activity
of the CJE was compared with that of Surveyor Nuclease
(Transgenomic, Omaha, N E) on a known mutant,
detected previously by EcoTILLING [38,47].
Mutation Screening
After PCR amplification, samples (5 μl from the second
PCR) were digested in 1 × CEL1 Buffer with 0.03-0.06
μlCJEin10μl total volume, incubated for 15 min at
45°C as described by Till et al. [46]. To stop the reaction
5 μlof0.15MEDTAwasaddedpersample,while
keeping the samples on ice. The samples were cleaned
using Sephadex G-50 (Sigma, Saint Louis, MO), uni-
formly loaded in 96-well MultiScreen-HV filter plates
using a 45-μ l MultiScreen Column Loader (Millipore,
Billerica, MA) following the manufacturer ’ s instructions.
The samples were collected in a catch plate, transferred
to a 96-well PCR plate, and dried in an ISS110 Speed
Vac centrifugal evaporator (Thermo Savant, Milford,
MA). The dried samples were resuspended in 8 μlof
formamide loading buffer (37% formamide, 3.75 mM
EDTA pH 8, 0.0075% bromophenol blue), and then
heated to 80°C for 7 min, and then to 92°C for 2 min
[30]. Samples could then be stored in the dark at 4°C
for several days until analysis. Samples (0.8 μl) were
loaded on 6.5% polyacrylamide gel in 1 × TBE and elec-
trophoresed at 1500 V, 40 mA, 30 W, at 45°C on a Li-
Cor 4300 DNA Analyzer (Li-Cor Biosciences, Lincoln,
NE). Images were visually analyzed for the presence of
cleavage products using Adobe Photoshop (Adobe Sys-
tems,Inc,SanJose,CA)andGelBuddy[48].Putative
mutations were identified by fragments appearing in
both the 700 and 800 channels, with sizes adding up to
that of the full-length PCR product. Because the DNA
was pooled four-fold for initial screening, each of the
four individuals was then screened against wild type
(Tifrunner) to identify the mutant.
Knoll et al. BMC Plant Biology 2011, 11:81
/>Page 10 of 13
Mutations were confirmed by cloning PCR-amplified
genes or gene fragments into the pCR4-TOPO cloning
vector using the TOPO-TA Cloning Kit for Sequencing
(Invitrogen, Carlsbad, CA) according to the manufac-
turer’s instructions, followed by sequencing with M13
forward and reverse primers. Mutation frequency was
estimated as the total number of confirmed mutations
divided by the total number of base pairs screened
[(amplicon size - 200 bp) × individuals screened)]. For
each amplicon, 200 bp is subtracted to adjust for the
100-bpregionsatthetopandbottomofTILLINGgel
images that are difficult to analyze [5].
SDS-PAGE, Western Blots, and IgE-Binding Analysis
Seed protein extraction was carried out as described by
Koppelman et al. [3]. Protein quantification was per-
formed using the Bio-Rad Protein Assay kit (Bio-Rad,
Hercules, CA) and bovine serum albumin (BSA) as the
standard. Ten micro grams of total protein were loaded
per lane and separated in 12% SDS-PAGE gels. The pro-
teins were then electroblotted at 30 V overnight to
PVDF membranes, 0.2 μm (Bio-Rad). The membranes
were blocked with 5% non-fat dry milk in PBS-T (137
mM NaCl, 2.7 mM KCl, 1.4 mM KH
2
PO
4
,4.3mM
Na
2
HPO
4
, 0.1% Tween-20) at room temperatu re for 1 h
with gentle agitation. For Western blot analysis, after
blocking the membrane was probed with chicken anti-
Ara h 2 or anti-Ara h 1 (1:8,000 dilution) primary anti-
bodies for 1 h follow ed by secondary anti-chicken anti-
body-horseradish peroxidase (HRP; 1:100,000; Sigma,
Saint Louis, MO) in PBS-T with 2% non-fat dry milk for
1 h. For IgE binding analysis, sera were obtained from
four indi viduals (HW, DAM, CM, and NF) documented
as allergic to peanuts with either a positive food chal-
lenge or a convincing hist ory of peanut allergy. Sera
from allergic individuals were collected at the University
of Arkansas for Medical Sciences, Little Rock, AR,
approved and in accordance with the rules and regula-
tions of the institutional review board. Blots incubated
with a 1:20 dilution of the four sera were allowed to
hybridize overnight at 4°C. All membranes were washed
three times with PBS-T for 5 min after each antibody
incubation. ECL Plus detection reagents (Amersham
Biosciences) were used for chemifluorescent detection,
followed by scanning on a S torm 840 imaging system
(Amersham Biosciences). For IgE binding analysis, rela-
tive quantification of Ara h 2.01 protein was performed
by densitometry with Quantity One software (Bio-Rad)
and all samples were normalized to the amount of Ara
h 2.01/10 μg of total protein in wild-type. Further IgE
immunoblot analyses were performed using 100 ng of
Ara h 2.01-normalized total protein.
2-D PAGE and DIGE
Suspected homozygous knockout mutants of Ara h 2.02
and Ara h 1.02 were subjected to two-dimensional pro-
tein analyses using difference gel electrophoresis (2-D
DIGE) essentially according to Chu et al. [4]. Labeled
protein samples for analysis of 17-19 kD Ara h 2 (wild-
type - Cy3; mutant - Cy2) were resolved using pI 3-10
immobilized pH gradient (IPG) strips. For analysis of
~65kDArah1,50μg each of Cy3-labeled wild-type,
Cy5-labeled mutant, and Cy2-labeled mixture of wild-
type and mutant protein extracts were mixed and
focused in a 24-cm pH 5.3-6.5 IPG strip at 10,000 V for
121 kVhr before running the second dimension in a
10% Tris-glycine SDS-PAGE gel. Labeled spots were
detected with a Typhoon 9400 Variable Mode Imager
(GE Healthcare) and digital image analysis was con-
ducted with SameSpot Progenesis (Nonlinear Dynamics).
Additional material
Additional file 1: Sequence alignment of Ara h 2.01 and Ara h 2.02
wild-type proteins and predicted proteins from Ara h 2 mutants
identified by TILLING. WT indicates wild-type protein sequence. Mutant
ID numbers are indicated in parentheses.
Additional file 2: Sequence alignment of Ara h 1.01 and Ara h 1.02
wild-type proteins and predicted proteins from Ara h 1 mutants
identified by TILLING. WT indicates wild-type protein sequence. Mutant
ID numbers are indicated in parentheses.
Additional file 3: 2D PAGE and Western blot of Ara h 1.02
truncation mutant. A - Sypro Ruby stained PVDF blots of seed protein
extracts (1.5 mg) from wild-type (Tifrunner) and homozygous Ara h 1.02
truncation mutant. Proteins were first focused in pH 5.3 to 6.5 IPG strips,
then separated in 10% polyacrylamide Tris-glycine gels before
transblotting to PVDF membrane. B - Western blot of membranes in
panel 7A using chicken anti-Ara h 1 antibody (primary) followed by anti-
chicken-HRP conjugate (secondary), and visualized by fluorescence.
Additional file 4: Sequence alignment of AhFAD2A and AhFAD2B
wild-type proteins and predicted proteins from AhFAD2 mutants
identified by TILLING. WT indicates wild-type protein sequence. Mutant
ID numbers are indicated in parentheses.
Acknowledgements
This work was supported by the Consortium for Plant Biotechnology
Research, The Georgia Peanut Commission, the Peanut Foundation, the
National Peanut Board and USDA Specific Cooperative Agre ement 58-6435-
6-050. We thank Evelyn Perry Morgan for technical assistance and Ye Chu for
helpful discussion.
Author details
1
Department of Horticulture/NESPAL, University of Georgia-Tifton Campus,
Tifton, GA 31793, USA.
2
USDA-ARS Crop Genetics and Breeding Research
Unit, Tifton, GA 31793, USA.
3
Interdisciplinary Center for Biotechnology
Research, University of Florida, Gainesville, FL 32611, USA.
4
USDA-ARS
Southern Regional Research Center, New Orleans, LA 70124, USA.
Authors’ contributions
JEK performed Southern blot analysis for Ara h 1 , screened and identified
mutants, and draft ed the manuscript. MLR developed the TILLING protocols
used in this study, prepared celery juice extract, and screened and identified
Knoll et al. BMC Plant Biology 2011, 11:81
/>Page 11 of 13
mutants. AB assisted in screening and identifying mutants. POA was the lead
investigator, generated the mutagenized populations, and also drafted the
manuscript. YZ, MC, and SC performed 2D PAGE and DIGE on the protein
extracts from knockout mutants. SM performed IgE binding analysis on
mutant Ara h 2.01 proteins. CCH assisted in generating, advancing, and
maintaining the mutagenized populations. All authors have read and
approved the manuscript.
Authors’ information
Current addresses:
JEK - USDA-ARS Crop Genetics and Breeding Research Unit, Tifton, GA
31793, USA
MLR - NIDERA S.A., Departamento de Biotecnologia, Venado Tuerto, Santa Fe
CP2600, Argentina
AB - Bench Biotechnology, Vapi, Gujarat, India
Received: 10 January 2011 Accepted: 12 May 2011
Published: 12 May 2011
References
1. Palmer K, Burks W: Current developments in peanut allergy. Curr Opin
Allergy Clin Immunol 2006, 6:202-206.
2. International Union of Immunological Societies: Allergen nomenclature.
[ />3. Koppelman SJ, Vlooswijk RAA, Knippels LMJ, Hessing M, Knol EF, van
Reijsen FC, Bruijnzeel-Koomen CAFM: Quantification of major peanut
allergens Ara h 1 and Ara h 2 in the peanut varieties Runner, Spanish,
Virginia, and Valencia, bred in different parts of the world. Allergy 2001,
56:132-137.
4. Chu Y, Faustinelli P, Ramos ML, Hajduch M, Stevenson S, Thelen JJ, Maleki S,
Cheng H, Ozias-Akins P: Reduction of IgE binding and nonpromotion of
Aspergillus flavus fungal growth by simultaneously silencing Ara h 2 and
Ara h 6 in peanut. J Agric Food Chem 2008, 56:11225-11233.
5. Greene EA, Codomo CA, Taylor NE, Henikoff JG, Till BJ, Reynolds SH,
Enns LC, Burtner C, Johnson JE, Odden AR, Comai L, Henikoff S: Spectrum
of chemically induced mutations from a large-scale reverse-genetic
screen in Arabidopsis. Genetics 2003, 164:731-740.
6. Till BJ, Cooper J, Tai TH, Colowit P, Greene EA, Henikoff S, Comai L:
Discovery of chemically induced mutations in rice by TILLING. BMC Plant
Biol 2007, 7:19.
7. Till BJ, Reynolds SH, Weil C, Springer N, Burtner C, Young K, Bowers E,
Codomo CA, Enns LC, Odden AR, Greene EA, Comai L, Henikoff S:
Discovery of induced point mutations in maize genes by TILLING. BMC
Plant Biol 2004, 4:12.
8. Cooper JL, Till BJ, Laport RG, Darlow MC, Kleffner JM, Jamai A, El-Mellouki T,
Liu S, Ritchie R, Nielsen N, Bilyeu KD, Meksem K, Comai L, Henikoff S:
TILLING to detect induced mutations in soybean. BMC Plant Biol 2008,
8:9.
9. Ramos ML, Fleming G, Chu Y, Akiyama Y, Gallo M, Ozias-Akins P:
Chromosomal and phylogenetic context for conglutin genes in Arachis
based on genomic sequence. Mol Genet Genomics 2006, 275:578-592.
10. St. Angelo AJ, Ory RL: Investigations of causes and prevention of fatty
acid peroxidation in peanut butter. J Am Peanut Res Educ Soc 1973,
5:128-133.
11. Moore KM, Knauft DA: The inheritance of high-oleic acid in peanut.
J Hered 1989, 80:252-253.
12. Jung S, Swift D, Sengoku E, Patel M, Teulé F, Powell G, Moore K, Abbott A:
The high oleate trait in the cultivated peanut (Arachis hypogaea L.) I.
Isolation and characterization of two genes encoding microsomal
oleoyl-PC desaturases. Mol Gen Genet 2000, 263:796-805.
13. Jung S, Powell G, Moore K, Abbott A: The high oleate trait in the
cultivated peanut (Arachis hypogaea L.) II. Molecular basis and genetics
of the trait. Mol Gen Genet 2000, 263:806-811.
14. Stanley JS, King N, Burks AW, Huang SK, Sampson H, Cockrell G, West CM,
Bannon GA: Identification and mutational analysis of the
immunodominant IgE binding epitopes of the major peanut allergen
Ara
h 2. Arch Biochem Biophys 1997, 342:244-253.
15. Schein CH, Ivanciuc O, Braun W: Common physical-chemical properties
correlate with similar structure of the IgE epitopes of peanut allergens.
J Agric Food Chem 2005, 53:8752-8759.
16. Ozias-Akins P, Ramos ML, Chu Y: Hypoallergenic foods beyond infant
formulas. In Food Allergy: Comprehension, Treatment, and Prevention. Edited
by: Maleki S, Burks AW, Helm RM. Herndon, VA: ASM Press; 2006:287-308.
17. Viquez OM, Konan KN, Dodo HW: Structure and organization of the
genomic clone of a major peanut allergen gene, Ara h 1. Mol Immunol
2003, 40:565-571.
18. Li H-G, Wang L, Zhang Y-S, Lin X-D, Liao B, Yan Y-S, Huang S-Z: Cloning
and sequencing of the gene Ahy-β encoding a subunit of peanut
conarachin. Plant Sci 2005, 168:1387-1392.
19. Chassaigne H, Trégoat V, Nørgaard JV, Maleki SJ, van Hengel AJ: Resolution
and identification of major peanut allergens using a combination of
fluorescence two-dimensional differential gel electrophoresis, Western
blotting and Q-TOF mass spectrometry. J Proteomics 2009, 72:511-526.
20. López Y, Nadaf HL, Smith OD, Connell JP, Reddy AS, Fritz AK: Isolation and
characterization of the Δ
12
-fatty acid desaturase in peanut (Arachis
hypogaea L.) and search for polymorphisms for the high oleate trait in
Spanish market-type lines. Theor Appl Genet 2000, 101:1131-1138.
21. Patel M, Jung S, Moore K, Powell G, Ainsworth C, Abbott A: High-oleate
peanut mutants result from a MITE insertion into the FAD2 gene. Theor
Appl Genet 2004, 108:1492-1502.
22. Branch WD: Registration of ‘Georgia Green’ peanut. Crop Sci 1996, 36:806.
23. Holbrook CC, Culbreath AK: Registration of ‘Tifrunner’ peanut. J Plant
Registrations 2007, 1:124.
24. Li JX, Shefcheck K, Callahan J, Fenselau C: Primary sequence and site-
selective hydroxylation of prolines in isoforms of a major peanut
allergen protein Ara h 2. Protein Sci 2010, 19:174-182.
25. Shin DS, Compadre CM, Maleki SJ, Kopper RA, Sampson H, Huang SK,
Burks AW, Bannon GA: Biochemical and structural analysis of the IgE
binding sites on Ara h 1, an abundant and highly allergenic peanut
protein. J Biol Chem 1998, 273:13753-13759.
26. Burks AW, Williams LW, Helm RM, Connaughton C, Cockrell G, Obrien T:
Identification of a major peanut allergen, Ara-H-I, in patients with
atopic-dermatitis and positive peanut challenges. J Allergy Clin Immunol
1991, 88:172-179.
27. Chu Y, Holbrook CC, Ozias-Akins P: Two alleles of ahFAD2B control the
high oleic acid trait in cultivated peanut. Crop Sci 2009, 49:2029-2036.
28. Xin Z, Wang ML, Barkley NA, Burow G, Franks C, Pederson G, Burke J:
Applying genotyping (TILLING) and phenotyping analyses to elucidate
gene function in a chemically induced sorghum mutant population.
BMC Plant Biol 2008, 8 :103.
29. Perry JA, Wang TL, Welham TJ, Gardner S, Pike JM, Yoshida S, Parniske M: A
TILLING reverse genetics tool and a web-accessible collection of
mutants of the legume Lotus japonicus. Plant Physiol 2003, 131:866-871.
30. Slade AJ, Fuerstenberg SI, Loeffler D, Steine MN, Facciotti D: A reverse
genetic, nontransgenic approach to wheat crop improvement by
TILLING. Nat Biotechnol 2005, 23 :75-81.
31. Triques K, Sturbois B, Gallais S, Dalmais M, Chauvin S, Clepet C, Aubourg S,
Rameau C, Caboche M, Bendahmane A: Characterization of Arabidopsis
thaliana mismatch specific endonucleases: application to mutation
discovery by TILLING in pea. Plant J
2007, 51:1116-1125.
32.
Dalmais M, Schmidt J, Le Signor C, Moussy F, Burstin J, Savois V, Aubert G,
Brunaud V, de Oliveira Y, Guichard C, Thompson R, Bendahmane A:
UTILLdb, a Pisum sativum in silico forward and reverse genetics tool.
Genome Biol 2008, 9:R43.
33. Lababidi S, Mejlhede N, Rasmussen SK, Backes G, Al-Said W, Baum M,
Jahoor A: Identification of barley mutants in the cultivar ‘Lux’ at the Dhn
loci through TILLING. Plant Breed 2009, 128:332-336.
34. Caldwell DG, McCallum N, Shaw P, Muehlbauer GJ, Marshall DF, Waugh R:
A structured mutant population for forward and reverse genetics in
barley (Hordeum vulgare L.). Plant J 2004, 40 :143-150.
35. Wu JL, Wu CJ, Lei CL, Baraoidan M, Bordeos A, Madamba MRS, Ramos-
Pamplona M, Mauleon R, Portugal A, Ulat VJ, Bruskiewich R, Wang GL, Leach J,
Khush G, Leung H: Chemical- and irradiation-induced mutants of indica rice
IR64 for forward and reverse genetics. Plant Mol Biol 2005, 59:85-97.
36. Talame V, Bovina R, Sanguineti MC, Tuberosa R, Lundqvist U, Salvi S:
TILLMore, a resource for the discovery of chemically induced mutants in
barley. Plant Biotechnol J 2008, 6:477-485.
37. Moore KM: High oleic acid peanut. U.S. Patent no. 5945578 1999.
38. Ramos ML, Huntley JJ, Maleki SJ, Ozias-Akins P: Identification and
characterization of a hypoallergenic ortholog of Ara h 2.01. Plant Mol Biol
2009, 69:325-335.
Knoll et al. BMC Plant Biology 2011, 11:81
/>Page 12 of 13
39. De Jong EC, van Zijverden M, Spanhaak S, Koppelman SJ, Pellegrom H,
Penninks AH: Identification and partial characterization of multiple major
allergens in peanut proteins. Clin Exp Allergy 1998, 28:743-751.
40. Wichers HJ, de Beijer T, Savelkoul HFJ, van Amerongen A: The major
peanut allergen Ara h 1 and its cleaved-off N-terminal peptide; possible
implications for peanut allergen detection. J Agric Food Chem 2004,
52:4903-4907.
41. Burks AW, Shin D, Cockrell G, Stanley JS, Helm RM, Bannon GA: Mapping
and mutational analysis of the IgE-binding epitopes on Ara h 1, a
legume vicilin protein and a major allergen in peanut hypersensitivity.
Eur J Biochem 1997, 245:334-339.
42. Chu Y, Ramos L, Holbrook CC, Ozias-Akins P: Frequency of a loss-of-
function mutation in oleoyl-PC-desaturase (ahFAD2A) in the mini-core of
the U.S. peanut germplasm collection. Crop Sci 2007, 47:2372-2378.
43. Bruner AC, Jung S, Abbott AG, Powell GL: The naturally occurring high
oleate oil character in some peanut varieties results from reduced
oleoyl-PC desaturase activity from mutation of aspartate 150 to
asparagine. Crop Sci 2001, 41:522-526.
44. Sharma KK, Lavanya M, Anjaiah V: A method for the isolation and
purification of peanut genomic DNA suitable for analytical applications.
Plant Mol Biol Rep 2000, 18:393a-393h.
45. Sambrook J, Russell DW: Molecular Cloning: A Laboratory Manual. 3 edition.
Cold Spring Harbor, NY: Cold Spring Harbor Laboratory Press; 2001.
46. Till BJ, Zerr T, Comai L, Henikoff S: A protocol for TILLING and EcoTILLING
in plants and animals. Nat Protocols 2006, 1:2465-2477.
47. Comai L, Young K, Till BJ, Reynolds SH, Greene FA, Codomo CA, Enns LC,
Johnson JE, Burtner C, Odden AR, Henikoff S: Efficient discovery of DNA
polymorphisms in natural populations by EcoTILLING. Plant J 2004,
37:778-786.
48. Zerr T, Henikoff S: Automated band mapping in electrophoretic gel
images using background information. Nucleic Acids Res 2005,
33:2806-2812.
doi:10.1186/1471-2229-11-81
Cite this article as: Knoll et al.: TILLING for allergen reduction and
improvement of quality traits in peanut (Arachis hypogaea L.). BMC Plant
Biology 2011 11:81.
Submit your next manuscript to BioMed Central
and take full advantage of:
• Convenient online submission
• Thorough peer review
• No space constraints or color figure charges
• Immediate publication on acceptance
• Inclusion in PubMed, CAS, Scopus and Google Scholar
• Research which is freely available for redistribution
Submit your manuscript at
www.biomedcentral.com/submit
Knoll et al. BMC Plant Biology 2011, 11:81
/>Page 13 of 13