Genetic divergence in groundnut (Arachis hypogaea L.) using RAPD
Bạn đang xem bản rút gọn của tài liệu. Xem và tải ngay bản đầy đủ của tài liệu tại đây (426.75 KB, 15 trang )
Int.J.Curr.Microbiol.App.Sci (2019) 8(9): 1535-1549
International Journal of Current Microbiology and Applied Sciences
ISSN: 2319-7706 Volume 8 Number 09 (2019)
Journal homepage:
Original Research Article
/>
Genetic Divergence in Groundnut (Arachis hypogaea L.) using RAPD
Yaikhom Vivekananda1*, Pramesh Khoyumthem2, Mutum Suraj Singh3,
Konsam Cha Shyamananda3 and N. Brajendra Singh1
1
Department of Plant Breeding and Genetics, College of Agriculture, Central Agricultural
University, Imphal-795004, India
2
AICRP(Groundnut), Central Agricultural University, India
3
Farmer FIRST, Imphal Centre, Central Agricultural University, India
*Corresponding author
ABSTRACT
Keywords
RAPD, Groundnut,
Genetic Divergence
Article Info
Accepted:
18 August 2019
Available Online:
10 September 2019
Twenty four genotypes of Arachis hypogaea (L.), of which 12 genotypes belonging to
Virginia and 12 belonging to Spanish varieties were used to study the genetic divergence
within its botanical varieties using RAPD. 16 primers belonging to OPH were used in the
study. Out of the 16 primers utilized, 36 and 37 bands were produced in Virginia and
Spanish group, respectively. Out of the total bands produced, 18 and 20 bands were
polymorphic for Virginia and Spanish group, respectively. Jaccard’s similarity coefficient
for Virginia group ranged from 0.09 to 0.78 and for Spanish group, it ranged from 0.13 to
0.88. A dendrogram was constructed using the similarity matrix value as determined from
RAPD data for 24 groundnut genotypes. From the similarity coefficient it was found that
the genotypes HNG 137 and ICGS 76 (0.09); HNG 137 and ICGV 87846 (0.09) showed
maximum diversity among all genotypes for the Virginia group whereas the genotypes JSP
48 and K 1451 (0.78); K 1451 and K 1468 (0.78) showed the maximum similarity.
Similarly, for the Virginia group the genotypes CSMG 2006-6 and J 71 (0.13); CSMG
2006-6 and RTNG 1 (0.13); K 1470 and RTNG 1 (0.013); J 71 and K 1470 showed
maximum diversity whereas Dh 218 and K 1392 (0.88) showed the maximum similarity.
The dendrogram clearly divided 12 genotypes of Virginia and Spanish groundnut
genotypes into 4 and 5 clusters, respectively. The genetic relationships estimated can be
useful for hybridization in the future groundnut improvement programme.
Introduction
Groundnut (Arachis hypogaea L.) is an
important crop among oilseeds grown in the
world. It is native to South America, where it
is well distributed over a wide environment. It
belongs to the family Fabaceae. It is known by
many names and the most common among
them are monkey nut, goober nut and peanut.
It is a self-pollinated crop, allotetraploid with
diploid chromosome number 2n=40.
Botanically, cultivated groundnut can be
classified into two sub-species, which mainly
1535
Int.J.Curr.Microbiol.App.Sci (2019) 8(9): 1535-1549
differed in a branching pattern. Bunting (1955,
1958) divided the cultivated groundnut into
two large botanical groups on the basis of
branching patterns (Subspecies hypogaea with
alternate branching and fastigiata with
sequencial branching pattern). Subspecies
hypogaea are further divided into botanical
varieties viz., var. hypogaea (Virginia) and
var. hirsuta and subspecies fastigiata into var.
fastigiata (Valencia); var. vulgaris (Spanish);
var. peruvian and var. aequatoriana.
sequential data because arbitrary DNA
sequence is used as a single primer of
amplified sequence which could be species or
strain-specific and constitute identifying the
profile of organism (Ferreira and Grattupaglia,
1996). When cost-efficient and simplicity
were considered RAPD proves to be superior
(Williams et al., 1990). RAPD has been used
in the analysis of genetic distance in different
plant species (Lashermes et al., 1996; Samec
and Nesinec, 1996; Colombo et al., 2000).
India is having the world largest area under
groundnut (6 million ha) with 980 kg/ha,
which is next to China (3460 kg/ha). The
productivity of groundnut in India is very low,
the USA stands first for productivity, that is,
3710 kg/ha. (Anonymous, 2012). In India
groundnut is mainly grown in Gujarat, Andhra
Pradesh, Tamil Nadu, Karnataka and
Maharashtra with 32.37%, 18.53%, 16.39%,
9.43%, 6.61% respectively (Anonymous,
2011).
Molecular markers have been proved to be an
important tool in the characterization and
genetic diversity analysis within and between
species and populations.
In Manipur, groundnut is mainly cultivated in
kharif season and area under this crop is very
small due to lack of suitable varieties for this
region. The state has about 2,89,826 ha of
total cropped area (Department of Agriculture,
CIC Manipur) and there is a possible niche for
groundnut in about 20% of this area. Paddy
(Oryza sativa L.) is the major kharif crop in
this state and after the harvesting of Paddy, the
land is either left fallow or planted with
Mustard (Brassica sp.). So, the introduction of
suitable rabi groundnut varieties can also
utilized in this fallow land. In order to develop
such suitable varieties, a systematic breeding
approach has to be adopted.
RAPD markers are commonly used because
they are quick and simple to obtain, enabling
genetic diversity analysis in several types of
plant material such as natural populations, the
population in breeding programmes and
germplasm collections. It does not require any
It has been shown that different markers might
reveal different classes of variation (Powell et
al., 1996; Russell et al., 1997) is correlated
with the genome fraction surveyed by each
kind of marker, their distribution throughout
the genome and extend of the DNA target
which is analyzed by each specific assay
(Davila et al., 1999).
Materials and Methods
Plant Material
The seeds of 24 different genotypes of
groundnut were obtained from the Department
of Plant Breeding and Genetics, College of
Agriculture, CAU, Imphal. Leaves were
collected at 15 days after sowing. The
experimental materials which were used in the
present study are given in Table 1 and 2.
List of Primers
A set of 16 RAPD primers were used for PCR
amplification and the primers were procured
from Eurofins Genomics India Private Limited
(previously Operon), Banglore. The details of
primer code sequence of the primer and GC
contents are given in table 3.
1536
Int.J.Curr.Microbiol.App.Sci (2019) 8(9): 1535-1549
DNA Isolation
DNA isolation was done according to the
DNA isolation method (Porebski et al., 1997)
with a slight modification. The leaf sample of
0.1 g of each genotype of groundnut was taken
and grinned in mortar pestle using liquid
nitrogen. The mixer was put in a micro
centrifuge tube separately for each genotype. 1
ml of 60 ºC extraction buffer with 10 mg
PVP/100mg of leaf tissue was added to each
sample tubes and were incubated at 60 ºC in
water bath for 60 minutes. After that the
sample tubes were removed from water bath
and made it cool at room temperature for 4 to
6 minutes. The same amount of chloroform:
isoamyl (24:1) was added to each sample
tubes and mixed by inversion to form
emulsion. After mixing thoroughly, the
sample tubes were spun at 3000 rpm for 20
minutes in a centrifuge at 4 ºC. The upper
phase i.e the aqueous solution was taken to
new 1.5 ml micro centrifuge tube using widebore pipette tip (1000 µl). Then the process of
chloroform:isoamyl extraction was repeated
again. In the final aqueous solution recovered,
1/2 volume of 5 M NaCl and 2 volumes of icecold (-20ºC) 95% ethanol were added and
mixed by inversion, then the sample tubes
were kept at 4ºC to precipitate overnight. On
the next day the sample tubes were spun at
3000 rpm for 6 minutes and the supernatant
from each sample tubes was poured off. Then
the pellet was washed with ice-cold (4ºC)
ethanol. After that the samples were dried in
laminar airflow for approximately one hour. 3
µl RNase A (10 mg/ml) was added to each
sample tubes and incubated in water-bath at
37ºC for 1 hour.
Then 3 µl proteinase K (1mg/ml) was added
and again incubated at 37ºC for 30 minutes.
150 µl of tris saturated phenol (pH 8) and 150
µl of chloroform were added to each sample
tubes and vortex briefly then spun in
centrifuge at 14,000 rpm for 15 minutes at
4ºC. The upper layer was collected from each
sample tubes and transferred to new 1.5 ml
micro centrifuge tubes, then 100 µl of TE
buffer and 1/10 vol. 2M Na acetate was added
to the phenol phase. The sample tubes were
kept overnight in -20ºC and then spun at
14,000 rpm for 20 minutes in centrifuge at 4ºC
on the next day.
After that, the supernatant was drained off
from each sample tubes and made it dry in
laminar airflow for approximately 1 hour.
Then 400 µl of TE buffer was added to each
sample tubes and allowed it for complete
resuspension.
The quantification of DNA was done by
observing its absorbance at 260 nm and 280
nm wavelengths by using a spectrophotometer
(Aquarius Cecil CE 7200) and quality of gel is
analyzed by running on 0.8% agarose gel.
PCR Analysis
PCR was performed by using 16 RAPD
primer and Epicentre FailSafeTM PCR system
with a total volume of 20 μL, containing 2 μL
template DNA, 10 μL 2X premix, 0.5 μM of
each primer and 1.25 U of an enzyme
(Epicentre, USA). PCR amplification (2720
Thermal Cycler, Applied Biosystems,
California, USA) was carried out using a
standard PCR cycle was condition: an initial
denaturation step at 94 °C for 5 min, followed
by 38 cycles of 94 °C for 1 min, 34 °C for 1
min, and 72 °C for 2 min; the final extension
was held for 5 min. Following the
amplification, the PCR products were loaded
on 1.4 Agarose Gel which was prepared in 1X
TAE buffer. The amplified product was
electrophoresis for 1.5 hours at 90 V and
stained with ethidium bromide (10mg/ml).
After separation, the gel was viewed under
and photographed by using Gel Doc XR+
(Bio-Rad, California, USA) gel documentation
system.
1537
Int.J.Curr.Microbiol.App.Sci (2019) 8(9): 1535-1549
Scoring of RAPD analysis and Statistical
Analysis for similarity coefficient
DNA bands were designated on the basis of
their molecular size corresponding to loaded
DNA ladder (100 bp). The presence of each
band was scored as ‘1’ and its absence as ‘0.
The scores (0 or 1) for each band obtained
were entered in the form of a rectangular data
matrix (qualitative data matrix) and the pairwise association coefficients were calculated
from the qualitative data matrix using
Jaccard’s similarity coefficient (Jaccard,
1901).
Results and Discussion
DNA isolation, purification and
quantification
The concentration of DNA prepared varies
from 53.20 ng/µl (CSMG 2006-6) to 119.50
ng/µl (RG 530) respectively as shown in table
4. The integrity of the isolated DNA was
verified by visualization of DNA on 0.8 per
cent Agarose gel with 1kbp DNA ladder. The
quality of DNA was determined by the
A260/A280 ratio which ranged from 1.46 to 1.91
as shown in table 4.
RAPD analysis
Sixteen random decamer primers obtained
from Eurofins Genomics India Private Limited
(previously Operon), Banglore having high
per cent of G+C contents were used for RAPD
analysis in 24 genotypes of groundnut (12
Virginia and 12 Spanish) for detecting
polymorphism and showed the percentage of
polymorphism ranging from 0 to 100%.
The DNA amplification and polymorphism
generated among various genotypes of
groundnut using random primers are presented
in table 5 and 6. Out of 16 primers, the
maximum band were produced in primer
OPH-17 with 4 bands and all of them were
polymorphic for both Virginia and Spanish
group while a minimum of 1 band was
produced in primer OPH-1, OPH-3, OPH-7
and OPH-9 for both the groundnut group. For
Virginia group out of 36 bands produced 18
are found to be a polymorphic while for
Spanish out of 37 bands produced 20 are
polymorphic.
Jaccard’s similarity coefficient and cluster
analysis
The RAPD score obtained by using Bio-Rad
ImageLab 3.0 software was utilized to
produce Jaccard’s similarity coefficient
separately for two groundnut group (Virginia
and Spanish) and data were subjected to
UPGMA (Unweighted Pair Group Method
with Arithmetic Mean) and dendrogram was
generated using NTSYSpc version 2.2 (Rohlf,
1998) which is presented in Table 7, 8, Fig. 1
and Fig. 2.
DNA
isolation,
quantification
purification
and
The concentration of DNA prepared were
found to vary from 53.20 ng/µl to 119.50
ng/µl respectively which shows there was
enough DNA content in the sample to carried
out the PCR process. The quality of DNA was
determined by the A260/A280 ratio which
ranged from 1.46 to 1.91 which indicates a
good quality plant DNA.
RAPD analysis
Sixteen random decamer primers obtained
from Eurofins Genomics India Private Limited
(previously Operon), Banglore was used for
RAPD analysis in 24 genotypes of groundnut
(12 Virginia and 12 Spanish) of which and
these primers showed the percentage of
polymorphism ranged from 0 to 100%.
1538
Int.J.Curr.Microbiol.App.Sci (2019) 8(9): 1535-1549
Among 16 primers amplified, the primer code
OPH-5, OPH-7, OPH-8, OPH-10, OPH-12,
OPH-13, OPH-14, OPH-17, OPH-18, OPH-19
and OPH-20 gave polymorphic bands for both
Virginia and Spanish group, whereas, primer
OPH-15 gave polymorphic only in Spanish
group. The molecular size of the band ranged
between 300 bp to 800 bp. OPH-17 and OPH19 gave the highest number of bands i.e. 4 for
both Virginia and Spanish group.
The primer OPH-8, OPH-14, OPH-18 and
OPH-20 gave 3 bands each for Virginia group
and in Spanish group OPH-8, OPH-13, OPH14, OPH-18 and OPH-20 gave 3 bands each.
Primer OPH-1, OPH-3, OPH-7 and OPH-9
gave minimum 1 band each and the remaining
primer gave 2 bands each for both Virginia
and Spanish group. An average of 2.25 and
2.31 bands per primer was produced for
Virginia and Spanish group, respectively.
Table.1 Virginia group
S. No.
1
2
3
4
5
6
7
8
9
10
11
12
Genotype
BAU 13
CSMG 2006-26
HNG 137
ICGS 76
ICGV 87846
JSP 48
JSP 49
JSSP 37
K 1451
K 1468
RG 530
RG 578
Source
BAU, Kanke
ARS, Chintamani
RAU, Hanumangard
ICRISAT, Hyderabad
ICRISAT, Hyderabad
JAU, Junagadh
JAU, Junagadh
JAU, Junagadh
ARS, Kadiri
ARS, Kadiri
IGKV, Raipur
IGKV, Raipur
Table.2 Spanish group
S. No.
1
2
3
4
5
6
7
8
9
10
11
12
Genotype
CSMG 2006-6
CTMG 7
Dh 218
J71
K1333
K1392
K1470
RTNG 1
TCGS 876
TCGS 901 A
TG 68
UG 6
1539
Source
ARS, Chintamani
ARS, Chintamani
UAS, Dharwad
ORS, Jalgaon
ARS, Kadiri
ARS, Kadiri
ARS, Kadiri
IGKV, Raipur
RARS, Tirupati
RARS, Tirupati
ORS, Tindivanam
MPUA&T, Udaipur
Int.J.Curr.Microbiol.App.Sci (2019) 8(9): 1535-1549
Table.3 Detail of RAPD primer used in molecular analysis of groundnut germplasm
S. No.
Primer*
Sequence 5´ to 3´
GC-content (%)
1.
OPH-01
GGTCGGAGAA
60
2.
OPH-03
AGACGTCCAC
60
3.
OPH-04
GGAAGTCGCC
70
4.
OPH-05
AGTCGTCCCC
70
5.
OPH-07
CTGCATCGTG
60
6.
OPH-08
GAAACACCCC
60
7.
OPH-09
TGTAGCTGGG
60
8.
OPH-10
CCTACGTCAG
60
9.
OPH-12
ACGCGCATGT
60
10.
OPH-13
GACGCCACAC
70
11.
OPH-14
ACCAGGTTGG
60
12.
OPH-15
AATGGCGCAG
60
13.
OPH-17
CACTCTCCTC
60
14.
OPH-18
GAATCGGCCA
60
15.
OPH-19
CTGACCAGCC
70
16.
OPH-20
GGGAGACATC
60
*Operon primer code.
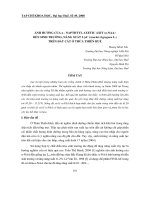
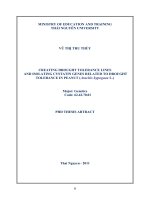
Fig.1 Dendrogram showing relationship among 12 Virginia group groundnut genotypes
generated by UPGMA analysis based on RAPD
JSP48
K1451
CSMG2006-26
JSP49
K1468
HNG137
CSMG2006-26MW
RG530
RG578
JSSP37
BAU13
ICGV87846
ICGS76
0.30
0.42
0.54
Coefficient
1540
0.66
0.78
Int.J.Curr.Microbiol.App.Sci (2019) 8(9): 1535-1549
Table.4 Concentration of DNA in groundnut genotypes
S. No.
1
Genotype
BAU 13
Group
Virginia
260/280
1.68
Concentration ng/ul
88.15
2
CSMG 2006-6
Spanish
1.72
53.20
3
CSMG 2006-26
Virginia
1.69
56.40
4
CTMG 7
Spanish
1.65
84.10
5
Dh 218
Spanish
1.58
66.60
6
HNG 137
Virginia
1.63
69.50
7
ICGS 76
Virginia
1.64
78.55
8
ICGV 87846
Virginia
1.68
58.50
9
J71
Spanish
1.67
122.00
10
JSP 48
Virginia
1.46
55.10
11
JSP 49
Virginia
1.57
810
12
JSSP 37
Virginia
1.65
84.10
13
K1333
Spanish
1.67
104.50
14
K1392
Spanish
1.63
86.20
15
K 1451
Virginia
1.91
76.10
16
K 1468
Virginia
1.50
72.80
17
K1470
Spanish
1.65
81.25
18
RG 530
Virginia
1.60
119.50
19
RG 578
Virginia
1.62
78.00
20
RTNG 1
Spanish
1.66
148.00
21
TCGS 876
Spanish
1.56
65.30
22
TCGS 901 A
Spanish
1.65
93.40
23
TG 68
Spanish
1.63
70.10
24
UG 6
Spanish
1.63
98.50
1541
Int.J.Curr.Microbiol.App.Sci (2019) 8(9): 1535-1549
Table.5 Polymorphic information of RAPD primers analysed for Virginia group
S. No.
Primer
code
Sequences (5'to 3')
1
2
3
4
5
6
7
8
9
10
11
12
13
14
15
16
OPH-01
OPH-03
OPH-04
OPH-05
OPH-07
OPH-08
OPH-09
OPH-10
OPH-12
OPH-13
OPH-14
OPH-15
OPH-17
OPH-18
OPH-19
OPH-20
GGTCGGAGAA
AGACGTCCAC
GGAAGTCGCC
AGTCGTCCCC
CTGCATCGTG
GAAACACCCC
TGTAGCTGGG
CCTACGTCAG
ACGCGCATGT
GACGCCACAC
ACCAGGTTGG
AATGGCGCAG
CACTCTCCTC
GAATCGGCCA
CTGACCAGCC
GGGAGACATC
Total
Total
Number
of
bands(a)
1
1
2
2
1
3
1
2
2
2
3
2
4
3
4
3
36
Total Number
of
polymorphic
bands(b)
0
0
0
1
1
2
0
1
1
2
2
0
4
1
1
2
18
Polymorphism
% (b/a X 100)
0
0
0
50
50
66.7
0
50
50
100
66.7
0
100
33.3
25
66.7
50
Table.6 Polymorphic information of RAPD primers analysed for Spanish group
S. No.
Primer
code
Sequences (5'to 3')
1
2
3
4
5
6
7
8
9
10
11
12
13
14
15
16
OPH-01
OPH-03
OPH-04
OPH-05
OPH-07
OPH-08
OPH-09
OPH-10
OPH-12
OPH-13
OPH-14
OPH-15
OPH-17
OPH-18
OPH-19
OPH-20
GGTCGGAGAA
AGACGTCCAC
GGAAGTCGCC
AGTCGTCCCC
CTGCATCGTG
GAAACACCCC
TGTAGCTGGG
CCTACGTCAG
ACGCGCATGT
GACGCCACAC
ACCAGGTTGG
AATGGCGCAG
CACTCTCCTC
GAATCGGCCA
CTGACCAGCC
GGGAGACATC
Total
Total
Number
of
bands(a)
1
1
2
2
1
3
1
2
2
3
3
2
4
3
4
3
37
1542
Total Number
of
polymorphic
bands(b)
0
0
0
1
1
2
0
1
1
3
2
1
4
1
1
2
20
Polymorphism
% (b/a X 100)
0
0
0
50
50
66.7
0
50
50
100
66.7
0
100
33.3
25
66.7
54
Int.J.Curr.Microbiol.App.Sci (2019) 8(9): 1535-1549
Table.7 Jaccard’s average similarity coefficient for 12 Virginia groundnut genotypes
BAU13
CSMG200626
HNG137
ICGS76
ICGV
87846
JSP48
JSP49
JSSP37
K1451
K1468
RG530
BAU13
1
CSMG200626
0.55
1
HNG137
0.25
0.54
1
ICGS76
0.5
0.27
0.09
1
ICGV
87846
0.5
0.27
0.09
0.5
1
JSP48
0.3
0.64
0.6
0.25
0.11
1
JSP49
0.44
0.64
0.33
0.25
0.25
0.56
1
JSSP37
0.75
0.73
0.42
0.38
0.38
0.5
0.5
1
K1451
0.36
0.67
0.64
0.33
0.2
0.78
0.6
0.55
1
K1468
0.3
0.5
0.45
0.25
0.25
0.56
0.75
0.36
0.78
1
RG530
0.13
0.27
0.2
0.2
0.2
0.43
0.43
0.1
0.33
0.43
1
RG578
0.57
0.33
0.08
0.33
0.33
0.2
0.5
0.44
0.27
0.14
0.33
1543
RG578
1
Int.J.Curr.Microbiol.App.Sci (2019) 8(9): 1535-1549
Table.8 Jaccard’s average similarity coefficient for 12 Spanish groundnut genotypes
CTMG7
CSMG2006-6
CSMG
2006-6
1
Dh218
J71
K1333
K1392
CTMG7
0.5
1
Dh218
0.5
0.78
1
J71
0.13
0.38
0.38
1
K1333
0.44
0.7
0.55
0.44
1
K1392
0.57
0.67
0.88
0.31
0.6
1
K1470
0.6
0.5
0.5
0.13
0.44
0.57
1
RTNG1
0.13
0.3
0.3
0.36
0.17
0.2
0.13
1
TCGS
876
TCGS
901A
TG68
0.5
0.63
0.63
0.27
0.4
0.5
0.5
0.43
1
0.6
0.5
0.5
0.2
0.44
0.57
0.6
0.29
0.8
1
0.5
0.63
0.63
0.19
0.4
0.5
0.5
0.43
0.67
0.5
1
UG6
0.21
0.4
0.4
0.69
0.57
0.43
0.21
0.29
0.2
0.21
0.29
1544
K1470
RTNG1
TCGS
876
TCGS
901A
TG68
UG6
1
Int.J.Curr.Microbiol.App.Sci (2019) 8(9): 1535-1549
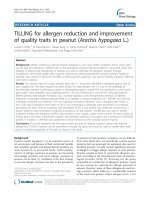
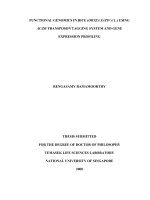
Fig.2 Dendrogram showing relationship among 12 Spanish group groundnut genotypes generated by UPGMA analysis based on RAPD
CSMG2006-6
K1470
T CGS876
T CGS901A
T G68
CT MG7
CSMG2006-6MW
K1392
Dh218
K1333
J71
UG6
RT NG1
0.28
0.43
0.58
Coefficient
1545
0.73
0.88
Int.J.Curr.Microbiol.App.Sci (2019) 8(9): 1535-1549
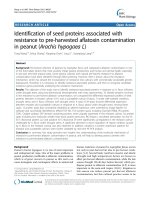
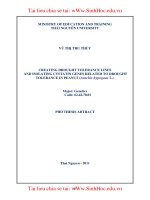
Fig.3 RAPD profile generated through OPH-18 in 12 Virginia genotypes (M: DNA Ladder 100
bp, 1:JSP 48, 2:RG 530, 3:JSP 49, 4:RG 578, 5:K 1468, 6:K1451, 7:CSMG 2006-26, 8:JSSP 37,
9:ICGV 87846, 10:HNG 137, 11:ICGS 76, 12:BAU 13)
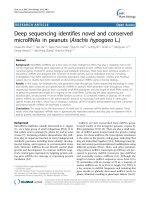
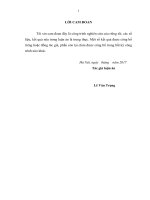
Fig.4 RAPD profile generated through OPH-18 in 12 Spanish genotypes (M:Ladder 100 bp,
13:CSMG 2006-6,14:TCGS 876, 15:TCGS 901A, 16:J71, 17: CTMG 7, 18:TG 68, 19:UG 6,
20:K1470, 21:K1392, 22:RTNG 1, 23:Dh 218, 24:K1333)
1546
Int.J.Curr.Microbiol.App.Sci (2019) 8(9): 1535-1549
Primer OPH-17 gave the highest polymorphic
bands i.e. 4 in both the groundnut group and
the lowest were found in primer OPH-5, OPH7, OPH-10, OPH-12, OPH-18 and OPH-19
with 1 polymorphic band each in Virginia
group and in Spanish group primer OPH-5,
OPH-7, OPH-10, OPH-12, OPH-15, OPH-18
and OPH-19 gave 1 polymorphic band each.
Out of the total number of 36 bands, 18 bands
were polymorphic in Virginia group and in
Spanish group out 37 bands produced, 20 were
found to be polymorphic.
Jaccard’s similarity coefficient and cluster
analysis
The RAPD data were used to obtain the
similarity matrix. For the Virginia group, the
similarity coefficient for different genotypes
lies in the range of 0.09 to 0.78 and in Spanish
group similarity coefficient for different
genotypes ranged from 0.13 to 0.88.
In Virginia the minimum similarity (0.09) was
observed between genotypes HNG 137 and
ICGS 76; HNG 137 and ICGV 87846; the
maximum similarity (0.78) was observed
between genotypes JSP 48 and K1 451; K
1451 and K 1468. For Spanish group the
minimum similarity (0.13) was observed
between genotypes CSMG 2006-6 and J71;
CSMG 2006-6 and RTNG 1; K 1470 and
RTNG 1; J 71 and K1470 whereas the
maximum similarity (0.88) were observed
between Dh 218 and K 1392. A dendrogram
was constructed using the similarity matrix
value as determined from RAPD data for 24
groundnut genotypes each 12 Virginia and 12
Spanish within the group using UPGMA
(Unweighted Pair Group Method of
Arithmetic Mean). Cluster analyses for the
two groundnut group are given below:
Virginia group
For the Virginia group, the dendrogram
generated on the basis of Jaccard's similarity
coefficient clearly indicated four clusters. The
cluster I which was the major cluster included
6 genotypes viz., CSMG 2006-26, HNG 137,
JSP 48, JSP 49, K 1451 and K 1468. The
cluster II included 3 genotypes i.e. BAU 13,
JSSP 37 and RG 578. The cluster III included
2 genotypes i.e. ICGS 76 and ICGV 87846
while cluster IV has only 1 genotype, i.e. RG
530.
Spanish group
For the Spanish group, the dendrogram
generated shows five clusters. The cluster I
included 4 genotypes i.e. CTMG 7, Dh 218, K
1333 and K 1392. The cluster II included 3
genotypes i.e. TCGS 876, TCGS 901A and
TG 68. The cluster III and cluster IV included
2 genotypes i.e. J 71 and UG 6; CSMG 2006-6
and K 1470 respectively. The remaining
cluster V included only 1 genotype, i.e. RTNG
1.
It has been a general observation that genetic
diversity plays a major role in the expression
of heterosis. Several scientists have shown
that hybrids between genetically diverse
parents manifest greater heterosis than those
between more closely related parents
(Ramanujam et al., 1974 in mungbean;
Arunachalam et al., 1984 in groundnut; Rao et
al., 2004 in sunflower; Parameshwarappa et
al., 2012 in chickpea).
The study concluded that the genotypes which
were under the different cluster for both the
group can be utilized for future hybridization
programme for groundnut improvement.
RAPD can be successfully used for evaluation
of divergence analysis in groundnut, however
the effectiveness largely depends on the
selection of the molecular markers. In our
study, the analysis would have been more
effective and meaningful if we have combined
the analysis with other molecular markers.
1547
Int.J.Curr.Microbiol.App.Sci (2019) 8(9): 1535-1549
Acknowledgements
The authors are grateful to the College of
Agriculture, Central Agricultural University,
Imphal for providing facilities and support for
conducting the experiment.
References
Anonymous 2011. Directorate of Economics
and
Statistics,
Department
of
Agriculture and Cooperation.
Arunachalam,
V., Bandyopadhyay,
A.,
Nigam,
S.N.
and Gibbons,
R.
W. 1984. Heterosis in relation to
genetic divergence and specific
combining ability in groundnut
(Arachis hypogaea L.). Euphytica. 33
(1): 33-39.
Bunting, A.H. 1955. A classification of
cultivated groundnut. Empire J. Exp.
Agric. 23: 158-170.
Bunting, A.H. 1958. A further note on the
classification of cultivated groundnut.
Empire J. Exp. Agric. 26: 254-258.
Colombo, C., Second, G. and Charrier, A.
2000. Diversity within America
Cassava germplasm based on RAPD
markers. Genet. Mol. Biol. 23: 189199.
Davila, J.A.Y., Loarce, E. and Ferrer 1999.
Molecular characterization and genetic
mapping
of
random
amplified
microsatellite polymorphism in Barley.
Theor. Appl. Genet. 98: 265-273.
Ferreira, M.E. and Grattupaglia, B. 1996.
Introdução ao uso de marcadores
moleculares em análise genética. 2nd
edition embrapacenargen. Brasilla. 12:
121-130.
Jaccard, P. 1901. Étude comparative de la
distribution floraledansune portion des
Alpeset des Jura. Bulletin de la
SociétéVaudoise
des
Sciences
Naturelle. 37: 547–579.
Lashermes, P., Trouslot, P., Anthrony, F.,
Combes, M.C. and Charrier, A. 1996.
Genetic diversity for RAPD marker
using cultivated and wild accessions of
Coffea arabica. Euphytica. 87: 59-64.
Parameshwarappa, S.
G., Salimath, P.
M., Upadhyaya H. D., Kajjidoni, S. T.
and Patil, S. S. 2012. Heterosis in
relation to genetic divergence in
minicore collections of Chickpea
(Cicer arietinum L.). Indian J. Genet.
Plant Breed. 72(3): 303-308.
Porebski, S., Grant, L.B. and Bernard, R.B.
1997. Modification of a CTAB DNA
Extraction
Protocol
for
Plants
Containing High Polysaccharide and
Polyphenol Components. Plant Mol.
Biol. Rep. 15(1): 8-15.
Powell, W.; Morgante, M. and Andre, C.
1996.The comparison of RFLP,
RAPD, AFLP and SSR (microsatellite)
marker for germplasm analysis. Mol.
Breeding. 2: 225-238.
Ramanujam, S., Tiwari, A.S. and Mehra, R.B.
1974. Genetic divergence and hybrid
performance in mungbean. Theor.
Appl. Genet. 25: 211-214.
Rao Mohan, G., Reddy, L., Kulkarni, R.S.,
Ramesh, S. and Reddy Lalitha, S.S.
2004. Prediction of heterosis based on
genetic divergence of parents through
regression analysis in Sunflower.
HELIA. 27(41): 51-58.
Rohlf, F.J. 1998. NTSYS-PC numerical
taxonomy and multivariate analysis
system, version 2.02.Exeter Software,
Setauket, New York.
Russell, J.R., Fuller, J.D., Macaulay, M., Hatz,
B.G., Jahoor, A., Powell, W. and
Waugh, R. 1997. Direct comparison of
levels of genetic variation among
Barley accessions detected by RFLPs,
AFLPs, SSRs and RAPDs. Theor.
Appl. Genet. 95: 714-722.
Samec, P. and Nesinec, V. 1996. The use of
RAPD techniques for the identification
and classification of Pisum sativum L.
1548
Int.J.Curr.Microbiol.App.Sci (2019) 8(9): 1535-1549
genotypes. Euphytica. 89: 229-234.
Williams, J.G.K., Kubelik, A.R., Livak, K.J.,
Rafalski, J.A. and Tingey, S.V. 1990.
DNA polymorphism amplified by
arbitrary primers are useful as genetic
markers. Nucleic Acids Res. 18: 65306535.
How to cite this article:
Yaikhom Vivekananda, Pramesh Khoyumthem, Mutum Suraj Singh, Konsam Cha
Shyamananda and Brajendra Singh, N. 2019. Genetic Divergence in Groundnut (Arachis
hypogaea L.) using RAPD. Int.J.Curr.Microbiol.App.Sci. 8(09): 1535-1549.
doi: />
1549