Biodiversity, spatial and association patterns of natural tree species in tropical broadleaved forst in northern Vietnam
Bạn đang xem bản rút gọn của tài liệu. Xem và tải ngay bản đầy đủ của tài liệu tại đây (351.8 KB, 10 trang )
Silviculture
BIODIVERSITY, SPATIAL AND ASSOCIATION PATTERNS OF
NATURAL TREE SPECIES IN TROPICAL BROADLEAVED FOREST
IN NORTHERN VIETNAM
Phan Quoc Dung1, Nguyen Hong Hai2
1,2
Vietnam National University of Forestry
SUMMARY
Ecological processes in forests can be studied via the spatial distribution of tree species. However, the distribution
pattern of a species may be obscured by environmental heterogeneity. In order to answer these questions: What
are the prevailing types of intraspecific spatial distributions and interspecific association patterns at tree species in
a tropical rain forest? Which ecological processes could structure these patterns? The techniques of point pattern
analysis were implemented on mapped two 1-ha forest plots in Ba Vi National Park, Cuc Phuong National Park.
We analyzed (i) The effect of environmental heterogeneity on tree distributions; (ii) Intraspecific associations and
(iii) Interspecific associations. Our analyses showed that: (i) Environmental conditions were homogeneous at all
two plots. (ii) In two plots, almost dominant species were aggregated at various scales up to 50 m due to the
limited distribution of each species while the rest was random distribution. (iii) Attraction and independence in
two plots are remarkably higher than repulsion pattern of tree species. Overall, spatial aggregation of a species
can be induced by limited seed dispersal or patchy habitat conditions while random distributions were effected
by competitive relations or even human activities. The repulsive interactions between some tree species are
explained by negative interactions of tree species.
Keywords: Environmental homogeneity, Northern Vietnam, spatial point pattern analysis, tropical
broad-leaved forest.
I. INTRODUCTION
Spatial patterns of forest trees result from
complex dynamic processes such as
establishment, dispersal, mortality, land use
and climate (Franklin et al., 2010), especially
in tropical forests which were known as the
world’s
most
species-rich
terrestrial
ecosystems. An important question for all
scientists in researching of forest ecology is
how to understand the processes and
mechanisms that control species coexistence
and community structure, especially at various
spatial scales. Studies on species-rich tropical
forests produced numerous hypotheses on
species co-existence, these relevant issues have
been addressed in numerous studies (Chesson,
2000; Wright, 2002; Volkov et al., 2005).
Barot (2004) highlighted the impact of both
exogenous and endogenous factors on the
spatial and temporal distributions of tree
species. Other studies investigated dispersal
limitation (Hubbell, 1979), intra- and interspecific interactions (Callaway and Walker,
1997; Bruno et al., 2003), negative density
dependence (Wright, 2002), or habitat
preference (Condit et al., 2000). Tilman (2004)
emphasized that in the processes of dispersal
and competition, environmental niche effects
and trade-offs among species are two main
factors that made a big difference in spatial
patterns of trees. Environmental heterogeneity
(such as different soil types, rock outcrops or
streams) makes spatial pattern analysis more
complicated because it confounds biotic and
abiotic effects (Li and Reynolds, 1995; Wiens,
2000). Getzin et al. (2008) found that plant
ecology in terms of plant population dynamics
and pattern formation may differ between
homogeneous and heterogeneous sites, beyond
the purely statistical effects of heterogeneity.
Dispersal limitation is emphasized as a
potential mechanism for separating species in
space and reducing competitive exclusion
(Seidler and Plotkin, 2006). Besides that, a
patchy distribution of trees can also be caused
by habitat preference where demographic
processes and limiting resources may
simultaneously influence spatial patterns
(Wagner and Fortin, 2005; Getzin et al., 2008).
Thus, spatial aggregation of a species can be
JOURNAL OF FORESTRY SCIENCE AND TECHNOLOGY NO. 2 - 2018
23
Silviculture
induced by limited seed dispersal or patchy
d may also be reinforced
habitat conditions and
by both factors (Webb and Peart,
Peart 2000). In
self
addition, negative density dependence or selfthinning is proposed as a prominent
mechanism for regulating population dynamics
and facilitating species coexistence (Wright,
2002).. This mechanism has been considered by
a negative density of conspecific distance
relation in processes of forest dynamics such
as recruitment, growth or survival (Condit et
al., 1992; Peters, 2003; Uriarte et al.,
al. 2004).
The goal of this research aims to analyze
and evaluate spatial and association patterns of
natural tree species in tropical broad
broad-leaved
forests in Northern
orthern Vietnam. Moreover,
ecological
underlying
mechanisms
or
processes structuring these spatial patterns are
inferred which allow to interpret spatial
structure of these forest stands.
II. RESEARCH METHODOLOGY
HODOLOGY
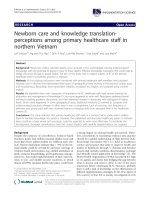
2.1. Study sites and data collection
Two 1-ha
ha plots are designed in two different
tropical broadleaved forests in Northern
Vietnam including Ba Vi National Park
(21°04'09.5" N and 105°21'36.5" E), Cuc
Phuong National Park (20°17'18.9" N and
105°39'22.3" E).. Establishing typical plots in
evergreen broad-leaved
leaved forest in the core zone
of two National Parks (NP).
(NP) The plots
represent for the forest stands in order to
research ecological conditions, community
structure and growth status. The area of eac
each
plot is 1 ha (100 m × 100 m). The plot is
divided into 100 subplots of 100 m2 (10 m × 10
m) by wooden poles and nylon strings. All
trees (DBH ≥ 2.5 cm) were marked, identif
identified
the species name and measured the diameter at
breast height at 1.3 m from ground
ground. The
relative position (x, y) of the tree
trees in the
subplot were measured by using the laser
distance measurer Leica Disto D2 with a
precision of 0.1 cm and a compass.
Ba Vi National Park is situated in the
tropical monsoon climate. The average annual
temperature in the region is 23.4oC; at lowest
temperatures down to 2.7oC; highest
temperature up to 42oC. The annual averag
average
rainfall is 2,500
500 mm, about 70 - 80% of the
total precipitation focusing on July - August;
humidity of 86.1%.
Cuc Phuong National Park (located in Nho
Quan district, Ninh Binh province) is
surrounded by limeston
limestone mountains with
mean maximum height of 300 - 400 m and is
covered by tropical evergreen rainforest. In
the core zone, mean annual temperature is
20.6°C, but mean temperature in winter is
only 9°C. In the buffer zone, mean annual
temperature is about 2° hi
higher. Annual mean
humidity is 85% and the average annual
rainfall is 2,138 mm per year.
Figure 1. Map of studied plots at Ba Vi and Cuc Phuong National Park
24
JOURNAL OF FORESTRY SCIENCE AND TECHNOLOGY NO. 2 - 2018
Silviculture
2.2. Data analysis
Important value and diversity indices
Importance Value Index (IVI): was a
measure of how dominant a species was in a
given forest area.
Relative density (RD) was the number of
individuals per area as a percent of the number
of individuals of all species.
IVI (%) = (Relative density + relative Basal area)/2
Relative basal area was the total basal area
of Species A as a percent of the total basal area
of all species.
The Shannon-Wiener index was an
information statistic index, which means it
assumes all species are represented in a
sample and that they are randomly sampled.
In the Shannon index, p was the proportion
(n/N) of individuals of one particular species
found (n) divided by the total number of
individuals found (N), ln was the natural log,
Σ is the sum of the calculations, and s was the
number of species.
Shannon
Wiener Index (H) =
The Simpson’s index was a dominance
index because it gives more weight to common
or dominant species. In this case, a few rare
species with only a few representatives will not
affect the diversity. In the Simpson index, p
was the proportion (n/N) of individuals of one
particular species found (n) divided by the total
number of individuals found (N), Σ was still
the sum of the calculations, and s was the
number of species.
Simpson′s Index (D) =
III. RESULTS
3.1. Species property of tropical forest
studied stands
Table 1. Forest stand characteristics in Ba Vi plot
No.
Species
N
DBH
(cm)
IVI
(%)
Properties
Simpson
3.36
0.97
Light demanding
1
E. wightiana
105
9.6 ± 3.9
5.01
2
X. noronhianum
99
10.3 ± 4.7
4.98
Light demanding
3
N. baviensis
55
16.8 ± 11.3
4.73
Light demanding
4
Q. bambusifolia
37
22.3 ± 13
4.35
5
Q. gemelliflora
13
40.2 ± 18.2
3.58
6
C. lenticellata
71
9.5 ± 4.5
3.41
7
W. laevis
68
9.4 ± 4.9
3.28
8
S. baviense
44
14.4 ± 10.8
3.28
9
C. zeylanicum
37
17.1 ± 11.2
3.19
Light demanding
10
C. glaucescens
59
11.2 ± 5.2
3.14
Light demanding
11
A. globiflora
49
11.7 ± 5.8
2.71
Light demanding
12
70 other species
830
In Ba Vi NP plot, a total of 1,467 tree
individuals with DBH ≥ 2.5 cm were
enumerated in the 1-ha study plot. 81 species
ShannonWiener
& fast growing
Moderate inclining
to light demanding
Light demanding
Light demanding
& fast growing
Shade tolerance
Light demanding
& fast growing
58.34
were identified and belonged to 26 families;
Shannon - Weiner (H’) = 3.36; Simpson (D)
= 0.97. In 11 dominant species, there are 10
JOURNAL OF FORESTRY SCIENCE AND TECHNOLOGY NO. 2 - 2018
25
Silviculture
noronhianum, N. baviensis, Q. bambusifolia,
Q. gemelliflora, C. lenticellata, W. laevis, S.
baviense, C. zeylanicum, C. glaucescens, A.
globiflora with total IVI is 41.66%. Only 10
of them except Q. gemelliflora were selected
for further spatial pattern analyses.
species with light demanding, approximately
91% of total. E. wightiana (Myrtaceae) was
most abundant with 105 individual ha-1 with
the average size is quite small (9.6 ± 3.9 cm).
Moreover, depending on IVI there are 11
dominant species: E. wightiana, X.
Table 2. Forest stand characteristics in Cuc Phuong plot
No.
Species
N
DBH
(cm)
IVI
(%)
1
S. macrophyllus
392
9.7 ± 7.3
25.72
2
C. tonkinensis
29
67.1 ± 30.5
18.39
3
S. dives
117
18.8 ± 12.7
12.28
4
H. kuzii
94
12.7 ± 8.8
7.1
5
85 other species
374
ShannonWiener
Simpson
2.78
0.82
Shade tolerance
& lower storey
Light demanding
& fast growing
Middle storey
Shade tolerance
& middle storey
36.51
In Cuc Phuong NP plot, the density of trees
was quite high 1,006 trees/ha (DBH ≥ 2.5 cm).
In total, 89 species were identified in this study
plot and belonged to 24 families with the
diversity indices: Shannon - Weiner (H’) =
2.78; Simpson (D) = 0.82. The average size of
S. macrophyllus was small (9.7 ± 7.3 cm).
Based on IV (%), it can be seen that S.
macrophyllus with 3 other species: C.
tonkinensis, S. dives, H. kuzii were eligible to
form group of dominant tree species with total
IVI was 63.49%. Three of four given species
were shade tolerance and tend to grow in
middle and lower storeys.
As the results from three plots, the study
identified 11 species with highest IVI in Ba Vi
plot with total IVI was 41.66%, 4 species in
Cuc Phuong plot with total IVI was 63.49%.
Comparing diversity indices (D of
Simpson), Ba Vi plot performed the highest
values at 0.97 while Cuc Phuong plot had the
lowest one at 0.82. Thus, the levels diversity in
Ba Vi plot were strongly higher than Cuc
Phuong site. In addition, the values of
Shannon-Weiner (H’) of Ba Vi plot and Cuc
26
Properties
Phuong plot, were 3.36, 2.78. Therefore, Ba Vi
plot was at high level of population balance
and richness.
3.2. Spatial patterns analysis
Analysis 1: Environmental heterogeneity
effects
The spatial patterns of all adult trees (dbh ≥
15 cm) in study plots were contrasted to the
CSR null model to find significant departure at
large scales. We used both cumulative and
non-cumulative advantages of both L-function
and g-functions in this analysis, respectively.
The g-function showed that adults in all plots
were regular at small scales and that could be
evidences of strong tree-tree competition
(results not shown). Moreover, L-function also
showed no deviation from confidence
envelopes at larger scales (results not shown).
Therefore, no large scale departure from the
CSR null model was observed and the
hypothesis of environmental homogeneity was
accepted in the study plots. Based on this
finding, we applied the homogeneous gfunction for the further spatial pattern analyses
in this study.
JOURNAL OF FORESTRY SCIENCE AND TECHNOLOGY NO. 2 - 2018
Silviculture
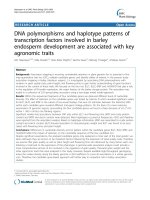
Analysis 2: Intraspecific spatial distributions
Figure 2. Spatial patterns of dominant tree species in Ba Vi plot analyzed by the pair correlation
function g11(r) under null model of CSR
Black liness are observed patterns; grey lines are approximate 95% confidence envelopes
JOURNAL OF FORESTRY SCIENCE AND TECHNOLOGY NO. 2 - 2018
27
Silviculture
In Ba Vi plot, intraspecific
ntraspecific spatial
distributions was analyzed by the pair
correlation function g11(r). E. wightiana was
aggregated at 1 - 4 m and at large scales of 8 15 m (Figure 2a). In contrast, X.
X noronhianum
showed a strong random distribution over the
entire range of scales up to 46 m (Figure
(
2b). N.
baviensis and Q. bambusifolia were aggregated
at the begging of scales of 0 - 2 m (Figure
(
2c)
and 1 - 4 m (Figure 2d). There
here was the same
clustered distribution of C. lenticellata, W. laevi
and A.globiflora at 0 - 2 m (Fig
Figure 2e, f, k). S.
baviense was clustered at small scales of 3 - 5 m
(Figure 2g). C. glaucescens was aggregate at
large scales of 1 - 6 m and 7 - 22 m (Figure 2i).
A. globiflora was random over the entire range
of scales up to 40 m (Figure
ure 2h).
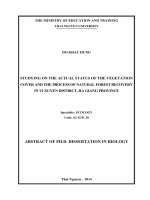
In Cuc Phuong plot, based
ased on IV
IVI, there were
4 species: S. macrophyllus
macrophyllus, C. tonkinensis, S.
dives, H. kuzii are considered as dominant tree
species and spatial distributions
butions were shown in
figure 3. S. macrophyllus was aggregated at 1 34 m (Figure 3a). C. tonkinensis and S. dives
also showed clustered distribution at 2 - 12 m
(Figure 3b) and 4 - 7 m (Fig
Figure 3c). C. tonkinensis
was random at small scales ((Figure 3d).
Figure 3. Spatial patterns of dominant tree species in Cuc Phuong plot analyzed by the pair
correlation function g11(r) under null model of CSR
Black lines are observed patterns; grey lines are approximate 95% confidence envelopes
Analysis 3: Interspecific spatial associations
As the results were analyzed by analyzed
by the bivariate pair correlation function g12(r)
under null model of random labeling, we
performed 90 bivariate point pattern analyzses
for all pairs of dominant species for Ba Vi
plot. Overall,
l, independence occurred more
frequently with 53.3%
28
3% while attraction 28.8%
and repulsion 17.9%.
9%. There were 13
significant positive interactions observed
28
between N. baviensis - E. wightiana; C.
glaucescens - E. wightiana; C. lenticellata - X.
noronhianum; S.. baviense - X. noronhianum;
A. globiflora - X. noronhianum; S. baviense N. baviensis; C. glaucescens - N. baviensis; C.
lenticellata - Q. bambusifolia; W. laevis - Q.
bambusifolia;
C.
zeylanicum
Q.
bambusifolia; A. globiflora - C. lenticellata; C.
zeylanicum - W. laevis; C. glaucescens - S.
baviense; C. glaucescens - C. zeylanicum.
JOURNAL OF FORESTRY SCIENCE AND TECHNOLOGY NO. 2 - 2018
Silviculture
Table 3. Spatial associations of dominant tree species in Ba Vi plot
No.
(1)
(2)
(3)
(4)
(5)
(6)
(7)
(8)
(9)
(10)
Species
E. wightiana
X. noronhianum
N. baviensis
Q. bambusifolia
C. lenticellata
W. laevis
S. baviense
C. zeylanicum
C. glaucescens
A. globiflora
(1)
0
+
0
0
+
0
(2)
0
+
+
0
0
+
(3)
+
0
0
+
0
+
0
(4)
0
+
+
0
+
0
0
(5)
0
+
0
+
0
0
0
0
+
(6)
0
+
0
0
+
0
0
(7)
+
+
0
0
0
0
+
0
(8)
0
0
+
0
+
0
0
0
(9)
+
0
+
0
0
0
+
0
-
(10)
0
+
0
0
+
0
0
0
-
Note: 0: independence; +: positive association (attraction); -:: negative association (repulsion)
(repulsion).
In contrast, repulsion occurred 8 times between
Q. bambusifolia - E. wightiana; S. baviense - E.
wightiana; C. zeylanicum - E. wightiana; N.
baviensis - X. noronhianum; Q. bambusifolia - X.
noronhianum; W. laevis - X. noronhianum; W.
laevis - N. baviensis; A. globiflora - C.
glaucescens. It can be seen that the interactions
y independence, for example: X.
are mostly
noronhianum - E. wightiana; C. lenticellata - E.
wightiana; C. zeylanicum - N. baviensis.
baviensis
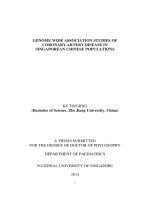
Spatial associations of 4 dominant tree
species in Cuc Phuong plot were showed and
analyzed with the bivariate pair
pair-correlation
function
on under null model of random labeling
(Figure 4).
). As the result, 2 pairs showed
repulsion and 4 pairs independence. S.
macrophyllus - H. kuzii (Figure 4b), S.
macrophyllus - C. tonkinensis (Figure 4c) were
relpusive associations. SS. macrophyllus - S.
dives (Figure 4a), S. dives - H. kuzii (Figure
4d), S. dives - C. tonkinensis (Figure 4e), H.
kuzii - C. tonkinensis (Figure 4f) were
independent in species interactions.
Figure 4. Association patterns of dominant tree species in Cuc Phuong analyzed by the bivariate pair
correlation function g12(r) under null model of random labeling
Black lines are observed patterns; grey lines are approximate 95% confidence envelopes
JOURNAL OF FORESTRY SCIENCE AND TECHNOLOGY NO. 2 - 2018
29
Silviculture
The independent interaction between tree
community structure. The findings can be used
species is a very common in tropical forest
as suggestions for silvicultural treatments and
with high level of diversity as in the study area.
biodiversity conservation of tropical rain
This is also explained by the fact that many
forests in study regions.
species have similar ecological characteristics
IV. DISCUSSION AND CONCLUSION
such as the demand of light or nutrition.
4.1. Species diversity of studied forest stands
The repulsive association of tree species is
The
research
has
been
conducted
explained by the fact that forest structure,
quantitatively to help clarify the characteristics
species composition and forest canopy are
of natural forests in Vietnam. Regarding the
altered by multiple impacts. This leads to light-
characteristics of tree species, the study
demanding and fast-growing species that tend
identified 11 species with highest IVI in Ba Vi
to grow, compete with other species, and
plot with total IVI is 41.66%, 4 species in Cuc
dominate the population.
Phuong plot with total IVI is 63.49%. Based on
A possible explanation is that attraction
IVI, it can be seen clearly that there are not
patterns are the result of facilitation at small
predominantly dominant tree species in Ba Vi
scales. Specifically, the local environment is
plot. However, the tree species are on the top
modified by large trees or canopy gaps and
of IVI still can associate with each other in
facilitates
inter-specific
order to form group of dominant tree species.
associations of trees with similar habitat
Especially, in Cuc Phuong plot, group of
preferences,
light
dominant species formed with less than 10
requirements in our case. Suzuki et al. (2012)
species and ∑ IVI ≥ 40%, will be named for
small
intra-
e.g.
with
and
similar
highlighted that an attraction pattern may result
from similarity in habitat preference of
whole community.
Comparing
diversity
indices
(D
of
spatially associated species. Alternatively,
Simpson), Ba Vi plot performed the highest
attraction patterns among species could be
values at 0.97 while Cuc Phuong plot has the
consistent with the species-herd protection
lowest one at 0.82. Thus, the levels diversity in
hypothesis which states that hetero-specific
Ba Vi plot is strongly higher than Cuc Phuong
neighbors
by
site. Moreover, the values of Shannon-Weiner
preventing the transmission of biotic plant
(H’) of 2 plots Ba Vi plot, Cuc Phuong plot are
pests (Peters, 2003; Lan et al., 2012).
3.36, 2.78. As the result, both values of (H’)
can
promote
coexistence
The two study plots are significantly
and (D) in Ba Vi plot are the highest
different in tree species structure, species
comparing with the others, so it would be a
diversity, and spatial patterns. The effects of
representative of a diverse and equally
forest disturbance by human activities were
distributed community.
emphasized
30
significantly
through
forest
JOURNAL OF FORESTRY SCIENCE AND TECHNOLOGY NO. 2 - 2018
Silviculture
spatial relations include repulsion, attraction
4.2. Spatial patterns analysis
Environmental heterogeneity effects
and independence. However, homogeneous
After using both cumulative and non-
environment, attractive and independent
cumulative advantages of both L-function and
interaction tend to increase. Especially, the
g-functions in this analysis, we can see that no
repulsive interactions between some tree
large-scale departure from the CSR null model
species Ba Vi plot and Cuc Phuong plot are
was
of
explained by negative interactions of tree
environmental homogeneity was accepted in
species. This leads to fast-growing, light
the study plots.
demanding species that tend to grow,
observed
and
the
hypothesis
Intraspecific spatial distributions
compete with other species, and dominate
In Ba Vi plot, almost the spacial
the population.
distributions are aggregation except X.
REFERENCES
noroniaum and A. globiflora are performed
1. Barot S. (2004). Mechanisms promoting plant
as strong random distribution. In Cuc
coexistence: can all the proposed processes be
Phuong plot, only C. tonkinensis was
reconciled? Oikos, 106(1): 185-192.
2. Chesson, P. (2000). General theory of competitive
random while the others were clustered.
coexistence
Thus, the cluster distribution is mainly due
Theoretical Population Biology, 58(3): 211-237.
in
spatially-varying
environments.
to the limited distribution of each species.
3. Getzin S., Wiegand T., Wiegand K. , He F.
The random distribution of a number of
(2008). Heterogeneity influences spatial patterns and
species studied can be controlled by a
variety
of
ecological
processes
or
demographics in forest stands. Journal Of Ecology,
96(4): 807-820.
4. Harms, K. E., Wright, S. J., Calderon, O.,
mechanisms or even human activities but
Hernandez, A. & Herre, E. A. (2000). Pervasive density-
due to the secondary forest status has been
dependent recruitment enhances seedling diversity in a
affected and the number of individuals of
tropical forest. Nature, 404(6777): 493-495.
these species is low, so this research cannot
find the root causes of this distribution.
5. Peters, H. A. (2003). Neighbour-regulated
mortality: the influence of positive and negative density
dependence on tree populations in species-rich tropical
Interspecific spatial associations
forests. Ecology Letters, 6(8): 757-765.
In Ba Vi plot, with 90 bivariate point
6. Seidler TG, Plotkin JB. (2006). Seed dispersal and
pattern analyzes, the independence occurred
spatial pattern in tropical trees. Plos Biology, 4(11):
more frequently with 53.3% while attraction
2132-2137.
7. Volkov, I., Banavar, J. R., He, F. L., Hubbell, S. P.
28.8% and repulsion 17.9%. In Cuc Phuong
& Maritan, A. (2005). Density dependence explains tree
plot, with 4 dominant species, the analyzes
species abundance and diversity in tropical forests.
showed 4 pairs of repulsion and 8 pairs of
Nature, 438(7068): 658-661.
independence.
Under
the
influence
heterogeneous
environmental
of
conditions,
8. Webb CO, Peart DR. (2000). Habitat associations
of trees and seedlings in a Bornean rain forest. Journal
of Ecology, 88(3): 464-478.
JOURNAL OF FORESTRY SCIENCE AND TECHNOLOGY NO. 2 - 2018
31
Silviculture
PHÂN TÍCH MÔ HÌNH PHÂN BỐ VÀ QUAN HỆ KHÔNG GIAN CỦA
MỘT SỐ CÁC LOÀI CÂY RỪNG LÁ RỘNG THƯỜNG XANH,
MIỀN BẮC VIỆT NAM
Phan Quốc Dũng1, Nguyễn Hồng Hải2
1,2
Trường Đại học Lâm nghiệp
TÓM TẮT
Các quá trình sinh thái rừng có thể được nghiên cứu thông qua phân bố không gian của các loài cây. Tuy nhiên,
mô hình phân bố của một số loài có thể bị ảnh hưởng bởi sự không đồng nhất của môi trường. Để trả lời cho
những câu hỏi như: Các kiểu phân bố cây cùng loài và khác loài phổ biến trong rừng mưa nhiệt đới là gì?
Những quá trình sinh thái nào ảnh hưởng tới sự cấu trúc và tổ thành đó? Phương pháp phân tích mô hình điểm
không gian đã được thực hiện với 2 ô tiêu chuẩn 1 ha tại Vườn Quốc gia Ba Vì và Vườn Quốc gia Cúc Phương.
Chúng tôi đã phân tích (i) Tác động của sự không đồng nhất môi trường tới sự phân bố của cây; (ii) Quan hệ
cùng loài và (iii) Quan hệ khác loài của các loài cây trong khu vực nghiên cứu. Kết quả nghiên cứu cho thấy: (i)
Các điều kiện môi trường là đồng nhất tại cả 2 ô tiêu chuẩn. (ii) Tại 2 ô tiêu chuẩn, hầu hết các loài cây ưu thế
có phân bố cụm lên tới 50 m do sự phát tán hạn chế của mỗi loài, trong khi các loài khác lại xuất hiện phân bố
ngẫu nhiên. (iii) Quan hệ tương hỗ và quan hệ độc lập giữa các loài cây là phổ biến hơn so với quan hệ cạnh
tranh. Nhìn chung, phân bố cụm của một loài có thể do sự phát tán hạt hạn chế hoặc do thiếu hụt các điều kiện
sống. Trong khi đó, phân bố ngẫu nhiên có thể được giải thích bởi sự ảnh hưởng từ các mối quan hệ cạnh tranh
hoặc do các tác động của con người. Quan hệ cạnh tranh giữa hai loài có thể do nhu cầu ánh sáng và dinh
dưỡng của mỗi loài.
Từ khóa: Môi trường không đồng nhất, phân tích mô hình điểm không gian, phía Bắc Việt Nam, rừng
nhiệt đới lá rộng.
Received
Revised
Accepted
32
: 02/01/2018
: 13/3/2018
: 20/3/2018
JOURNAL OF FORESTRY SCIENCE AND TECHNOLOGY NO. 2 - 2018