Tóm Tắt Chiến Lược Đại Dương Xanh
Bạn đang xem bản rút gọn của tài liệu. Xem và tải ngay bản đầy đủ của tài liệu tại đây (151.89 KB, 31 trang )
By: W. Chan Kim & Renee Mauborgne
Summary by: Jesse Starmer
COM 459
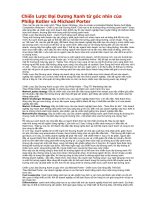
Value Innovation
Value innovation is created in the region where a company’s actions favorably affect both
its cost structure and its value proposition to buyers. Cost savings are made by
eliminating and reducing the factors an industry competes on. Buyer value is lifted by
raising and creating elements the industry has never offered. Over time, costs are
reduced further as scale economies kick in due to the high sales volumes that superior
value generates.
Costs
Value
Innovation
Buyer Value
Value Innovation
Red Ocean Versus Blue Ocean Startegy
In the red ocean, differentiation costs because firms compete with the
same best-practice principle. Here, the strategic choices for firms are to
pursue either differentiation or low cost. In the reconstructionist world,
however, the strategic aim is to create new best-practice rules by breaking
the existing value-cost trade-off and thereby creating blue ocean.
Red Ocean Strategy
Blue Ocean Strategy
Compete in existing market space.
Create uncontested market space.
Beat the competition.
Make the competition irrelevant.
Exploit existing demand.
Create and capture new demand.
Make the value-cost trade-off.
Break the value-cost trade-off.
Align the whole system of a firm’s
activities with its strategic choice of
differentiation or low cost.
Align the whole system of a firm’s
activities in pursuit of differentiation
and low cost.
Red Ocean Versus Blue Ocean Strategy
Red Ocean Strategy
Blue Ocean Strategy
The Six Principles of Blue Ocean Strategy
This figure highlights the six principles driving the successful formulation
and execution of blue ocean strategy and the risks that these principles
attenuate.
Formulation Principles
Reconstruct market boundaries
Focus on the big picture, not the numbers
Reach beyond existing demand
Get the strategic sequence right
Evaluation principles
Overcome key organizational hurdles
Build execution into strategy
Risk factor each principle attenuates
Search risk
Planning risk
Scale risk
Business model risk
Risk factor each principle attenuates
Organizational risk
Management risk
The Six Principles of Blue Ocean Strategy
Formulation Principles
Risk factor each principle attenuates
Evaluation principles
Risk factor each principle attenuates
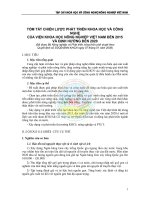
Strategy Canvas
The strategy canvas is both a diagnostic and an action framework for building a
compelling blue ocean strategy. It captures the current state of play in the known
market space. This allows you to understand where the competition is currently
investing, the factors the industry currently competes on in products, service, and
delivery, and what customers receive from the existing competitive offerings on the
market. The horizontal axis captures the range of factors the industry competes on
an invests in. The vertical axis captures the offering level that buyers receive
across all these key competing factors. The value curve then provides a graphic
depiction of a company’s relative performance across its industry’s factors of
competition.
High
Low
Price
Wine range
Above-the-line
Vineyard prestige
Use of
enological marketing Aging and legacy Wine
quality
complexity
terminology
Strategy Canvas
High
Low
Four Actions Framework +
Eliminate/Reduce/Raise/Create Grid
The four actions framework offers an
technique that breaks the trade-off between
differentiation and low cost and to create a
new value curve. It answers the four key
questions of what industry takes for granted
and needs to be eliminated; what factors need
to be reduced below industry standards; what
factors need to be raised above industry
standards; and what should be created that
the industry has never offered.
Eliminate
Enological terminology and
distinctions
Aging qualities
Raise
Price versus budget wines
Retail Store involvement
Above-the-line marketing
Reduce
Wine complexity
Create
Easy drinking
Wine range
Ease of selection
Vineyard prestige
Fun and adventure
Reduce
Which factors should be
reduced well below
industry standards?
Eliminate
Which of the factors
that the industry takes
for granted should be
eliminated?
A
New
Value
Curve
Create
Which factors should be
created that the industry
has never offered?
Raise
Which factors should
be raised well above
the industry’s
standard?
The eliminate-reduce-raise-create grid pushes
companies not only to ask all four questions in
the four actions framework but also to act on all
four to create a new value curve. By driving
companies to fill in the grid with the actions of
eliminating, reducing, raising, and creating, the
grid provides four immediate benefits: it pushes
them to simultaneously pursue differentiation and
low costs; identifies companies who are only
raising and creating thereby raising costs; makes
it easier for managers to understand and comply;
and it drives companies to scrutinize every factor
the industry competes on.
Four Actions Framework +
Eliminate/Reduce/Raise/Create Grid
Reduce
Four Actions Framework
Eliminate
Create
A New
Value
Curve
Raise
The Eliminate-Reduce-Raise-Create
Grid
Eliminate
Raise
Reduce
Create
Four Steps of Visualizing Strategy
The four steps of visualizing strategy builds on the six paths of creating blue
oceans and involves a lot of visual stimulation in order to unlock people’s
creativity. The four steps include visual awakening, visual exploration,
visual strategy fair, and visual communication.
1.
Visual
Awakening
•Compare your
business with your
competitors’ by
drawing your “as is”
strategy canvas.
•See where your
strategy needs to
change
2.
Visual
Exploration
3.
Visual Strategy
Fair
•Go into the field to
explore the six paths to
creating blue oceans.
•Draw your “to be” strategy
canvas based on insights
from field observations.
•Observe the distinctive
advantages of
alternative products and
services.
•Get feedback on
alternative strategy
canvases from customers,
competitors’ customers,
and noncustomers.
•See which factors you
should eliminate,
create, or change.
•Use feedback to build the
best “to be” future strategy.
4.
Visual
Communicatio
n
•Distribute your beforeand-after strategic profiles
on one page for easy
comparison.
•Support only those
projects and operational
moves that allow your
company to close the
gaps to actualize the new
strategy.
Four Steps of Visualizing Strategy
1.
Visual
Awakening
2.
Visual
Exploration
3.
Visual
Strategy Fair
4.
Visual
Communication
Pioneer, Settler, Migrator Map
A corporate management team pursuing profitable growth can plot the
company’s current and planned portfolios on a pioneer-migrator-settler
(PMS) map. This strategy can help a company determine which businesses
experience the highest and lowest growth and cash flow. These are
classified accordingly with the highest growth potential being pioneers, then
to migrators, then to the lowest rung, settlers.
Pioneers
Migrators
Settlers
Today
Tomorrow
Pioneer, Settler, Migrator Map
Pioneers
Migrators
Settlers
Today
Tomorrow
Three Tiers of Noncustomers
There are three tiers of noncustomers that can be transformed into
customers. They differ in their relative distance from your market. The
first tier of customers minimally buy an industry’s offering out of necessity.
The second tier of noncustomers refuse to use your industries offerings.
The third tier are noncustomers who have never thought of your market’s
offerings as an option.
First
Tier
Your
Market
Second
Tier
Third
Tier
Three Tiers of Noncustomers
Sequence of Blue Ocean Strategy
Buyer utility
Is there exceptional buyer utility in your
business idea?
An important part of blue ocean strategy is to
“get the strategic sequence right.” This
sequence fleshes out and validates blue
ocean ideas to ensure their commercial
viability. This can then reduce business
model risk. In this model, potential blue
ocean ideas must pass through a sequence
of buyer utility, price, cost, and adoption. At
each step there are only two options: a “yes”
answer, in which case the idea may pass to
the next step, or “no”. If an idea receives a
no at any point, the company can either park
the idea or rethink it until you get a yes.
No-- Rethink
Yes
Price
Is your price easily accessible to the
mass of buyers?
No-- Rethink
Yes
Cost
Can you attain your cost target to profit
at your strategic price?
No-- Rethink
Yes
Adoption
What are the adoption hurdles in
actualizing your business idea? Are
you addressing them up front?
Yes
A Commercially
Viable Blue Ocean
Idea
No-- Rethink
Sequence of Blue Ocean Strategy
Buyer utility
No-- Rethink
Yes
Price
No-- Rethink
Yes
Cost
No-- Rethink
Yes
Adoption
No-- Rethink
Yes
A Commercially
Viable Blue Ocean
Idea
Buyer Utility Map
The buyer utility map helps managers look at this issue from the right
perspective. It outlines all the levers companies can pull to deliver exceptional
utility to buyers as well as the various experiences buyers can have with a
product or service.
The Six Stages of the Buyer Experience Cycle
The Six Utility Levers
Customer
Productivity
Simplicity
Convenience
Risk
Fun and
Image
Environmental
friendliness
1.
2.
3.
4.
5.
6.
Purchase
Delivery
Use
Supplements
Maintenance
Disposal
Buyer Utility Map
The Six Stages of the Buyer Experience Cycle
The Six Utility Levers
Customer
Productivity
Simplicity
Convenience
Risk
Fun and
Image
Environmental
friendliness
1.
2.
3.
4.
5.
6.
Purchase
Delivery
Use
Supplements
Maintenance
Disposal
Buyer Experience Cycle
A buyer’s experience can usually be broken into a cycle of six stages,
running more or less sequentially from purchase to disposal. Each
stage encompasses a wide variety of specific experiences. At each
stage, managers can ask a set of questions to gauge the quality of
buyer’s experience.
Purchase
Delivery
How long does it
take to find the
product you
need?
How long does
it take to get
the product
delivered?
Is the place of
purchase
attractive and
accessible?
How difficult is
it to unpack
and install the
new product?
How secure is
the transaction
environment?
Do buyers
have to
arrange
delivery
themselves? If
yes, how costly
and difficult is
this?
How rapidly can
you make a
purchase?
Use
Does the product
require training or
expert assistance?
Is the product easy to
store when not in
use?
How effective are the
product’s features
and functions?
Does the product or
service deliver far
more power or
options than required
by the average user?
Is in overcharged with
bells and whistles?
Supplements
Do you need other
products and
services to make
this product work?
If so, how costly are
they?
How much time do
they take?
How easy are they
to obtain?
Maintenance
Disposal
Does the product
require external
maintenance?
Does use of the
product create
waste items?
How easy is it to
maintain and
upgrade the
product?
How easy is it to
dispose of the
product?
How costly is
maintenance?
Are there legal
or
environmental
issues in
disposing of the
product safely?
How costly is
disposal?
Buyer Experience Cycle
Purchase
Delivery
Use
Supplements
Maintenance
Disposal
Uncovering Blocks to Buyer Utility
Uncovering blocks to buyer utility can identify the most
compelling hot spots to unlock exceptional utility. By locating
your proposed offering on the thirty-six space of the buyer utility
map, you can clearly see how, and whether the new idea not only
creates a different utility proposition from existing offerings but
also removes the biggest blocks to utility that stand in the way of
converting noncustomers into customers.
Purchase
Delivery
Use
Supplements
Maintenance
Disposal
Customer Productivity:
In which stage are the biggest blocks to customer productivity?
Simplicity:
In which stages are the biggest blocks to simplicity?
Convenience:
In which stage are the biggest blocks to convenience?
Risk:
In which stage are the biggest blocks to reducing risks?
Fun and Image:
In which stage are the biggest blocks to fun and image?
Environmental
Friendliness:
In which stage are the biggest blocks to environmental friendliness?
Uncovering Blocks to Buyer Utility
Purchase
Delivery
Customer Productivity:
Simplicity:
Convenience:
Risk:
Fun and Image:
Environmental
Friendliness:
Use
Supplements
Maintenance
Disposal