Growth of a cohort of very low birth weight infants in Johannesburg, South Africa
Bạn đang xem bản rút gọn của tài liệu. Xem và tải ngay bản đầy đủ của tài liệu tại đây (381.28 KB, 6 trang )
Mackay et al. BMC Pediatrics 2011, 11:50
/>
RESEARCH ARTICLE
Open Access
Growth of a cohort of very low birth weight
infants in Johannesburg, South Africa
Cheryl A Mackay*, Daynia E Ballot and Peter A Cooper
Abstract
Background: Little is known about the growth of VLBW infants in South Africa. The aim of this study was to assess
the growth of a cohort of VLBW infants in Johannesburg.
Methods: A secondary analysis of a prospective cohort was conducted on 139 VLBW infants (birth weight ≤1500
g) admitted to Charlotte Maxeke Johannesburg Academic Hospital. Growth measurements were obtained from
patient files and compared with the World Health Organization Child Growth Standards (WHO-CGS) and with a
previous cohort of South African VLBW infants. The sample size per analysis ranged from 11 to 81 infants.
Results: Comparison with the WHO-CGS showed initial poor growth followed by gradual catch up growth with
mean Z scores of 0.0 at 20 months postmenstrual age for weight, -0.8 at 20 months postmenstrual age for length
and 0.0 at 3 months postmenstrual age for head circumference. Growth was comparable with that of a previous
cohort of South African VLBW infants in all parameters.
Conclusions: Initial poor growth in the study sample was followed by gradual catch up growth but with
persistent deficits in length for age at 20 months postmenstrual age relative to healthy term infants.
1.0 Background
The problem of very low birth weight (VLBW) infants,
with their attendant complications, is a significant one.
A VLBW (birth weight <1500 g) rate of 3% has been
reported at Chris Hani Baragwanath Hospital in Soweto
for the years 2000-2002 [1], this compared with 1.43%
in the USA [2]. The survival of VLBW infants has
improved steadily over the last 50 years which raises a
number of management dilemmas, including provision
of optimal nutrition and appropriate growth monitoring.
Growth monitoring has been shown to be useful and
cost effective as a tool in primary health care [3] and is
of particular importance in a developing country such as
South Africa where there are high rates of malnutrition
and VLBW births [4]. Growth monitoring in VLBW
infants is, however, complicated by several factors.
Firstly, the growth of VLBW infants is characterized by
early suboptimal growth followed by a period of catch
up growth [5,6]. Secondly, VLBW infants are a heterogeneous group of varying birth weights, sex, gestational
ages, associated morbidities and appropriateness for
gestational age, all factors which affect growth [5,7,8].
Thirdly, controversy surrounds the ideal growth of
VLBW infants: rapid catch up growth is advantageous
with respect to improved neurodevelopmental outcomes,
fewer psychosocial problems in later childhood and
lower risk of persistent short stature but may be associated with an increased risk of childhood obesity and
other metabolic complications [5,9].
There is a paucity of recent data on the growth patterns
of VLBW infants in general and even less on the growth
of VLBW infants in South Africa. This study aims to
compare the growth of a recent cohort of South African
VLBW infants with references from healthy term infants
in order to assess the rate and degree of catch up growth.
In addition, the sample is compared with a previous
cohort of South African VLBW infants in order to assess
growth relative to a comparable sample.
2.0 Methods
2.1 Subjects
* Correspondence:
Department of Paediatrics and Child Health, Charlotte Maxeke Johannesburg
Academic Hospital and University of the Witwatersrand, Johannesburg,
South Africa
A secondary analysis of a prospective cohort of VLBW
infants in Johannesburg was conducted. The cohort was
derived from the prospective “Outcome review of very
© 2011 Mackay et al; licensee BioMed Central Ltd. This is an Open Access article distributed under the terms of the Creative Commons
Attribution License ( which permits unrestricted use, distribution, and reproduction in
any medium, provided the original work is properly cited.
Mackay et al. BMC Pediatrics 2011, 11:50
/>
low birth weight infants in Johannesburg” study (unpublished), which was undertaken to determine neurodevelopmental outcomes of a cohort of VLBW infants.
Growth was not the primary focus of the original study.
Inclusion and exclusion criteria for the study were as
follows:
2.1.1 Inclusion Criteria
(i) Birth weight ≤1500 g
(ii) Admission to Charlotte Maxeke Johannesburg
Academic Hospital (CMJAH) between 1 July 2006 and
28 February 2007 (both inborn and outborn infants)
(iii) Attendance of at least one post discharge follow
up visit
2.1.2 Exclusion Criteria
(i) Death prior to hospital discharge
(ii) Transfer to another hospital prior to discharge
One hundred and thirty nine infants attended at least
one post discharge follow up visit and were included in
the current study. Gestational age was determined by a
combination of maternal dates, first trimester sonar (this
was seldom available) and Ballard score [10]. The Ballard score [10] was performed by 5 resident doctors
over the 8 month inclusion period and was performed
within 72 hours of birth. Age is described as postmenstrual age. Trophic feeds (maternal breast milk or
preterm formula) were commenced at 24 - 48 hours of
life in infants forming part of the study. Feeds were
increased by 20 ml/kg/day to a maximum of 160 ml/kg/
day. Although several infants were exclusively breastfed
post discharge, none were exclusively breastfed in hospital and feeds were supplemented with preterm formula.
Parenteral nutrition was commenced where enteral
feeds were either contraindicated or not tolerated but
was not used routinely in all VLBW infants. Feeds were
changed from preterm to term infant formula once a
weight ≥1500 g was reached due to resource limitations.
Infants were discharged at a minimum of 1600 g once
medically stable. All study participants attended their
first follow up clinic at or after term corrected for
prematurity.
2.2 Data collection
Infants were followed up at CMJAH at 4 weeks post discharge and at 3 monthly intervals thereafter. Age at discharge was not the same for all infants and some infants
did not keep scheduled appointments. For these reasons
age at follow up was not consistent. Growth parameters,
including weight (measured on a “Seca” electronic
scale), length (measured on a standard length board)
and head circumference (measured with a non-deformable measuring tape) were recorded at each visit by the
same nursing sister. Intercurrent history and physical
examination findings were documented by a pediatrician
at each visit. Patient files were reviewed retrospectively
Page 2 of 6
and relevant history, physical examination findings and
anthropometry were obtained. Data were analyzed at
postmenstrual age.
2.3 Data analysis
Two separate analyses of growth parameters were
conducted:
1. Comparison with healthy term infants using the WHO
Child Growth Standards (WHO-CGS) [11]
Growth parameters were entered into the WHO
Anthropometry statistical package version 2.0.4 [12]
using the expected date of delivery based on gestational
age assessment as the date of birth in order to correct
for prematurity. Growth was assessed according to
weight for age, length for age, weight for length and
head circumference for age. Sex and age appropriate
standard deviation (Z) scores were derived for each
measurement. The Z score was calculated as follows:
Z=
x−μ
σ
where Z = Z score
x = Individual or sample value
μ = Mean of WHO reference population
s = Standard deviation of WHO reference population
2. Comparison with other South African VLBW infants
The sample was compared with data from Cooper and
Sandler [13] (Soweto). The original study data were
used for analysis and are therefore presented differently
to the published form. Weight and length measurements
were compared at age groups 0-2 months, 6-8 months
and 11-13 months for male and female infants separately. Head circumference measurements were not
available for comparison. The data in both groups were
normally distributed and presented as mean and standard deviations. The unpaired t test was used to test statistical significance.
Statistical analysis was performed using Statistica version 8, series 0608, for Windows. Ethics approval for
this study was granted by the Human Research Ethics
Committee (HREC) of the University of the Witwatersrand. Informed consent was obtained from each patient
prior to enrolment in the original “Outcome review of
very low birth weight infants in Johannesburg” study.
3.0 Results
3.1 Sample characteristics
Descriptive and demographic data are presented in
Table 1. Of the 139 infants who attended at least one
follow up visit, 96 (69%) attended follow up to 12
months postmenstrual age. Of the 43 (31%) infants lost
to follow up after the first clinic visit, 3 (7%) had died, 3
(7%) had acquired a new caregiver either through adoption or placement with another family member, 11 (26%)
Page 3 of 6
Table 1 Clinical and Demographic Features of the Study
Sample (n = 139)
Variable
Number (%)
Mean
1199.6 g (1166.0;1233.2)1
<1000 g
21 (15%)
1000 - 1500 g
118 (85%)
Gestational Age:
Mean
31 weeks (30.5;31.5)1
Sex:
Male
49 (35.3%)
Female
90 (64.7%)
African
129 (92.8%)
Mixed
7 (5%)
Asiatic
2 (1.5%)
White
1 (0.7%)
Singleton
119 (85.6%)
Twins
18 (12.9%)
Race:
No. of babies:
Size for gestation:
Ventilation:
Feeding6:
HIV status:
2 (1.5%)
AGA2
71 (51.1%)
SGA3
68 (48.9%)
Nasal CPAP4
10 (7.2%)
IPPV5
Total
30 (21.6%)
40 (28.8%)
Breastfed
7 (5%)
Formula fed
109 (78.4%)
Mixed
23 (16.6%)
Exposed
31 (22%)
Unexposed
79 (57%)
10 (7%)
Unknown
19 (14%)
1
95% confidence interval; 2Appropriate for gestational age; 3Small for
gestational age; 4Continuous positive airway pressure; 5Intermittent positive
airway pressure; 6Feeding post discharge.
had relocated and 26 (60%) were unable to be traced. A
large proportion of the study sample (48%) was born
SGA, defined as a birth weight less than the 10th percentile for age and sex according to growth references by
Fenton [14]. Significant growth impairment was noted in
weight and length in the SGA group as presented in
Table 2.
3.2 Growth Measurements and Analysis
3.2.1 Comparison with healthy term infants
The mean and 95% confidence intervals (CI) for Z
scores of weight, length and head circumference for the
Table 2 Growth parameters at 12 months postmenstrual
age in infants born SGA and those born AGA
AGA1 (Mean ± SD)
SGA2 (Mean ± SD)
p value3
Weight (kg)
9.01 ± 1.31 (n = 19)
7.71 ± 1.26 (n = 18)
0.004
Length (cm)
72.51 ± 3.39 (n = 19)
68.9 ± 4.23 (n = 18)
0.007
HC4 (cm)
45.71 ± 1.16 (n = 16)
45.08 ± 1.54 (n = 17)
0.19
1
2
0
-0.5
-1
-1.5
-2
-2.5
-3
-3.5
0 1 2
n=17 73 33
3 4 5 6 7 8 9 10 11 12 13 14 15 16 17 18 19 20
28 45 33 21 35 28 30 31 23 37 19 12 17 12 16 21 19 12
Postmenstrual age (months)
Triplets
Refused testing
1
0.5
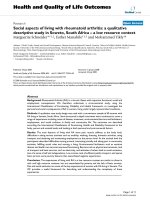
Figure 1 Line graph representing weight for age Z scores for
male and female infants combined. Data points represent mean
values; error bars represent 95% confidence intervals of the mean.
3
AGA = Appropriate for gestational age; SGA = Small for gestational age; p
value determined using the unpaired t test; 4HC = Head circumference
study sample with reference to the WHO-CGS are
shown in Figures 1,2,3 and 4. Error bars signify the 95%
confidence interval of the sample mean. The mean Z
score for weight for age declined from -1.3 at term postmenstrual age to -2.7 at 2 months postmenstrual age
after which there was a gradual increase to 0 by 20
months postmenstrual age in keeping with catch up
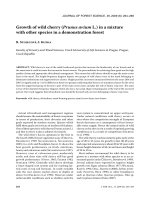
growth. The mean length for age Z score was -2.3 at
term postmenstrual age and initially declined to a low of
-4.1 at 2 months postmenstrual age followed by a gradual increase to -0.8 at 20 months postmenstrual age.
Length for age parameters failed to show complete
catch up growth by 20 months postmenstrual age relative to the WHO-CGS. Infants in the current sample
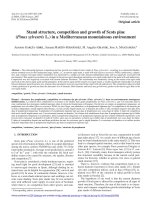
had weight in excess of length compared with the
WHO-CGS in early infancy (mean Z score 1.3 at 2
months postmenstrual age). This corrected after 2
months postmenstrual age and by 6 months postmenstrual age the mean weight for length Z score was 0. The
mean head circumference for age Z score decreased
0
Z score derived from WHO reference population
Birth weight:
Z score derived from WHO reference population
Mackay et al. BMC Pediatrics 2011, 11:50
/>
-0.5
-1
-1.5
-2
-2.5
-3
-3.5
-4
-4.5
-5
0 1
n=17 73
2
3
4
5
33 28 45 33
6
7
8
9 10 11 12 13 14 15 16 17 18 19 20
21 35 28 30 30 23 37 19 12 17 12 16 21 19 12
Postmenstrual age (months)
Figure 2 Line graph representing length for age Z scores for
male and female infants combined. Data points represent mean
values; error bars represent 95% confidence intervals of the mean.
Z Score derived from WHO reference population
Mackay et al. BMC Pediatrics 2011, 11:50
/>
Page 4 of 6
from 0 at term postmenstrual age to -1.2 by 2 months
postmenstrual age followed by an increase to 0.0 by 3
months postmenstrual age in keeping with rapid catch
up in head circumference growth.
2
1.5
1
0.5
3.2.2 Comparison with South African VLBW infants
0
-0.5
-1
-1.5
-2
0 1 2 3 4 5 6 7 8 9 10 11 12 13 14 15 16 17 18 19 20
n=17 73 33 28 45 33 21 35 28 30 30 23 37 19 12 17 12 16 21 19 12
Postmenstrual age (months)
Figure 3 Line graph representing weight for length Z scores
for male and female infants combined. Data points represent
mean values; error bars represent 95% confidence intervals of the
mean.
Z score derived from WHO reference population
2
1.5
1
0.5
0
-0.5
-1
-1.5
-2
0 1 2 3 4 5 6 7 8 9 10 11 12 13 14 15 16 17 18 19 20
n=17 71 33 28 44 32 19 33 28 30 28 21 33 19 12 17 11 13 18 18 12
Postmenstrual age (months)
Figure 4 Line graph representing head circumference for age Z
scores for male and female infants combined. Data points
represent mean values; error bars represent 95% confidence
intervals of the mean.
Weight and length parameters for male and female
infants in the current study sample and in a previous
South African sample studied by Cooper and Sandler
[13] are presented in Table 3. Both male and female
infants in the study sample were significantly shorter at
0 - 2 months postmenstrual age than those in the study
by Cooper and Sandler [13]. There were no other significant differences between the two samples for weight or
length parameters. Head circumference data were not
available for comparison.
4.0 Discussion
In summary, the study sample showed a pattern of
initial poor growth followed by gradual catch up growth
relative to healthy term infants (WHO-CGS) [11].
Growth closely resembled that of a previous cohort of
South African VLBW infants in all parameters with the
exception of length for age at 0 - 2 months postmenstrual age.
Initial suboptimal growth relative to term infants is
characteristic of VLBW infants and has been found in
other studies [5]. This early poor growth is predominantly due to loss of body water in the early neonatal
period and subsequently inadequate nutritional intake
[15,16] and has been shown to be more pronounced
with greater degrees of prematurity [5,8]. The period of
suboptimal growth in the current study was followed by
catch up growth which was most rapid with respect to
head circumference, followed by weight and slowest
with respect to length.
Table 3 Weight and length parameters of male and female infants according to age for the current sample with
reference to a previous cohort of South African VLBW infants
Male Weight (kg):
Length (cm):
Female Weight (kg):
Length (cm):
1
Age (months)1
n(1)2
Mean ± SD(1)2
n(2)3
Mean ± SD(2)3
P4
0-2
39
3.23 ± 0.58
42
3.20 ± 0.54
0.83
6-8
38
7.54 ± 1.09
30
7.17 ± 1.38
0.22
11-13
23
8.69 ± 1.56
29
8.69 ± 0.98
0.99
0-2
39
49.76 ± 2.57
42
47.57 ± 2.18
<0.01
6-8
38
65.56 ± 2.90
30
64.49 ± 3.29
0.16
11-13
23
72.0 ± 4.02
29
71.93 ± 1.96
0.94
0-2
39
3.23 ± 0.79
81
3.36 ± 0.61
0.76
6-8
36
7.19 ± 0.96
52
7.10 ± 0.98
0.66
11-13
26
8.28 ± 1.26
50
8.35 ± 1.02
0.8
0-2
38
49.91 ± 2.88
81
47.99 ± 2.27
<0.01
6-8
35
64.86 ± 2.48
52
64.13 ± 2.43
0.18
11-13
26
70.24 ± 3.26
50
70.92 ± 3.03
0.38
Postmenstrual age; 2Sample 1: Data from Cooper and Sandler13; 3Sample 2: Data from the current study; 4p value calculated using the unpaired t test
Mackay et al. BMC Pediatrics 2011, 11:50
/>
Catch up growth with respect to length for age
remained incomplete by 20 months postmenstrual age
in the current sample. This is possibly due to the large
percentage of infants in the study born SGA (48%)
which is known to be associated with slower catch up
growth [8]. The high prevalence of HIV, maternal
undernutrition, poor socioeconomic circumstances and
severe maternal disease seen as a result of CMJAH
being a referral institution contribute towards the large
proportion of infants born SGA. Previous studies, notably that by Bertino et al [8], show significant growth
impairment after hospital discharge in this group.
Although the prevalence of HIV exposure in the sample is high, the rate of mother to child transmission is
low (none of the infants tested in the current sample
tested positive for HIV). Slower catch up growth in
length therefore cannot be ascribed to HIV positivity.
Our findings do, however, correspond well with the
known burden of stunting in South African children
[4,13]. In a 2008 Unicef report on “The State of the
World’s Children”, 25% of South African children under
five years of age were reported as being stunted [4].
Genetic and ethnic factors also play a role in determining a child’s final height [17] and may have contributed
to slower catch up in length for age in the sample.
Unfortunately parental heights were not available for
consideration in the current study. It is important to
note that had the sample been followed up for a longer
period of time catch up in length may in fact have been
complete.
VLBW infants in the current study had a pattern of
excess weight relative to length between term and 4
months postmenstrual age. This has been reported previously [5] and may be due to the VLBW infant’s propensity for excess abdominal fat deposition in the
neonatal period [18,19].
The process of catch up growth is most rapid in the
first 6 months of life and usually continues up to 2
years postmenstrual age but in some cases continues
into childhood and even adulthood [5,9]. Catch up
growth is associated with improved neurodevelopmental
outcomes, fewer psychosocial problems in later childhood, and lower risk of persistent short stature especially if complete by 12 months of age [6,20]. It does
however increase the risk of cardiovascular and metabolic disease, including overweight and obesity, in later
childhood and adulthood, most especially with rapid
gain in weight in the first few months of life [18,21,22].
Possible strategies to prevent excessively rapid catch up
growth include limiting the extent of early growth failure, the promotion of breastfeeding and the use of a
VLBW reference for growth monitoring in infancy.
There are currently, however, no evidence-based guidelines for limiting or controlling the rate of catch up
Page 5 of 6
growth in VLBW infants and this area requires further
research.
The choice of growth reference determines whether
an infant is assessed as having optimal or suboptimal
growth. Neither the WHO-CGS nor the currently available references based on VLBW infants are ideal for
monitoring the growth of VLBW infants in the first 2
years of life. The development of a growth reference
specific for preterm and VLBW infants is, however, difficult as many of these infants have significant morbidity
in the neonatal period and infancy making it difficult to
accumulate a large, representative sample of “healthy”
VLBW infants. Ongoing research is required, ideally
with multicentre collaboration nationally and internationally, in order to develop a growth standard based on
a large, representative sample of VLBW infants.
The current study had several limitations. Even
though data was collected prospectively, the primary
goal of the initial study was neurodevelopmental outcomes and not growth per se. As a result, detailed nutritional history and parental heights were not available. In
addition, we were not able to measure growth parameters at specific ages with the result that, even though
the initial cohort consisted of 139 infants, the sample
size for any given age group ranged from 11 to 81. This
was compounded by 31% loss to follow up following the
first post discharge visit which may have affected the
results obtained. An additional limitation is the lack of
detailed information regarding length of hospital stay
and time to regain birth weight. This information was
unfortunately not available. Finally, the determination of
gestational age was largely dependent upon the Ballard
score. The Ballard score is known to overestimate gestational age by approximately 2 weeks [23] and in the current study was performed by junior attending staff
which may have lead to further inaccuracies. Gestational
age was similarly assessed by Ballard score [10] in the
study by Cooper and Sandler [13] due to information
regarding maternal menstrual dates being unreliable or
unavailable. The similar methodology in gestational age
assessment strengthens the conclusions that can be
drawn from the comparison between the two samples.
Despite these limitations, the study provides useful
information regarding the growth of VLBW infants in
Johannesburg.
5.0 Conclusion
The cohort of VLBW infants in the current study show
characteristic early growth failure followed by gradual
but, with regard to length, incomplete catch up growth
by 20 months postmenstrual age. Current recommendations for growth monitoring in this group, although not
evidence based, could include the use of VLBW growth
references up to 2 years postmenstrual age, the use of
Mackay et al. BMC Pediatrics 2011, 11:50
/>
term infant growth references after 2 years postmenstrual age, promotion of breastfeeding, and education of
caregivers and healthcare providers on expectations of
growth in premature and VLBW infants.
Authors’ contributions
CM was involved in study conception and protocol submission, data
collection and analysis and manuscript preparation. DB was involved in
study conception, data analysis and manuscript preparation. PC was
involved in data capturing and manuscript preparation. All authors have
read and approved the final manuscript.
Competing interests
The authors declare that they have no competing interests.
Received: 6 July 2010 Accepted: 29 May 2011 Published: 29 May 2011
References
1. Velaphi SC, Mokhachane M, Mphahlele RM, Beckh-Arnold E, Kuwanda ML,
Cooper PA: Survival of very-low-birth-weight infants according to birth
weight and gestational age in a public hospital. S Afr Med J 2005,
95(7):504-509.
2. Iyasu S, Tomashak K, Bayfield W: Infant Mortality and Low Birth Weight
among Black and White infants - United States 1980-2000. CDC Morbidity
and Mortality Weekly Report 2002, 51(27):589-592.
3. Fayter D, Nixon J, Hartley S, Rithalia A, Butler G, Rudolf M, Glasziou P,
Bland M, Stirk L, Westwood M: A systematic review of the routine
monitoring of growth in children of primary school age to identify
growth-related conditions. Health Technol Assess 2007, 11(22):iii, xi-xii,
1-163.
4. UNICEF: The State of the World’s Children 2008: Child Survival. 2008
[ />_2008.pdf], Accessed 06/10, 2009.
5. Niklasson A, Engstrom E, Hard AL, Wikland KA, Hellstrom A: Growth in very
preterm children: a longitudinal study. Pediatr Res 2003, 54(6):899-905.
6. Knops NB, Sneeuw KC, Brand R, Hille ET, den Ouden AL, Wit JM, VerlooveVanhorick SP: Catch-up growth up to ten years of age in children born
very preterm or with very low birth weight. BMC Pediatr 2005, 5:26.
7. Guo SS, Roche AF, Chumlea WC, Casey PH, Moore WM: Growth in weight,
recumbent length, and head circumference for preterm low-birthweight
infants during the first three years of life using gestation-adjusted ages.
Early Hum Dev 1997, 47(3):305-325.
8. Bertino E, Coscia A, Boni L, Rossi C, Martano C, Giuliani F, Fabris C, Spada E,
Zolin A, Milani S: Weight growth velocity of very low birth weight
infants: role of gender, gestational age and major morbidities. Early Hum
Dev 2009, 85(6):339-47.
9. Hack M, Schluchter M, Cartar L, Rahman M, Cuttler L, Borawski E: Growth of
very low birth weight infants to age 20 years. Pediatrics 2003, 112(1 Pt 1):
e30-8.
10. Ballard JL, Khoury JC, Wedig K, Wang L, Eilers-Walsman BL, Lipp R: New
Ballard Score, expanded to include extremely premature infants. J
Pediatr 1991, 119(3):417-423.
11. De Onis M, Garza C, Onyango AW, Martorell R: WHO Child Growth
Standards. Acta Paediatrica 2006, 95(Supplement 450).
12. WHO: WHO Anthro for personal computers: Software for assessing
growth and development of the world’s children. 2007, 2.
13. Cooper PA, Sandler DL: Outcome of very low birth weight infants at 12
to 18 months of age in Soweto, South Africa. Pediatrics 1997,
99(4):537-544.
14. Fenton TR: A new growth chart for preterm babies: Babson and Benda’s
chart updated with recent data and a new format. BMC Pediatr 2003,
3:13.
15. Embleton NE, Pang N, Cooke RJ: Postnatal malnutrition and growth
retardation: an inevitable consequence of current recommendations in
preterm infants? Pediatrics 2001, 107(2):270-273.
16. Bauer K, Bovermann G, Roithmaier A, Gotz M, Proiss A, Versmold HT: Body
composition, nutrition, and fluid balance during the first two weeks of
life in preterm neonates weighing less than 1500 grams. J Pediatr 1991,
118(4 (Pt 1)):615-620.
Page 6 of 6
17. Soranzo N, Rivadeneira F, Chinappen-Horsley U, Malkina I, Richards JB,
Hammond N, et al: Meta-analysis of genome-wide scans for human adult
stature identifies novel Loci and associations with measures of skeletal
frame size. PLoS Genet 2009, 5(4):e1000445.
18. Ong KK, Ahmed ML, Emmett PM, Preece MA, Dunger DB: Association
between postnatal catch-up growth and obesity in childhood:
prospective cohort study. BMJ 2000, 320(7240):967-971.
19. Uthaya S, Thomas EL, Hamilton G, Dore CJ, Bell J, Modi N: Altered
adiposity after extremely preterm birth. Pediatr Res 2005, 57(2):211-215.
20. Cooke RW, Foulder-Hughes L: Growth impairment in the very preterm
and cognitive and motor performance at 7 years. Arch Dis Child 2003,
88(6):482-487.
21. Barker DJ, Winter PD, Osmond C, Margetts B, Simmonds SJ: Weight in
infancy and death from ischaemic heart disease. Lancet 1989,
2(8663):577-580.
22. Stettler N, Zemel BS, Kumanyika S, Stallings VA: Infant weight gain and
childhood overweight status in a multicenter, cohort study. Pediatrics
2002, 109(2):194-199.
23. Wariyar U, Tin W, Hey E: Gestational assessment assessed. Arch Dis Child
Fetal Neonatal Ed 1997, 77(3):F216-20.
Pre-publication history
The pre-publication history for this paper can be accessed here:
/>doi:10.1186/1471-2431-11-50
Cite this article as: Mackay et al.: Growth of a cohort of very low birth
weight infants in Johannesburg, South Africa. BMC Pediatrics 2011 11:50.
Submit your next manuscript to BioMed Central
and take full advantage of:
• Convenient online submission
• Thorough peer review
• No space constraints or color figure charges
• Immediate publication on acceptance
• Inclusion in PubMed, CAS, Scopus and Google Scholar
• Research which is freely available for redistribution
Submit your manuscript at
www.biomedcentral.com/submit