Expression of Bt gene (cry1Ac) on different plant parts at different stages in Bt cotton genotypes
Bạn đang xem bản rút gọn của tài liệu. Xem và tải ngay bản đầy đủ của tài liệu tại đây (808.25 KB, 15 trang )
Int.J.Curr.Microbiol.App.Sci (2018) 7(1): 3339-3353
International Journal of Current Microbiology and Applied Sciences
ISSN: 2319-7706 Volume 7 Number 01 (2018)
Journal homepage:
Original Research Article
/>
Expression of Bt Gene (cry1Ac) on Different Plant Parts at
Different Stages in Bt Cotton Genotypes
B.H. Nagappa* and B.M. Khadi
Agricultural Research Station (UAS, Dharwad), Hanumanamatti, Ranebennur Taluk,
Haveri District, India
*Corresponding author
ABSTRACT
Keywords
Bt Gene (cry1Ac),
Bt Cotton
Genotypes, Gene
expression
Article Info
Accepted:
26 December 2017
Available Online:
10 January 2018
Cotton yield losses due to insect pests are estimated to be around 10 to 14 per cent every
year. These insect protected cotton varieties contain a naturally occurring substance,
Bacillus thuringiensis (Bt) protein which has been used as an ingredient in safe and
effective biological sprays for more than 50 years. Of the total available Bt cotton hybrids
in 2006, four different events containing Cry1Ac gene (MON 531 event) by Mahyco
sourced from Monsanto, stacked Cry X (Cry1Ac and Cry2Ab) gene event (MON 15985)
developed by Mahyco sourced from Monsanto, Cry1Ac gene (Event 1) by JK-seeds
sourced from IIT Kharagpur and fusion gene Cry1Ab and Cry1Ac (GF Mervent) by Nath
seeds sourced from China have received commercial approval for sale in Northern, Central
and Southern cotton growing zones. The expression of Bt gene varies with different parts
of plant. The Cry 1 Ac gene expression highest in leaf (4.31 g/g at 45 DAS) followed by
young boll (2.02 g/g at 105 DAS), flower (> 1.9 g/g 105 DAS), seeds (1.9 g/g 120
DAS and 1.49 g/g at 160 DAS and least in rind (0.63 g/g 105 DAS).
Introduction
Cotton has a proud place among the cash
crops from the earliest times. It finds mention
in the Rigveda the oldest scripture of the
Hindus. Manu, the law giver also referred to it
in his Dharma Shastra. It was the excellence
of Indian cotton fibres famed as webs of
woven wind which compelled European
countries to seek new trade routes with India.
Even though, nowadays advent of a multitude
of other fibres, cotton; white gold rules the
world of textile. So, it is unchallenged as a
natural textile fibre. It is an important fibre
and food crop of nearly 100 countries with
China, India, United States, Pakistan and
Brazil being five of the largest producers of
cotton.
In India, yields were low compared to world
average partly because of heavy losses from
insect pests particularly cotton bollworm
complex. Yield losses due to insect pests are
estimated to be around 10 to 14 per cent every
year. So, India is addressing the need for
increased Bt cotton cultivars. These insect
3339
Int.J.Curr.Microbiol.App.Sci (2018) 7(1): 3339-3353
protected cotton varieties contain a naturally
occurring substance, Bacillus thuringiensis
(Bt) protein which has been used as an
ingredient in safe and effective biological
sprays for more than 50 years. Bt trait has
been successfully transferred into several
Indian lines. Extensive and fully replicated
field trials of Bt cotton were conducted from
1998 to 2001 cropping seasons, meeting the
government
requirements
for
commercialization. Three Bt cotton cultivars
have been approved for planting in India in
2002-03.Since, the introduction of Bt cotton
hybrid around 44,500ha were planted with
three hybrids of Bt cotton in central and
southern zones in 2002-03 season. This
increased to some 1, 00,000 ha in 2003-04. In
2004-05 around four Bt cotton hybrids were
planted over 5, 00,000 ha by three lakh
resource poor farmers. With approval of 16
new hybrids of half a dozen companies
including six Bt cotton hybrids for northern
region, Bt cotton planting for 2005-06 season
has experienced the highest yearly percentage
growth rate increasing its area by 160 per cent
(13 lakh ha). Presently India has the fourth
largest area (11.57mh) after Argentine, Brazil
and USA under genetically modified Bt cotton
crops, according to the International service
for the Acquisition of Agri Biotech
Application (ISAAA). Area under Bt cotton
hybrids in northern, central and southern
cotton growing zones of India increased upto
96 percent in 2014 and production was 40
million bales from 13 million bales during the
year 2002.
about which varieties to cultivate. This
includes 14 hybrids containing three events to
be sold by thirteen companies in Southern
Zone of India. Of the total available Bt cotton
hybrids in 2006, four different events
containing Cry1Ac gene (MON 531 event) by
Mahyco sourced from Monsanto, stacked Cry
X (Cry1Ac and Cry2Ab) gene event (MON
15985) developed by Mahyco sourced from
Monsanto, Cry1Ac gene (Event 1) by JKseeds sourced from IIT Kharagpur and fusion
gene Cry1Ab and Cry1Ac (GF Mervent) by
Nath seeds sourced from China have received
commercial approval for sale in Northern,
Central and Southern cotton growing zones.
Till now there is not much information
regarding expression of Bt gene in different
genotypes at different stages of crop life and
different parts of the plant.
In a landmark decision, the Genetic
Engineering Approval Committee (GEAC) of
the Ministry of Environment and Forest
(MOEF) has approved 49 new hybrids of Bt
cotton varieties to sale this year in addition to
the 62 Bt cotton hybrids approved until 2006.
This brings the total of Bt cotton hybrids to
111 (49 approvals) giving farmers of India’s
three cotton growing zones more choices
Samples of squares, flower, boll, seed and leaf
were used for extracting the toxin. Desi Gen
Quan-T ELISA 96 well plate kits supplied by
Desi Gen Mahyco, Company Jalna,
Maharashtra, India were used to estimate the
toxin content in the plant parts. Distilled
water, Powder A, Powder B, 10x buffer, 1x
buffer, Extraction buffer, Cry1Ac stock
solution, AP conjugated Ab were supplied by
Materials and Methods
There are 36 hybrids Bt hybrids viz.,JKCH224,SDCH-302, K-5308, KDCH-441, JK
Indra, RCH-2,JK Ishwar, JKCH-1947,RCH134, JKCH-22, Ankur-651 BGI, Ankur-651
BGI,
RCH-144,
JKCH-1050,
SBCH311,PCH-2270,NECH-3R,
KDCHH-9810,
NECN-2R, RCH-118, JKCH-226, Dhruva, K5316, KDCHH-9632, JK Varun, RCH-2171,
RCH-20, JK Durga, JKCH-99, RCH-138,
JKCH-1945, JK Gowri, RCH-377, VCH-111,
NHH-44, VICH-5, VICH-5 and VICH-9 have
collected for expression of Cry 1Ac protein in
different parts of plant at different growth
stages of Bt cotton.
3340
Int.J.Curr.Microbiol.App.Sci (2018) 7(1): 3339-3353
the said company. The samples viz., squares
flower, bolls seed and leaf were collected in
ice box and carried to laboratory for further
analysis as per protocol provided with
quantification kit.
δ-endotoxin quantification protocol
Twenty mg of sample from each genotype was
weighed and placed in 1.5 ml microfuge tube
for further analysis. 500 µl of ice-cold 1×
sample extraction buffer was added (add 0.2 g
powder A and 12 g powder B to 100 ml
sample extraction buffer prepared freshly at
the time of sample extraction).
Samples were macerated manually and
contents were chilled on ice for 10 min and
again macerated for 30 sec. The contents were
spun at 8000 rpm in a micro centrifuge for 15
min and supernatant was pipetted out. Pipetted
supernatant was diluted to 1:4 proportion
using diluent buffer (diluent buffer : Add 100
ml of 10X buffer A1, dilute it to one litre by
using deionized water added with 0.5%
ovalbumin in 1X buffer).
Preparation of positive and negative QC
seed extract
500 µl 1X buffer A was added to the positive
and negative seed samples provided with the
kit. It was crushed well with a disposable
plastic pestle and spun for 30 sec in a micro
centrifuge at 2000 rpm and 100 µl of each
supernatant per well was used.
Standard curve generation
20 ng per ml working stock solution was
prepared from 20 µl per ml Cry1Ac stock
solution provided in 1X diluent buffer (add 20
µl Cry1Ac stock + 980 µl 1X diluent buffer).
Other quantification standards were prepared
as under.
Results and Discussion
With cotton attracting a wide range of pests
and the attendant high pesticide usage leading
to a polluted atmosphere and increased cost of
cultivation, a rethink was possible in the form
of environment friendly pest biocontrol
procedures. The introduction of Bt genes
(Cry1Ac) against bollworms into cotton has
revitalized cotton cultivation and made it
profitable again. In the present study, the
expression pattern of the Cry1Ac gene was
investigated so as to pave the way for further
studies relating it to insect control and
efficiency.
Several Bt hybrids have been released in India
and any Bt hybrid which produced Bt toxin
above the critical level in different parts of
plant and later stages of crop life span was
very important and formed a part of the
present investigation. The expression level of
Cry1Ac endotoxin protein was estimated in
leaves, flower, square, boll, rind and seed in
36 Bt hybrids at different stages of crop
growth and results are presented in Table 1, 2,
3, 4 and 5.
Quantitative
estimation
endotoxin in leaf
of
Cry1Ac
Dong and Lis (2007) reported variability in Bt
cotton efficacy in particular on induced
variability
by
environmental
stresses.
Insecticidal protein content in Bt cotton is
variable with plant age, plant structure or
under
certain
environmental
stresses.
Reduction of Bt protein content in late season
cotton could be due to the over expression of
Bt gene at earlier stages which leads to gene
regulation at post transcription levels and
consequently results in gene silencing at later
stages. Methylation of promoter may be also
involved in the declined expression of
endotoxin proteins. Kranthi et al., (2005) also
reported that Cry1Ac expression was variable
3341
Int.J.Curr.Microbiol.App.Sci (2018) 7(1): 3339-3353
among the hybrids and also between different
plant parts. The leaves of Bt cotton plants
were found to have the highest levels of
Cry1Ac expression followed by young boll,
bolls rind and then in flowers. The toxin
expression in the bolls rind, square bud and
ovary of flower was clearly inadequate to
confer full protection to fruiting parts. There
was a correlation between Cry1Ac expression
in Bt cotton and H. armigera mortality thus
identifying a critical expression level for
Cry1Ac at 1.9 g per g in tissue, below which
Helicoverpa armigera would be able to
survive.
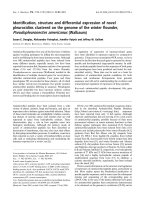
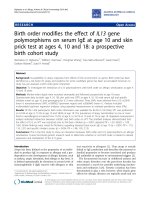
Level of Cry1Ac Bt protein (µg/g) in leaf at
different stages of crop growth of Bt cotton
hybrids have been presented in Table 1 and
Figure 1.
Cry1Ac Bt protein test started from 45 days
after sowing. In the leaf, on an average
Cry1Ac expression at 45 DAS was 4.21 g
per g and it declined to 1.83 g per gram at 90
DAS. The decline in Cry1Ac protein was
56.54 per cent. From 90 to 120 DAS decline
of Cry1Ac was 60.11 per cent. Mean Cry1Ac
level of 36 hybrids at 120 DAS was 0.73 g
per g. Average protein expression was 0.60 g
per g of leaf tissue at 140 DAS and revealed a
17.82 per cent decrease from 120 to 140 DAS.
At 160 DAS, 0.33 g per g Bt protein was
observed. The per cent of decline of Cry1Ac
from 140 to 160 DAS was 45 per cent in the
leaf.
A total of 36 hybrids were tested for
expression of Cry1Ac Bt protein, which
showed more than critical level (1.9 g/g) of
mortality at 45 DAS in leaf tissue. However,
hybrids JK-Gowri (0.03 g/g), JKCH-1050
(0.07 g/g) and JKCH-266 (0.08 g/g) were
exceptions to the above statement. At 90 DAS,
hybrids JKCH-1050 (0.09 g/g), SBCH-311
(1.10 g/g), PCH-2270 (1.62 g/g), NCEN-2R
(0.03 g/g), RCH-118 (1.73 g/g), JKCH-266
(0.08 g/g), K-5316 (1.04 g/g), JK-Varun
(0.28 g/g), JK-Gowri (0.09 g/g), VICH-111
(1.01 g/g), VICH-5 (0.62 g/g) and VICH-9
(1.68 g/g) had Cry1Ac protein production
significantly less than critical level (1.90
g/g). But rest of the hybrids (24) exhibited
Cry1Ac production significantly higher than
critical level (1.90 g/g) of mortality. At 120,
140 and 160 DAS Cry1Ac expression level of
all 36 hybrids was significantly less than
critical level (1.90 g/g). The Cry1Ac
expression showed a declining trend from 45
to 160 DAS. Similar results were observed by
Kranthi et al., (2005) and Dong and Lis
(2007).
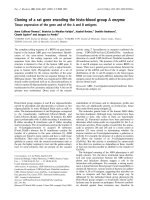
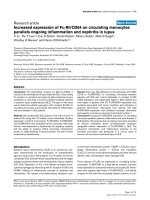
The endotoxin (Cry1Ac) content in boll rind at
different stages of crop growth is given in
Table 2 and Figure 2.
In the rind, Cry1Ac expression at 105, 120,
140 and 160 DAS was 0.63, 0.53, 0.43 and
0.23 g per g, respectively. The per cent of
Cry1Ac decline from 105 to 120, 120 to 140
and 140 to 160 DAS was 15.88, 18.87 and
46.51 per cent, respectively. None of the Bt
hybrids recorded Cry1Ac protein significantly
higher than critical level in the rind. Kranthiet
al., (2005) noticed 0.25 to 0.37 g per g
Cry1Ac protein in rind.
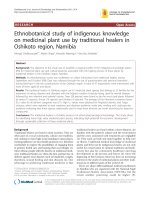
Endotoxin levels quantified in seeds at
different stages of crop growth is given in
Table 3 and Figure 3.
The expression of Cry1Ac at 105, 120, 140
and 160 DAS was 0.73, 1.90, 0.64 and 1.49 g
per g, respectively in seed tissue. The increase
of Cry1Ac from 105 to 120 DAS was 160 per
cent. From 120 to 140 DAS, decrease of
Cry1Ac protein was 66.31 per cent. The
increase of Cry1Ac from 140 to 160 DAS was
132.8 per cent. At 105 and 140 DAS, none of
the Bt hybrids had higher than 1.90 g per g
of Cry1Ac protein in seeds. Like in leaf and
rind, the levels of Cry1Ac in seed also
3342
Int.J.Curr.Microbiol.App.Sci (2018) 7(1): 3339-3353
decreased from 120 to 140 DAS (0.64g/g)
but again Cry 1 Ac protein production
increase from 140 DAS to160 DAS by132.8
per cent.
The Bt hybrids viz., JKCH-2245 (1.87 g/g),
SBCH-302 (2.33 g/g), K-5038 (2.58 g/g),
JKCH-1947 (3.22 g/g), JKCH-22 (3.35
g/g), RCH-144 (1.84 g/g), SBCH-311 (4.15
g/g), PCH-2270 (2.90 g/g), KDCHH-9810
(1.92 g/g), RCH-118 (1.18 g/g), Dhruva
(4.17 g/g), K-5316 (2.20 g/g), KDCHH9632 (2.28 g/g), JK-Varun (2.33 g/g),
RCH-20 (1.87 g/g), JK-Durga (3.01 g/g),
JKCH-1945 (2.11 g/g), VICH-111 (1.88
g/g), VICH-5 (1.87 g/g) were noticed to
have Cry1Ac protein in seed significantly
higher than critical level (1.90 g/g) at 120
DAS. The Bt hybrids viz., JKCH-2245 (1.87
g/g), JKCH-22 (2.59 g/g), SBCH-311 (2.87
g/g), Dhruva (2.34 g/g), JK-Varun
(2.21g/g)and JK-Durga (2.61 g/g) showed
Cry1Ac protein more than critical level at 160
DAS in seed tissue.Kranthiet al., (2005)
reported 1.77 + 0.23 g per g Cry1Ac protein
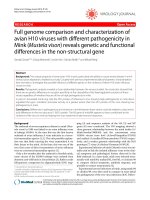
content in seeds. The Cry1Ac endotoxin level
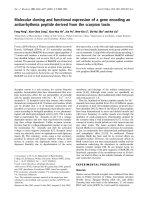
in flower at different stages of the crop has
been presented in Table 4 and Figure 4.
None of the Bt hybrids had significantly
higher Cry1Ac protein than critical level
required for mortality (1.90 g/g) of pink boll
worm at 105 and 140 DAS in the flower. But,
at 120 DAS, hybrids JKCH-1947 (2.36 g/g),
RCH-134 (2.36 g/g), JKCH-22 (2.11 g/g),
Ankur-651 (3.25 g/g) and JKCH-29 (2.21
g/g) recorded Cry1Ac protein significantly
higher than critical level (1.90 g/g). There
was a decrease in the Cry1Ac protein level
from 120 to 140 DAS. Rest of the hybrids
exhibited Cry1Ac protein lesser (1.20 g/g)
than critical level (1.90 g/g) in flower.
The estimated quantity of Cry1Ac protein in
young bolls is presented in Table 5 and Figure
5. The Cry1Ac expression at 105, 120 and 140
DAS in young boll was 2.20, 0.96 and 0.32 g
per g. The per cent decrease of Cry1Ac
protein from 105 to 120 DAS was 56.36. From
120 to 140 DAS, decrease of Cry1Ac protein
was 66.67 per cent.
The hybrids viz., JKCH-2245 (1.88 g/g),
SBCH-302 (2.44 g/g), RCH-2 (2.40 g/g),
JK-Ishwar (2.49 g/g), JKCH-1947 (4.29
g/g), RCH-134 (2.61 g/g), JKCH-22 (2.07
g/g), Ankur-651 (1.98 g/g), RCH-144 (2.85
g/g), SBCH-311(2.11 g/g), PCH-2270 (1.90
g/g), NCEN-3R (3.33 g/g), KDCHH-9810
(2.66 g/g), Dhruva (2.02 g/g), KDCHH9632 (2.74 g/g), JK-Varun (4.41 g/g),
RCH-2171 (1.97 g/g), JK-Durga (4.11 g/g),
JKCH-99 (2.89 g/g), RCH-138 (1.98 g/g),
JKCH-1945 (4.32 g/g), RCH-377 (2.71
g/g), VICH-111 (2.76 g/g), VICH-5 (2.20
g/g) and VICH-9 (2.88 g/g) showed
significantly higher Cry1Ac protein than the
critical level (1.90 g/g) at 105 DAS, while at
120 DAS, JKCH-2245 (2.39 g/g), JKCH-99
(3.46 g/g) and K-5038 (2.85 g/g) only had
Cry1Ac protein significantly higher than
critical level in young boll. All 36 hybrids
produced Cry1Ac protein lesser than critical
level (1.90 g/g) in young boll at 140 DAS.
Summary
In leaf tissue all tested hybrids produced
higher Cry 1Ac protein than critical level
(1.9g/g) except JKCH-1050 and JKCH-226
at the stage of 45 DAS. After 90 days Cry 1Ac
protein more than critical level especially in
JKCH-2245, SBCH-302, K-5308, KDCHH441, JK-Indra, RCH-2, JK-Iswar, JKCH-1947,
RCH-134, JKCH-22, Ankur-651, RCH-144,
NCEN-3R, KDCHH-9810, Druva, RCH-2171,
RCH-20, RCH-138, JKCH-1945, RCH-377
and NHH-44 but none of Bt hybrid exhibited
more than critical level (1.9 g/g) at the stage
of 120DAS, 140 DAS and 160 DAS.
3343
Int.J.Curr.Microbiol.App.Sci (2018) 7(1): 3339-3353
Table.1 Cry1Ac endotoxin (g/g) content in leaf at different stages of crop growth of Bt cotton
genotypes at Dharwad
Sl.
No.
1.
2.
3.
4.
5.
6.
7.
8.
9.
10.
11.
12.
13.
14.
15.
16.
17.
18.
19.
20.
21.
22.
23.
24.
25.
26.
27.
28.
29.
30.
31.
32.
33.
34.
35.
36.
Bt genotypes
JKCH-2245
SBCH-302
K-5308
KDCHH-441
JK Indra
RCH-2
JK Ishwar
JKCH-1947
RCH-134
JKCH-22
Ankur-651 BGI
RCH-144
JKCH-1050
SBCH-311
PCH-2270
NECH-3R
KDCHH-9810
NCEN-2R
RCH-118
JKCH-226
Dhruva
K-5316
KDCHH-9632
JK Varun
RCH-2171
RCH-20
JK Durga
JKCH-99
RCH-138
JKCH-1945
JK Gowri
RCH-377
VICH-111
NHH-44
VICH-5
VICH-9
Grand mean
SEm+
CD at 5%
CD at 1%
CV (%)
45 days
90 days
120 days
140 days
160 days
5.27**
3.52
3.44
4.02
3.84
4.73
4.44
6.73**
5.13**
6.41**
4.70
4.86
0.07
3.63
4.51
2.89
4.64
4.87**
3.52
0.08
3.60
2.56
4.10
6.07**
5.49**
4.15
7.26**
3.72
3.72
5.85**
0.03
5.25**
4.96**
4.20
2.71
5.69**
4.21
0.035
0.10
0.13
1.19
2.85**
2.13
2.02
2.25
2.21
2.79
2.25
3.48**
2.79
3.04**
1.99
2.95**
0.09
1.10
1.62
2.21
2.26
0.03
1.73
0.08
2.40
1.04
1.93
0.28
2.64
2.23
1.84
1.84
1.95
2.20
0.09
2.39
1.01
1.90
0.62
1.68
1.83
0.0117
0.033
0.045
0.90
0.64*
0.39
0.58**
0.46
0.69**
0.53
0.99**
1.59**
0.94**
0.99**
0.57**
0.69**
0.08
1.00**
0.67**
1.09**
0.64**
0.02
0.90**
0.01
1.15**
1.08*
1.09*
0.99**
0.98**
0.69**
1.02**
0.52
0.55
0.83**
0.01
1.00**
0.53
0.55
0.80**
0.83**
0.73
0.0092
0.026
0.035
1.792
0.41**
0.99**
0.88**
0.37
0.45**
0.37
0.85**
1.35**
0.53**
0.85**
0.49**
0.51**
0.06
0.82**
0.52**
1.03**
0.44**
0.04
0.64**
0.00
0.89**
0.97**
0.83**
0.73**
0.64**
0.43**
0.76**
0.53**
0.44**
0.77**
0.00
0.75**
0.35
0.31
0.53**
0.62**
0.60
0.0016
0.0047
0.0064
0.39
0.27*
0.40**
0.47**
0.17
0.08
0.18
0.37**
0.77**
0.29**
0.50**
0.33**
0.30**
0.00
0.50**
0.25**
0.42*
0.83**
0.00
0.39**
0.00
0.42**
0.44**
0.54**
0.50**
0.30**
0.36**
0.33**
0.33**
0.20**
0.40**
0.00
0.55**
0.25**
0.17
0.36**
0.44**
0.33
0.005
0.0143
0.0192
2.13
*, **: Significant at 5% and 1% level of probability
3344
Int.J.Curr.Microbiol.App.Sci (2018) 7(1): 3339-3353
Table.2 Cry1Ac endotoxin (g/g) content in boll rinds at different stages of crop growth of Bt
cotton genotypes at Dharwad
Sl. No.
Bt genotypes
Rind
105 days
JKCH-2245
1.04**
1.
SBCH-302
0.24
2.
K-5308
0.16
3.
KDCHH-441
0.29
4.
JK Indra
0.41**
5.
RCH-2
0.30
6.
JK Ishwar
1.41**
7.
JKCH-1947
0.48**
8.
RCH-134
1.47**
9.
JKCH-22
1.37**
10.
Ankur-651 BGI
0.27
11.
RCH-144
0.00
12.
JKCH-1050
1.11**
13.
SBCH-311
0.28
14.
PCH-2270
0.37*
15.
NECH-3R
0.46**
16.
KDCHH-9810
0.43**
17.
NCEN-2R
0.64**
18.
RCH-118
0.44**
19.
JKCH-226
0.37**
20.
Dhruva
0.60**
21.
K-5316
0.68**
22.
KDCHH-9632
0.87**
23.
JK Varun
0.69**
24.
RCH-2171
0.71**
25.
RCH-20
0.79**
26.
JK Durga
1.22**
27.
JKCH-99
0.71**
28.
RCH-138
0.70**
29.
JKCH-1945
1.16**
30.
JK Gowri
0.09
31.
RCH-377
0.43**
32.
VICH-111
0.62**
33.
NHH-44
0.71**
34.
VICH-5
0.72**
35.
VICH-9
0.43**
36.
Grand mean
0.63
SEm+
0.008
CD at 5%
0.025
CD at 1%
0.033
CV (%)
1.92
*, **: Significant at 5% and 1% level of probability
3345
120 days
0.43
0.57**
0.38
0.22
0.56**
0.41
0.26
0.36
0.49
0.75**
0.16
0.71**
0.78**
0.92**
0.66**
0.87**
0.33
0.41
0.42
0.32
0.40
0.67**
0.57**
0.55**
0.38
0.65**
1.00**
0.67**
0.42
1.06**
0.04
0.43
0.41
0.57**
0.57**
0.50**
0.53
0.0129
0.037
0.049
3.49
140 days
0.35
0.22
0.48
0.28
0.34
0.51
0.39
0.36
0.35
0.28
0.35
0.54**
0.60**
0.79**
0.48
0.64**
0.17
0.35
0.32
0.08
0.33
0.36
0.53*
0.52
0.71**
0.45
0.67**
0.63**
0.36
0.70**
0.03
0.32
0.33
0.40
0.42
0.32
0.43
0.0059
0.017
0.022
1.93
160 days
0.14
0.07
0.59**
0.26
0.26
0.47**
0.26
0.16
0.57**
0.17
0.12
0.53**
0.11
0.61**
0.56**
0.57**
0.03
0.00
0.00
0.00
0.13
0.23
0.32
0.47
0.39
0.45
0.56**
0.33
0.23
0.00
0.00
0.28
0.16
0.25
0.28
0.23
0.27
0.008
0.023
0.032
4.32
Int.J.Curr.Microbiol.App.Sci (2018) 7(1): 3339-3353
Table.3 Cry1Ac endotoxin (g/g) content in seeds at different stages of crop growth of Bt cotton
genotypes at Dharwad
Sl.
No.
1.
2.
3.
4.
5.
6.
7.
8.
9.
10.
11.
12.
13.
14.
15.
16.
17.
18.
19.
20.
21.
22.
23.
24.
25.
26.
27.
28.
29.
30.
31.
32.
33.
34.
35.
36.
Bt genotypes
JKCH-2245
SBCH-302
K-5308
KDCHH-441
JK Indra
RCH-2
JK Ishwar
JKCH-1947
RCH-134
JKCH-22
Ankur-651 BGI
RCH-144
JKCH-1050
SBCH-311
PCH-2270
NECH-3R
KDCHH-9810
NCEN-2R
RCH-118
JKCH-226
Dhruva
K-5316
KDCHH-9632
JK Varun
RCH-2171
RCH-20
JK Durga
JKCH-99
RCH-138
JKCH-1945
JK Gowri
RCH-377
VICH-111
NHH-44
VICH-5
VICH-9
Grand mean
SEm+
CD at 5%
CD at 1%
CV (%)
Seeds
105 days
0.68
0.74
0.85**
0.68
0.70
0.71
0.47
1.10**
0.71
1.13**
0.69
0.68
0.17
1.61**
1.08
0.71
0.70
0.10
0.68
0.25
1.41**
0.75*
0.94**
0.81**
0.58
0.67
1.03**
0.67
0.69
1.03**
0.14
0.68
0.71
0.68
0.68
0.34
0.73
0.0127
0.036
0.049
2.46
120 days
1.87**
2.33**
2.58**
1.74
1.22
1.78
1.30
3.22**
1.79
3.35**
1.53
1.84**
0.12
4.15**
2.98**
1.66
1.92**
0.27
1.84**
0.45
4.17**
2.20**
2.28**
2.33**
1.75
1.87**
3.01**
1.32
1.32
2.11**
0.34
1.23
1.88**
1.78**
1.87**
1.09
1.90
0.013
0.039
0.059
1.01
*, **: Significant at 5% and 1% level of probability
3346
140 days
0.62*
0.78**
0.86**
0.58
0.41
0.59
0.43
1.07**
0.60
1.12**
0.51
0.61
0.09
1.38**
0.99**
0.55
0.64**
0.09
0.61
0.15
1.39**
0.73**
0.76**
0.78**
0.58
0.62*
1.00**
0.44
0.44
0.70**
0.11
0.41
0.63**
0.59
0.62*
0.36
0.64
0.0098
0.028
0.037
2.16
160 days
1.87**
1.27
1.59
1.59
1.14
1.58
0.74
1.07**
1.71**
2.59
1.15**
1.71
0.09
2.87**
2.81**
1.66**
1.81**
0.24
1.69**
0.34
2.34**
1.68**
1.68**
2.21**
1.64*
1.73
2.61**
1.14
1.1
1.42
0.33
0.91
1.83**
1.25
1.32
1.07
1.49
0.0072
0.020
0.027
0.68
Int.J.Curr.Microbiol.App.Sci (2018) 7(1): 3339-3353
Table.4 Cry1Ac endotoxin (g/g) content in flower at different stages of crop growth of Bt
cotton genotypes at Dharwad
Sl. No.
Bt genotypes
105 days
JKCH-2245
0.07
1.
SBCH-302
0.23
2.
K-5308
0.26
3.
KDCHH-441
0.10
4.
JK Indra
0.12
5.
RCH-2
0.31
6.
JK Ishwar
0.09
7.
JKCH-1947
0.88**
8.
RCH-134
0.92**
9.
JKCH-22
1.29**
10.
Ankur-651 BGI
0.16
11.
RCH-144
0.40**
12.
JKCH-1050
0.24
13.
SBCH-311
0.43**
14.
PCH-2270
0.27
15.
NECH-3R
0.27
16.
KDCHH-9810
0.18
17.
NCEN-2R
0.23
18.
RCH-118
0.11
19.
JKCH-226
0.42**
20.
Dhruva
0.60**
21.
K-5316
0.23
22.
KDCHH-9632
0.11
23.
JK Varun
0.57**
24.
RCH-2171
0.10
25.
RCH-20
0.24
26.
JK Durga
0.18
27.
JKCH-99
1.08**
28.
RCH-138
0.26
29.
JKCH-1945
0.58**
30.
JK Gowri
0.24
31.
RCH-377
0.42**
32.
VICH-111
0.27
33.
NHH-44
0.24
34.
VICH-5
0.18
35.
VICH-9
0.45**
36.
Grand mean
0.35
SEm+
0.0042
CD at 5%
0.012
CD at 1%
0.016
CV (%)
1.6975
*, **: Significant at 5% and 1% level of probability
3347
Flower
120 days
0.26
0.18
0.13
0.17
0.04
0.46
0.13
2.36**
2.36**
2.11**
3.25**
0.33*
0.59**
0.90**
0.59**
0.31
0.22
0.42
0.13
0.96**
1.33**
0.25
0.19
1.12**
0.41
0.25
0.21
2.21**
0.64**
1.19**
0.32
0.91**
0.53**
0.32
0.26
1.14**
0.72
0.011
0.034
0.046
2.34
140 days
0.09
0.06
0.04
0.06
0.01
0.15
0.04
0.79**
0.70**
1.12**
0.11
0.37**
0.20**
0.30**
0.20*
0.10
0.07
0.14
0.04
0.32**
0.44**
0.08
0.06
0.37**
0.14
0.08
0.07
0.74**
0.21**
0.40**
0.11
0.30**
0.18**
0.11
0.09
0.38**
0.24
0.0074
0.021
0.028
4.39
Int.J.Curr.Microbiol.App.Sci (2018) 7(1): 3339-3353
Table.5 Cry1Ac endotoxin (g/g) content in young boll at different stages of crop growth of Bt
cotton genotypes at Dharwad
Sl. No.
Bt genotypes
105 days
JKCH-2245
1.88
1.
SBCH-302
2.44
2.
K-5308
0.98
3.
KDCHH-441
0.88
4.
JK Indra
1.44
5.
RCH-2
2.46
6.
JK Ishwar
2.49
7.
JKCH-1947
4.29**
8.
RCH-134
2.61**
9.
JKCH-22
2.07
10.
Ankur-651 BGI
1.98
11.
RCH-144
2.85**
12.
JKCH-1050
0.97
13.
SBCH-311
2.11
14.
PCH-2270
1.92
15.
NECH-3R
3.33**
16.
KDCHH-9810
2.66**
17.
NCEN-2R
1.22
18.
RCH-118
1.28
19.
JKCH-226
0.93
20.
Dhruva
2.02
21.
K-5316
1.01
22.
KDCHH-9632
2.74**
23.
JK Varun
4.41**
24.
RCH-2171
1.97
25.
RCH-20
1.56
26.
JK Durga
4.11**
27.
JKCH-99
2.82**
28.
RCH-138
1.98
29.
JKCH-1945
4.32**
30.
JK Gowri
0.86
31.
RCH-377
2.71**
32.
VICH-111
2.76**
33.
NHH-44
1.23
34.
VICH-5
2.12
35.
VICH-9
2.88**
36.
Grand mean
2.20
SEm+
0.02
CD at 5%
0.057
CD at 1%
0.077
CV (%)
1.29
*, **: Significant at 5% and 1% level of probability
3348
Young boll
120 days
2.39**
0.76
2.85**
0.78
0.82
0.83
0.87
0.94**
0.75
0.72
0.81
0.65
0.6
0.56
0.76
0.78
0.71
0.59
0.92**
0.73
0.68
0.7
1.26
0.81
0.66
0.78
0.88**
3.46**
0.54
0.72
0.83
0.56
1.05**
0.87
1.01**
0.85
0.96
0.0146
0.042
0.05
2.16
140 days
0.80
0.25
0.95**
0.26
0.27
0.28
0.29
0.31*
0.25
0.24
0.27
0.22
0.20
0.19
0.25
0.26
0.24
0.20
0.31*
0.24
0.23
0.23
0.42**
0.27
0.22
0.26
0.29
1.15**
0.18
0.24
0.28
0.19
0.35**
0.29
0.34**
0.28
0.32
0.01
0.029
0.0389
4.48
Int.J.Curr.Microbiol.App.Sci (2018) 7(1): 3339-3353
Table.6 Crop growth stage-wise expression trend of Cry1Ac protein in different tissues of cotton at Dharwad
Leaf
Rind
Seed
Young
boll
Flower
+
45 DAS
90 DAS
% over
45 DAS
4.21
-
1.83
-
-56.54
-
-
Cry1Ac protein (g/g)
105 DAS 120 DAS % over 140 DAS % over 160 DAS
105 DAS
120 DAS
0.63
0.73
2.20
0.73
0.53
1.90
0.96
-60.11+
-15.88
160.27
-56.36
0.60
0.43
0.64
0.32
-17.82
-18.87
-296.88
-66.67
0.33
0.23
1.49
-
0.35
0.72
105.71
0.24
-66.67
-
% over 90 DAS
3349
% over
140
DAS
-45.00
-46.51
232.81
Int.J.Curr.Microbiol.App.Sci (2018) 7(1): 3339-3353
3350
Int.J.Curr.Microbiol.App.Sci (2018) 7(1): 3339-3353
3351
Int.J.Curr.Microbiol.App.Sci (2018) 7(1): 3339-3353
JKCH-1947 produced Cry 1 AC protein
highest at 120 DAS (1.59 g/g), 140 DAS
(1.35 g/g) and 160 DAS (0.77 g/g).
In young boll highest Bt protein produced at
105 DAS followed by 120 and 140 DAS. At
the stage of 105 DAS, most of Bt hybrids
produced Cry 1Ac protein more than critical
level except K-5308, KDCHH-441, JK-Indra,
JKCH1050, NCEN-2R, RCH-18, JKCH226,K-5316, RCH-20, JK-Gouri and NHH44. K-5308 (2.85(1.29 g/g), JKCH-99 (3.46)
and JKCH-2245 (2.39) exhibited Bt protein
more than critical level after 120 days after
sowing. None of Bt hybrid produced
endotoxin more than critical level at the stage
of 140 DAS while, JKCH-99 (1.15 g/g)
noticed highest Bt protein.
In seed tissue, SBCH-302 (2.33 g/g), K5308 (2.58 g/g), JKCH-1947 (3.22 g/g),
JKCH-22 (3.35 g/g), SBCH-311 (4.15 g/g),
PCH-2270 (2.98 g/g), KDCHH-9810 (1.92
g/g), Dhruv (4.17g/g), K-5316 (2.2 g/g),
KDCHH-9632 (2.28 g/g)), JK-Varun (2.33
g/g), JK-Durga (3.01 g/g), JKCH-1945
(2.11 g/g) produced Cry 1Ac protein more
than critical level at 120 days after sowing.
After 120 days Bt protein production was
decrease at 140 DAS then Bt gene expression
was increase at the stage of 160 DAS while,
some of Bt hybrids viz., JKCH-22 (2.59
g/g), Dhruva (2.34 g/g), JK-Varun (2.21
g/g) and JK-Durga (2.61 g/g) noticed more
than critical level but none of Bt hybrid
produced Cry 1Ac protein more than critical
level (1.9 g/g). Out of thirty six Bt hybrid
none of Bt hybrid produced endotoxin more
than critical level. SBCH-311 produced
highest Bt protein at the stage of 105 DAS
(1.61 g/g), 140 DAS (1.3 8g/g) and 160
DAS (0.77 g/g) in seed tissue.
Average Bt protein production was maximum
at the stag of 120 DAS in flower part. During
this stage JKCH -1947 (2.36 g/g), JKCH134 (2.36g/g), JKCH-22 (2.11 g/g)), Ankur
651 (3.25 g/g) and JKCH-99 (2.21 g/g)
exhibited endotoxin more than critical level
(1.9g/g) at 120 DAS but none of Bt hybrid
recorded more than critical level of Cry 1Ac
protein at the stage of 105 and 140 DAS.
JKCH-22 produced highest Bt protein at 105
DAS (1.29 g/g) and 140 DAS (1.12 g/g).
Cry 1Ac protein in rind was less than critical
levelin crop life span (at 105,120 and 140
DAS). RCH-134 (1.47 g/g), SBCH-311
(0.79g/g) and K-5308 (0.59 g/g) exhibited
highest endotoxin produced at 105 DAS,
120DAS and 140 DAS, respectively.
In conclusion, the growth stage-wise
expression trend of Cry1Ac protein in
different tissues has been presented in Table 6
and The expression of Cry 1Ac gene highest
in leaf (4.31 g/g at 45 DAS) followed by
young boll (2.02 g/g at 105 DAS), seeds (1.9
g/g 120 DAS and 1.49 g/g at 160 DAS),
flower (0.72 at 120 DAS) and least in rind
(0.63 g/g 105 DAS). Especially in leaf (45
DAS), flower (120 DAS), rind (105 DAS) and
young boll (105 DAS) expression of cry 1Ac
gene highest in one stage of crop life span
then it decreases towards end of life (up to
160 DAS ), but in case of seed tissue Cry 1
Ac production increase from 0.73 g/g (105
DAS) to 1.9 (120DAS) then production was
decrease to 0.64 g/g (140 DAS) again it
increase to1.49 g/g (160 DAS). So,
expression of Cry Ac gene was varies with
different plant parts.
References
Dong, H. Z. and Lis, W. J., 2007, Variability
of endotoxin expression in Bt transgenic
cotton J. Agron. And Crop Sci., 193(3):
21-29.
Kranthi, K. R., Naidu, S., Dhawad, C. S.,
3352
Int.J.Curr.Microbiol.App.Sci (2018) 7(1): 3339-3353
Tatwawadi, A. M., Mate, K., Patil, E.,
Bharose, A. A., Behere, G. T.,
Wadaskar, R. M. and Kranthi, S., 2005,
Temporal and intra-plant variability of
cry1Ac expression by Bt cotton and its
influence on the survival of the cotton
bollworm,
Helicoverpa
armigera
(Hubner) (Noctuidae : Lepidoptera).
Curr. Sci., 89(2): 291-298.
How to cite this article:
Nagappa, B.H. and Khadi, B.M. 2018. Expression of Bt Gene (cry1Ac) on Different Plant Parts
at Different Stages in Bt Cotton Genotypes. Int.J.Curr.Microbiol.App.Sci. 7(01): 3339-3353.
doi: />
3353