Effect of preparation conditions on arsenic rejection performance of polyamide-based thin film composite membranes
Bạn đang xem bản rút gọn của tài liệu. Xem và tải ngay bản đầy đủ của tài liệu tại đây (1.86 MB, 7 trang )
Physical Sciences | Chemistry, Engineering
Doi: 10.31276/VJSTE.62(1).43-49
Effect of preparation conditions on arsenic
rejection performance of polyamide-based
thin film composite membranes
Pham Minh Xuan1, 2*, Le Hai Tran1*, Huynh Ky Phuong Ha1,
Mai Thanh Phong1, Van-Huy Nguyen3, Chao-Wei Huang4
Faculty of Chemical Engineering, University of Technology, Vietnam National University, Ho Chi Minh city, Vietnam
2
Department of Chemical Engineering, Dong Thap University, Vietnam
3
Key Laboratory of Advanced Materials for Energy and Environmental Applications, Lac Hong University, Vietnam
4
Department of Chemical and Materials Engineering, National Kaohsiung University of Science and Technology, Taiwan
1
Received 10 January 2020; accepted 10 March 2020
Abstract:
Herein, a polyamide-based thin film composite (TFC) membrane was fabricated for the removal of arsenic (As)
from water. The polyamide thin film was synthesized through interfacial polymerization (IP) onto a polysulfone
porous substrate. A Box-Behnken design of response surface methodology was used to investigate the effect of
preparation conditions, including piperazine (PIP) concentration, trimesoyl chloride (TMC) concentration, and
reaction time on the As rejection and permeate flux of the synthesized membrane. The separation performance of
the prepared membranes from 15 designed experiments was conducted with an arsenate (Na2AsHSO4) solution
of 150 ppm at a pressure of 400 psi and a temperature of 25oC. The analysis of variance revealed the regression
models to be adequate. From the regression analysis, the flux and As rejection were expressed by quadratic
equations as a function of PIP concentration, TMC concentration, and reaction time. It was observed that the
PIP concentration, TMC concentration, and reaction time had a significant effect on the flux and As rejection of
the polyamide membrane. Moreover, a strong impact from the interaction of PIP and TMC was also observed on
rejection of the resulting membrane. Using the desirability function approach to analyse the regression model,
the optimal preparation conditions of the polyamide membrane were a PIP concentration of 2.5 wt.%, TMC
concentration of 0.11 wt.%, and reaction time of 40 sec. The membrane exhibited a good As rejection of 95%.
Keywords: arsenic, composite, membrane, polyamide, thin film.
Classification numbers: 2.2, 2.3
Introduction
Inorganic arsenic is a well-known carcinogen and one of
the most harmful chemical contaminants found in drinking
water around the world. Long-term ingestion of arsenic
from water and food can cause cancer and skin lesions.
According to the WHO, approximately 50 countries have
As content in their drinking water at a value higher than 10
µg/l, which is the recommended safety limit set by the WHO
[1]. Water pollution by As in Vietnam is a serious concern
with the As content in groundwater ranging from 0.1 to
higher than 0.5 mg/l, which exceeds the WHO standard
by 10 to 50-fold. There are numerous methods employed
to reduce As from water, such as co-precipitation [2],
adsorption [3], and membrane filtration i.e. reverse osmosis
RO [4] and nanofiltration (NF) [5]. Among these, the NF
membrane process has emerged as an efficient approach for
As removal from water due to its high permeate flux, good
quality freshwater, and low operating cost [6].
The modern NF membranes have a TFC structure that
consists of an ultra-thin polyamide film over a microporous
substrate. The separation performance of TFC NF
membranes, in terms of permeability and selectivity, are
directly correlated with the structural and physicochemical
properties of the ultra-thin polyamide film [7]. The selective
polyamide active layer is synthesized by the IP process at
the interface of two insoluble solvents. In this IP technique,
*Corresponding authors: Email: ;
March 2020 • Vol.62 Number 1
Vietnam Journal of Science,
Technology and Engineering
43
Physical Sciences | Chemistry, Engineering
surface using an air knife (Exair Corporation) at about 4-6 psi. The PIP saturate
membrane was then immersed into the TMC-hexane solution for 20-70 s. Th
membrane
was held vertically for 2 min before it was immersed in 200 ppm NaClO
many parameters, such as the monomer
concentrations,
types of monomers, and reaction and
time,
could
affect in
the1,000
then
dipped
ppm(Exair
Na2SCorporation)
forabout
30 s.4-6
Finally,
tthePIP
membrane
surface
using
an
air knife
psi. The
saturated was
sup
2O5 solution at
physicochemical properties and separation
performance
membrane
immersed
into the membrane
TMC-hexane
solution
for for
20-70
The deri
DI water
for 2was
min.then
Before
the obtained
could
be used
thes.experimen
of the membrane [8-14]. To the best
of
our
knowledge,
membrane
was
held
vertically
for
2
min
before
it
was
immersed
in
200
ppm
NaClO
for 2
immersed in a DI water container with the water regularly replaced.
previous investigations were conducted
one
andusing
then only
dipped
in 1,000 ppm Na2S2O5 solution for 30 s. Finally, tthe membrane was dippe
factor at a time, where only one variable was
changed
at
each
surface
using
an air
knife the
(Exair
Corporation)
at about
4-6be
psi.used
Thefor
PIPthe
saturated
support it
DI water for 2 min.
Before
obtained
membrane
could
experiments,
membrane
was
then
immersed
into
the
TMC-hexane
solution
for
20-70
s.
The
derived
experimental trial. Consequently, no correlation
between
immersed
in ausing
DI water
container
with
the water atregularly
replaced.
surface
an
air
knife
(Exair
Corporation)
about
4-6
psi.
The
PIP
saturated
support
membrane
parameters were observed and thus could not
indicatewas
the held vertically for 2 min before it was immersed in 200 ppm NaClO for 2 min
membrane was then immersed into the TMC-hexane solution for 20-70 s. The derived
and
then
dipped
in air
1,000
ppm
Na2SCorporation)
30 s. Finally,
tthe
was dipped
in
2O5 solution for about
optimum condition.
surface
using
knife
(Exair
4-6 psi.
Themembrane
PIP NaClO
saturated
membrane
wasanheld
vertically
for 2 min before itatwas
immersed
in 200
ppm
for support
2 min
DI
water forwas
2 min.
the obtained
couldsolution
be usedfor
for 20-70
the experiments,
it was
membrane
thenBefore
immersed
into themembrane
TMC-hexane
s. The derived
and
then dipped in 1,000 ppm Na2S2O5 solution for 30 s. Finally, tthe membrane was dipped in
In this work, a polyamide thin film was
synthesized
immersed
inwas
a DIheld
water container
with
thebefore
water itregularly
replaced.
membrane
2 min
was
immersed
200the
ppm
NaClO forit2was
min
DI water for
2 min. vertically
Before theforobtained
membrane
could
be usedinfor
experiments,
through interfacial polymerization onto a polysulfone
porous
and
then
dipped
in
1,000
ppm
Na
S
O
solution
for
30
s.
Finally,
tthe
membrane
was
dipped
in
2 5the water regularly replaced.
immersed in a DI water container 2with
substrate. The Box-Behnken design of response
surface
surface
air knife
Corporation)
about be
4-6used
psi. The
PIP experiments,
saturated support
DI water
for 2using
min.anBefore
the (Exair
obtained
membraneat could
for the
it was
membrane
immersed
the TMC-hexane
solution for 20-70 s. The derived
methodology was used to investigate the effectimmersed
of influential
in a DI was
waterthen
container
withinto
the water
regularly replaced.
membrane
was
held
vertically
for
2
min
before
it
was
immersed
in 200 ppm NaClO for 2 min
preparation conditions, including PIP concentration, TMC
and then dipped in 1,000 ppm Na2S2O5 solution for 30 s. Finally, tthe membrane was dipped in
concentration, and reaction time, on the As rejection
and
DI water for 2 min. Before the obtained membrane could be used for the experiments, it was
permeate flux of the synthesized membrane. The result
of in aFig.
immersed
DI water
containerillustration
with the water
replaced.
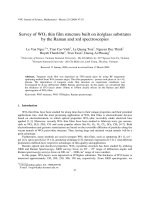
1. Schematic
of regularly
the crossflow
membrane process
this study is expected to contribute to a deeper understanding simulator.
of the influence of preparation conditions on the As rejection
The permeability of the synthesized membrane
of the membrane and to provide valuable data for preparing was evaluated for pure water and 150 ppb arsenate
Figure. 1. Schematic illustration of the crossflow membrane process simula
(Na2AsHSO4) aqueous solution using a custom fabricated
PA-based NF membranes for As removal from water.
Figure. 1. bench-scale
Schematic illustration
of the crossflow
membrane(Fig.
process simulator.
crossflow membrane
process
The permeability of the synthesized
membrane
was simulator
evaluated for1).pure water an
The
experiments
were
comprised
of
steps
of
compaction,
Materials and methods
of
the synthesized
membrane
evaluated
for pure water
and 150
aqueous
solution
awas
fabricated
arsenate The
(Napermeability
2AsHSO
equilibration,
and cleaning
acustom
fixed
temperature
of bench-scale
Figure.4)1.
Schematic
illustration
ofusing
the under
crossflow
membrane
process simulator.
Materials
) oSchematic
aqueous
solution
a experiments
custom
fabricated
bench-scale
crossf
arsenate process
(Na2AsHSO
Figure.
illustration
ofusing
theThe
crossflow
membrane
simulator.
41.
C.
First,(Figure
DI
water 1).
was
filtered
through
the process
membranes
25
membrane
simulator
were
comprised
The permeability
of the synthesized
membrane
was evaluated for pure
water
and 150 ppbof
membrane
process
simulator
(Figure
1).
The
experiments
were
comprised
of
at
450
psi
for
at
least
6
h.
After
achieving
a
stable
flux,
the
o 150 ppb steps
The
permeability
ofaqueous
the cleaning
synthesized
membrane
was
evaluated
for purebench-scale
water
Polysulfone porous support substrates
(PS20)
were
compaction,
equilibration,
under
acrossflow
fixed
temperature
of
25and
C.crossflow
First, DI
solution
using
awas
custom
fabricated
arsenate
(Na
2AsHSO4) and
osimulator.
Figure.
1.
Schematic
illustration
of
the
membrane
process
permeability
of
the
membrane
determined
by
measuring
compaction,
equilibration,
cleaning
under
temperature
25 C. First,
DI water
aqueous
solution
usinga fixed
a custom
fabricated of
bench-scale
crossflow
arsenate
(Na2AsHSO4) and
provided by Dow-Filmtec (USA). Piperazine
and
trimesoyl
membrane
process
simulator
(Figure
1).
The
experiments
were
comprised
of
steps
of
filtered
through
the
membranes
at
450
psi
for
at
least
6
h.
After
achieving
a ofstable
the
water
flux
under
an
applied
pressure
of
400
psi.
Next,
membrane
process
simulator
(Figure
1).
The
experiments
were
comprised
of
steps
filtered
through
the
membranes
at
450
psi
for
at
least
6
h.
After
achieving
a
stable
flux,
o water and
The
permeability
of
the
synthesized
membrane
was
evaluated
for
pure
150
ppb
chloride with a purity of 99% were receivedcompaction,
from Sigmaequilibration,
and cleaning
under
a the
fixed
temperature
of 25
C. First,
DI water was
o 150
an arsenate
solution
withof
fixed
concentration
of
ppb
Figure.
1. Schematic
illustration
crossflow
membrane
simulator.
permeability
of (Na
the
membrane
determined
by
measuring
the
water
flux
under a
compaction,
equilibration,
andwas
cleaning
under
aafixed
temperature
ofthe
25process
C.
First,
DI water
was
using
aleast
custom
fabricated
bench-scale
crossflow
arsenate
of
the
membrane
was
determined
measuring
water
flux
under
2AsHSO
4) aqueous
through
the
membranes
atsolution
450
psi
for
atby
6at h.
After
achieving
a stable
flux,antheapp
Aldrich (USA). Deionized (DI) water permeability
and filtered
hexane
(99%)
was
filtered
through
the
membrane
400
psi.
The
flux
was
filtered
through
the
membranes
at
450
psi
for
at
least
6
h.
After
achieving
a
stable
flux,
the
The
permeability
of the(Figure
synthesized
evaluated
for pure
water and
ppb
membrane
process
simulator
1). membrane
The
experiments
were
comprised
of
steps
of filte
pressure
of polyamide
400
psi.
ananarsenate
solution
with
a fixed
concentration
of150
150
ppb
w
of 400
psi.
Next,
arsenate
solution
with
awas
fixed
concentration
ofunder
150
ppb
was
ofNext,
the
membrane
was the
determined
by
measuring
the
water
flux
an
applied
measured
after
system
performance
was
stable
for
at
were used as solvents for the synthesispressure
of permeability
the
o
AsHSO
)
aqueous
solution
using
a
custom
fabricated
bench-scale
crossflow
arsenate
(Na
permeabilityequilibration,
of the
was determined
by measuring
the of
water
flux
underDIanwater
applied
2 membrane
4and cleaning
compaction,
under
a
fixed
temperature
25
C.
First,
was
the
membrane
at
psi.
The
fluxwith
was
measured
system
perform
least
30
min.
concentration
of concentration
As(V)
in after
the
feed
pressure
of
400 psi.
Next,
an
arsenate
solution
with
ameasured
fixed
concentration
ofthe
150and
ppb
was filtered
through
the
membrane
at400
400
psi.The
The
flux
was
after
the
system
performance
) was
purchased
from
membranes. Arsenate (Na2AsHSOthrough
membrane
process
simulator
The
were
comprised
ofwas
steps
of
pressure
of
400 psi.
Next,
an arsenate
solution
a experiments
fixed
of 150appb
filtered
4
filtered
through
the
membranes
at (Figure
450
psi 1).
for
at least
6 via
h. After
achieving
stable
flux,
the
o
permeate
solutions
were
determined
inductively
coupled
through
the
membrane
atatThe
400
psi.
The
flux
was
measured
after
system
performance
was w
equilibration,
and
cleaning
under
a As(V)
fixed
temperature
ofthe
25
C. First,
DI
watersolutions
was
stable
for
atcompaction,
least
30min.
min.The
concentration
ofof
in after
the
feed
and
permeate
for
at
least
30
concentration
As(V)
in
the
feed
and
permeate
Guangzhou Zio Chemical (China). stable
through
the
membrane
400
psi.
The
flux
was
measured
the
system
performance
was
permeability of theplasma
membrane
was emission
determinedspectroscopy
by measuringanalysis
the water(ICP-AES,
flux under an appliedsolut
atomic
stable
for
at
least
30
min.
The
concentration
of
As(V)
in
the
feed
and
permeate
solutions
were
filtered
through
the
membranes
at
450
psi
for
at
least
6
h.
After
achieving
a
stable
flux,
the
determined
via
inductively
coupled
plasma
atomic
emission
analysis
(ICP-A(
stable
for
at400
least
30Next,
min.coupled
The
concentration
of
As(V)
in emission
the
feed spectroscopy
and spectroscopy
permeate
solutions
were
determined
via
plasma
atomic
analysis
pressure
ofinductively
psi.Horriba).
an
arsenate
solution
with
a fixed
concentration
of
150
ppb
filtered
The data
of
flux
and
rejection
inanwas
Methods
permeability
of the membrane
was
determined
byarsenate
measuring
the waterreported
flux analysis
under
applied
determined
via
inductively
coupled
plasma
atomic
emission
spectroscopy
(ICP-AES,
determined
via
inductively
coupled
plasma
atomic
emission
spectroscopy
analysis
(ICP-AES,
Horriba).
The
data
of
flux
and
arsenate
rejection
reported
in
this
work
were
based
on
the
aver
through
the membrane
atNext,
400
psi.
Therejection
flux
measured
after
the
system
performance
wason
this
work
were
based
on was
the
average
of
three
experimental
of flux
400
psi.
an
arsenate
solution
with
a fixedinconcentration
of
150
ppb
was
filtered
Horriba).
The pressure
data
of
and
arsenate
reported
in
this
work
were
based
th
Horriba).
The
data
of
flux
and
arsenate
rejection
reported
this
work
were
based
on
the
average
Horriba).
The
data
of
flux
and
arsenate
rejection
reported
in
this
work
were
based
on
the
average
The polyamide thin film was hand-cast
on experimental
the
PS20
stable
for
at least
min.
The
concentration
of
As(V)
in the
feed
andsystem
permeate
solutions
were
of three
runs
that
have
anerror
error
lower
than
5%.
Water
fluxcan
canbe
be determined
f
through
the 30
membrane
athave
400
psi.
The
flux
was
measured
after
the
performance
was
runs
that
an
lower
than
5%.
Water
flux
runs
that
have
an
error
lower
thanthan
5%.Water
Water
fluxcan
can
be
determined
from
of three ofexperimental
runs
that
have
error
lower
5%.
Water
flux
can
be
determ
ofthree
threeexperimental
experimental
runs
that
have an
an
error
lower
than
5%.
flux
be
determined
from
determined
via
inductively
coupled
plasma
atomic
emission
spectroscopy
analysis
(ICP-AES,
substrate through IP [12]. The polyamide-based
TFC
stable
for
at
least
30
min.
The
concentration
of
As(V)
in
the
feed
and
permeate
solutions
were
determined
from
permeate
water
flow
rate
as
follows:
permeate
water
flow rate
as follows:
permeate
water
rate
permeate
waterflow
flow
rate
as follows:
follows:
permeate
water
flow
rate
as as
follows:
determined
via
coupled rejection
plasma atomic
emission
Horriba).
The
data
of inductively
flux
and
arsenate
reported
in thisspectroscopy
work were analysis
based on(ICP-AES,
the average
membrane was formed by immersing
the PS20
support
Horriba).
The data
of flux
and
arsenate
rejection
reported
in
this
work
were
based
on
the
average
of
three
experimental
runs
that
have
an
error
lower
than
5%.
Water
flux
can
be
determined
from
(
)
((
)
,, ,
(1)(1) (1) (1)
membrane in a PIP aqueous solution for 2 min. Excess PIP
)
permeate water flow(rate as follows:
,
(1)
solution was removed from the support membrane
surface water flow rate as follows:
permeate
where
Q
is
the
permeate
water
flow
A
is
the
effective
membrane
area
(0.0024
m2m
), 2and
t 2),
where
Q
is
the
permeate
water
flow
rate,
A
is
the
effective
membrane
area
(0.0024
), and
t a
P
m
is
the
permeate
water
flow
rate,
A
is
the
effective
where
Q
where
Q
is
the
permeate
water
flow
rate,
A
is
the
effective
membrane
area
(0.0024
m
P
m
P psi. The
m,
m
using an air knife (Exair Corporation) at about 4-6
( P
)
(1)
2in
is
the
filtration
time.
The
As(V)
concentrations
the
feed
and
permeate
solutions
were
used
to
(
)
,
(1)
is
the
filtration
time.
The
As(V)
concentrations
in
the
feed
and
permeate
solutions
were
used
to
membrane
area
(0.0024
m
),
and
t
is
the
filtration
time.
The
the
time. Thewater
As(V)flow
concentrations
the effective
feed and permeate
solutions
were use
QP filtration
is the
rate, Am isin the
membrane
area (0.0024
PIP saturated support membrane waswhere
thenisimmersed
intopermeate
the
calculatethe
theobserved
observed
arsenic
rejection as
shown
below:
2
calculate
arsenic
rejection
as
shown
below:
As(V)
concentrations
in
the
feed
and
permeate
solutions
2
where
Q
is
the
permeate
water
flow
rate,
A
is
the
effective
membrane
area
(0.0024
m
),
calculate
the
observed
shown
below:
Ptime.
mA is the
the
filtration
As(V)rejection
concentrations
ineffective
the feed
and permeate
solutions
TMC-hexane solution for 20-70 s. is
The
derived
membrane
where
QP isThe
thearsenic
permeate
water
flowas
rate,
membrane
area (0.0024 m
), andand
t t we
m
were
used
to
calculate
the
observed
As
rejection
as
shown
is the filtration
time. time.
The((As(V)
concentrations
and permeate
solutionswere
were
used
)) ininthe
, feed
(2)(2)
isin
the200
filtration
The
As(V)
the
solutions
used
to to
))rejection
(( concentrations
, feed and permeate
was held vertically for 2 min beforecalculate
it was immersed
the observed
arsenic
as shown
below:
below:
( )arsenic
( rejection
) below:
(2)
calculate
the observed
arsenic
rejection
as shown
calculate
the observed
as shown
below:,
SO
ppm NaClO for 2 min and then dipped in 1,000 ppm
Na
2 2 5 and CFeed are the arsenic concentration in feed and permeate sides, respectively.
whereC
CPermeate
where
the arsenic concentration
in
feed and permeate
sides, respectively.
Permeate and CFeed are
(2)
) (( () (
) ))
,,
(2)
solution for 30 s. Finally, tthe membranewhere
was dipped
DI C (are() the
,
(2) respectively
(2)
CPermeateinand
arsenic concentration
in feed
and permeate
sides,
Feed
water for 2 min. Before the obtained membrane could
be
where CPermeate
and CFeed are the arsenic concentration in feed and permeate sides, respectively.
where C
Permeate and CFeed are the arsenic concentration in feed and permeate sides, respectively.
used for the experiments, it was immersed
in a DIand
water
and Cconcentration
are the As concentration
feed and sides, respe
CPermeate
where CPermeate
CFeedwhere
are the
arsenic
in feed andinpermeate
Feed
permeate sides, respectively.
container with the water regularly replaced.
of three experimental runs that have an error lower than 5%. Water flux can be determined from
44
Vietnam Journal of Science,
Technology and Engineering
March 2020 • Vol.62 Number 1
Table 1. Actual and coded levels of independent variables.
Factor
Level
Table 1. Actual and coded X
levels
ofLow
independent
variables.
Variables
(-1) Middle
(0)
i
PIP concentration
(wt.%)
Variables
TMC concentration (wt.%)
PIP concentration (wt.%)
Reaction
time (s)
TMC concentration (wt.%)
X
X
X
Factor
1
Xi
2
X1
X 3
2
1.0
Low (-1)
0.05
1.0
20
0.05
Level
Physical Sciences | Chemistry, Engineering
number of studied factors, and random error of
Highcoefficient,
(+1)
2.5
Middle (0)
High (+1)
0.10
2.5
4.0
450.15
0.10
the model, respectively.
4.0 The response surface methodology (RSM) and statistical
0.15
analysis
variance
(ANOVA)
were
performed
DesignTheofresponse
surface methodology
(RSM)
and statistical
analysis via
of variance
(ANOVA)
Expert software 8.0. The significance of variables, fitness,
70
were performed via Design-Expert software 8.0. The significance of variables, fitness, and
and adequacy of the developed models were judged
time (s)
X
20
45
70
Based onReaction
preliminary
experiments,
three
preparation
conditions statistically
including
PIP
adequacy of the
developed
were judged
usingand
R2, adjusted
R2, F-value,
using
R2,models
adjusted
R2,statistically
F-value,
p-value.
The and
of
the
models
were
retained
or
removed
based
on
thewith a
Based
on preliminary
experiments,
three
preparation
concentration, TMC
concentration,
and reaction
time were
determined
as theterms
most
essential
p-value. The terms of the models were retained or removed based on the probability value
conditions including PIP concentration, TMC concentration, probability value with a limit of 95 % confidence. Finally,
parameters. Therefore,
the PIP and TMC concentrations and reaction times wereresponse
chosen
as
of 95 % confidence.
the response
surfacestheobtained
from the regression
models
surfacesFinally,
obtained
from
regression
models
and reaction time were determined as the most essential the limit
to visualize
theinteractive
individual
interactive
independent variables
and designated
X1,PIP
X2,and
andTMC
X3, respectively.
Table were
1 describes
weregenerated
generatedthe
to visualize
the individual and
effects of and
the influential
factors.
parameters.
Therefore,asthe
concentrations
The
response
surface
methodology
(RSM)
and
statistical
analysis
of
variance
(ANOVA)
The
response
surface
methodology
(RSM)
and
statistical
analysis
of
variance
effects
of
the
influential
factors.
and
reaction
times
were
chosen
as
independent
variables
and
Thethree
response
surface methodology (RSM) and statistical analysis of variance (ANOVA)
(ANOVA)
actual values and coded levels of the preparation conditions, which were variedwere
over
levels
performed
via
Design-Expert
software
8.0.
The
significance
of
variables,
fitness,
and
were
performed
via
Design-Expert
software
8.0.
The
significance
of
variables,
fitness,
and
Table
3. ANOVA
response
surface8.0.
model
of permeation
flux
and As rejection
designated as X1, X2, and X3, respectively. Table 1 describes were
performed
via Design-Expert
software
The
significance
and
22 of variables,
22 fitness,
Table
3.
ANOVA
response
surface
model
of
permeation
flux
and
adequacy
of
the
developed
models
were
judged
statistically
using
R
,
adjusted
R
,
F-value,
and
of
as high level (+1),
(0), and
and low
levellevels
(-1), respectively.
the middle
actual level
values
coded
of the preparation adequacy
As rejection.
adequacy
of the
the developed
developed models
models were
were judged
judged statistically
statistically using
using R
R2,, adjusted
adjusted R
R2,, F-value,
F-value, and
and
3
p-value. The terms of the models were retained or removed based on the probability value with a
were
Permeation
Flux or
rejection value
conditions, which were varied over three levels as high p-value.
p-value. The
The terms
terms of
of the
the models
models
were retained
retained
or removed
removed based
based on
on the
theAsprobability
probability
value with
with aa
limit
of
95
%
confidence.
the
response
surfaces
obtained
from
the
regression
models
Permeation
Flux Finally,
As rejection
limit
of
95
%
confidence.
Finally,
the
response
surfaces
obtained
from
the
regression
models
Table
2. The
Box-Behnken
andlow
corresponding
flux and As rejection
level
(+1),
middle leveldesign
(0), and
level (-1), respectively.
DF SumFinally,
of Meanthe response
F- surfaces
p- DFobtained
Sum of from
Meanthe regression
Fplimit of 95 % confidence.
models
Run
number
1
2
3
4
5
6
7
8
9
10
11
12
13
14
15
were
and
interactive
effects
the
influential
were generated
generatedDFto
to visualize
visualize
individual
and
interactive
of
the
influential
factors.
Sum of the
Meanindividual
Sum of of
F-value factors.
p-value
the
individual
andp-value
interactive
effects
ofMean
the Square
influential
factors.
Squarethe
SquareF-valueValue
ValueDF effects
Square
Value
Value
Table 2. The Box-Behnken design and corresponding flux and were generated to visualize
square
square
square square
PIPAs
conc.,
X
TMC
conc.,
X
Reaction
time,
X
Flux,
Y
Rejection,
Y
Table
3.
ANOVA
response
surface
model
of
permeation
flux
and
As
rejection
1
2
3
1
2
rejection.
Table
3.
ANOVA
response
surface
model
of
permeation
flux
and
As
rejection
Model
6
3447.8
574.6
18.3
0.0003
9
7392.1
821.3
42.20
Table 3. ANOVA response surface model of permeation flux and As rejection 0.0003
(wt.%)
Run
number
1
2
3
4
5
6
7
8
9
10
11
12
13
14
15
PIP conc., X1
(wt.%)
1.0
1.0
1.0
1.0
4.0
4.0
4.0
4.0
2.5
2.5
1.0
1.0
2.5
2.5
1.0
1.0
4.0
4.0
2.5
2.5
2.5
2.5
2.5
2.5
2.5
2.5
4.0
4.0
2.5
2.5
(wt.%)
TMC conc., X2
(wt.%)
0.05
0.15
0.05
0.10
0.05
0.10
0.05
0.10
0.10
0.10
0.10
0.10
0.15
0.15
0.15
(sec.)
Reaction time, X3
(sec.)
0.05
0.1545
0.0545
0.1045
70
0.0520
0.1020
0.0570
0.1070
0.1020
0.1045
0.1045
45
0.1020
0.1545
0.1570
0.15
Flux, Y1
(lm-2h-1)
56.70
5.35
0.90
0.85
28.85
44.35
7.30
13.95
8.50
6.95
9.80
12.75
9.35
5.15
5.40
45
45
45
70
20
20
70
70
20
45
45
45
20
45
70
6
3,447.8 574.6 18.3
0.0003 9
7,392.1 821.3
42.20
0.0003
(Lm-2h-1) Model X(%)
Permeation
Flux
rejection
1
1376.8
1376.8
Permeation
Flux 43.7 0.0002 1 2638.7 As
As2638.7
rejection135.6 < 0.0001
1
Permeation
Flux
As rejection F- <
of
Mean
pSum
of
p1,376.8
1,376.8 43.7F135.6 FDF1 Sum
Sum
of 586.5
Mean
F- 18.60.0002
p-0.00261DF
DF 1 2,638.7
Sum1505.0
of2,638.7Mean
Mean
p56.70 X XDF
26.4
1
1505.0
77.30.0001 Value
0.0003
DF
Sum
of Square
Mean 586.5
FpDF Sum
of Square
Mean
Fp2
Square
Value
Value
Square
Square Square Value Value
Square Square Value
Value
Value
Square
Square
Value
Value
Square
Square
Value
Value
26.4
5.35 Model
3447.8
574.6
0.0003
7392.1
0.0003
X3661 91.1
1 504.8586.5
0.00391 99 1 1,505.0
635.91,505.0821.3
635.9
32.70.0003 0.0023
X
586.5
18.618.3
77.3 42.20
Model
3447.8
574.6504.8
18.316.00.0026
0.0003
7392.1
821.3
42.20
0.0003
Model
6
3447.8
574.6
18.3
0.0003
91
7392.1
821.3 42.20
0.0003
1376.8
1376.8
43.7
0.0002
2638.7
2638.7
135.6
<< 0.0001
91.1
1376.8
1376.8
43.7
0.0002
1
2638.7
2638.7
135.6
0.0001
11376.8
772.8
772.8
24.6
0.0011
1
1022.2
1022.2
52.5
0.0008
0.90 XXXXX1112 X1X11112 1 96.0
504.8
504.8
16.0
0.0039
1
635.9
635.9
32.7
0.0023
1376.8
43.7
0.0002
1
2638.7
2638.7
135.6
<
0.0001
586.5
18.6
1505.0
77.3
0.0003
X2
1
586.5 586.5
586.5
18.6 0.0026
0.0026 11
1505.0 1505.0
1505.0
77.3
0.0003
96.0
586.5
18.6 4.10.0026
1505.0
77.3
0.0003
1586.5
0.07721 111 1 1,022.2
652.31,022.21505.0
652.3
33.50.0008 0.0022
504.8
504.8
0.0039
635.9
635.9
0.0023
0.85 XXXXXX323 X1X11113 1 92.3
772.8
772.8
24.616.0
52.5 32.7
504.8 129.4
504.8129.4
16.0 0.0011
0.0039
635.9
635.9
32.7
0.0023
504.8
504.8
16.0
0.0039
1
635.9
635.9
32.7
0.0023
3
92.3
XX11XX22 X X11
772.8
772.8
24.6
0.0011
11 1 1022.2
1022.2
52.5
0.0008
772.8
772.8
24.6
0.0011
1022.2
1022.2
52.5
1
77.4
77.4
2.5
0.1554
153.6
153.62
7.9
0.0376
2 13 1 60.9
129.4
129.4
4.124.6 0.0772
1 1 652.3
652.3 1022.2
33.5 52.5
0.0022 0.0008
XXX1XXX2
772.8
772.8
0.0011
1022.2
0.0008
28.85
1
129.4
129.4
4.1
0.0772
1
652.3
652.3
33.5
0.0022
1
3
X 1X 3
1
129.4 129.4
4.1 0.0772 1
652.3
652.3
33.5
0.0022
60.9
XXX1XXX3
11
129.4
129.4
4.1
0.0772
1
652.3
652.3
33.5
0.0022
1
653.1
653.1
33.6
0.0022
77.4
0.1554
7.9
77.477.4
7.9
0.0376 0.0376
X22X33
11 35.3
77.4 77.4
77.4 2.5 2.5
2.5 0.1554
0.1554 1 11 153.6153.6
153.6153.62153.62
153.62
7.9
0.0376
44.35
X 2X 3
1
77.4
77.4
2.5 0.1554 1
153.6 153.62
7.9
0.0376
35.3
1
86.8
86.8
4.5
0.0884
1
653.1
653.1
33.6
- 87.0
- - 1 1 653.1653.1653.1 653.1
33.6 33.6
0.0022 0.0022
0.0022
7.30
87.0
0.0022
- - - - - - - - - 1 1 653.1
126.3 653.1
126.3 33.6
6.5 0.0514
86.8 86.8
4.5
0.0884 0.0884
13.95
82.8
-- - 82.8
-- - -- -- -- 1 11 86.8 86.8
4.5
0.0884
Residual- 8 - 251.9 - 31.5 - - - - 1 5 86.8
97.3 86.8
19.5 4.5
86.8
86.8
4.50.0884
95.9
8.50
95.9
1
126.3
126.3
6.5
0.0514
Lack -- of
-- 11
126.3
126.3
6.5
0.0514
126.3
6.5
0.0514
6 -- 235.531.5 -- 39.2- -- 4.7- 0.1873
93.119.5 126.3
31.0
14.7
0.1643
96.6
- 96.6
- 1 3 126.3
126.3
6.5
0.0514
6.95Residual
Residual
8
251.9
5
97.3
fit
88
251.9
31.5
--- 55
97.3
19.5
--Residual
251.9
31.5
97.3
19.5
96.5
Residual
8 96.5
251.9
31.5
- 5
97.3
19.5
fit error
9.80Lack
6
235.5
39.2
4.7
0.1873
3
93.1
31.0
14.7
0.1643
Pure
2
16.8
8.4
2
4.2
2.1
LackLack ofof
of
235.5
39.2
4.7
93.1
31.0
14.7
0.1643
Lack
of 66
235.5
39.2
4.7 0.1873
0.1873 33
93.1
31.0
14.7
0.1643
94.0
fit
6
235.5
39.2 - 4.7 -0.1873 3
93.1
31.0
14.7
0.1643
fit Pure error
Model summary
2 94.0
16.816.8 8.4 8.4
2.1
-12.75fitPure
--- 2 22 4.2 4.2
2.1
-Pure error
error 22
16.8
8.4
4.2
2.1
95.4
Pure
error
2
16.8
8.4
2
4.2
2.1
Model
summary
SDsummary 95.4
5.61
4.41 Model
Model
summary
9.35
96.8
Model
summary
SD
5.61
4.41
SD SD R2 (%) 5.61
5.61
4.41
93.194.41
98.70
SD
5.61
4.41
22
5.15
96.8
96.7
R
93.19
98.70
R2 (%)
(%)2
93.19
98.70
2
R
(%)
93.19
98.70
2 (%)
Adj.
R
(%)
88.09
96.36
(%)
93.19
98.70
Adj.
R
88.09
96.36
R
R (%)
88.09
96.36
5.40Adj.
96.7
Adj. R2 (%)
88.09
96.36
Rejection, Y2
(%)
1
2
3
1 2
1 3
2 3
2
The Box-Behnken statistical design (BBD) was
96.36
Adj. R2 (%) 88.09
employedstatistical
to establish
a mathematical
model representing
The Box-Behnken
design
(BBD) was employed
to establish3.3. aRESULTS
mathematical
AND
DISCUSSION
RESULTS
AND
DISCUSSION
3. RESULTS
AND DISCUSSION
3. RESULTS
AND DISCUSSION
the correlation
between
individual
factors
and the
and(i.e.
discussion
model representing
the correlation
between
individual
factors
and predicted
the predictedResults
responses
Model
fitting
and
statistical analysis
responses (i.e. permeation flux and As rejection). According 3.1.
3.1. Model
fitting
and
analysis
Model
fittingfitting
andtostatistical
statistical
Model
and analysis
statistical analysis
permeation fluxtoandtheAs BBD,
rejection).
to theruns
BBD,were
15 experimental
runs3.1.were
required
15 According
experimental
required to
3.1.
Model
fitting
and
statistical
analysis(Y
observed
flux
(Y11)) and
As
rejection
through
the designed
experiments
in
2) recorded
The
observed
flux
As
rejection
(Y
recorded
through
designed
experiments
the three
variables. The
The
observed
flux
) and
rejection
) recorded
investigate theinvestigate
three variables.
The experimental
planexperimental
is shown inplan
Tableis 2.RSM
AThe
second-order
The
observed
flux (Y
(Y1) and
and
As (Y
rejection
(Y22)) As
recorded
through the
the(Y
designed
experiments in
in
1 tests
2
are
reported
in
Table
2.
The
F-value
were
conducted
with
ANOVA
for
calculating
the
RSM
are
reported
in
Table
2.
The
F-value
tests
were
conducted
with
ANOVA
for
calculating
the
shown in Table 2. A second-order model is generally used RSM
through
the
designed
experiments
in
RSM
are
reported
in
are
reported
in
Table
2.
The
F-value
tests
were
conducted
with
ANOVA
for
calculating
the
model is generally
used for describing the mathematical relationship between significance
the variables
(x
of
the
mathematical
models.
The
results
showed
that
the
two-factor
interaction
i) flux (Y1) and
of
the
models.
The
results
showed
that
the
two-factor
interaction
The
As rejection
(Y2) conducted
recorded
through
experiments
in
for describing the mathematical relationship between the significance
significance
of observed
the mathematical
mathematical
models.
The
results
showed
that the
thedesigned
two-factor
interaction
Table
2.
The
F-value
tests
were
with
ANOVA
model
was
proposed
for
the
flux
response
(y
),
as
shown
in
Eq.
4.
Meanwhile,
the
quadratic
1
model
was
proposed
for
the
flux
response
(y
),
as
shown
in
Eq.
4.
Meanwhile,
the
quadratic
1
and responses (y
Eq.responses
3:
variables
(xi) in
and
(yi), as shown in Eq. 3:
i), as shown
model
was
for the
response
(ytests
aswere
shown
in Eq.with
4. ANOVA
Meanwhile,
the quadratic
1),of
RSMproposed
are reported
Tableflux
2. The
F-value
the
forexpressed
calculating
significance
the
mathematical
models.
model
in Eq.
Eq. 55inthe
was
obtained
for predicting
predicting
theconducted
As
rejection response
response for
(y22calculating
model
expressed
in
was
obtained
for
the
As
rejection
(y
):):):
model
expressed
in
Eq.
5
was
obtained
for
predicting
the
As
rejection
response
(y
2model
The
results
showed
that
the
two-factor
interaction
significance of the mathematical models. The results showed that the two-factor interaction
(3)
∑
∑
∑
(3)
(4)
was proposed for the flux response (y1), as shown in Eq. 4.(4)
(4)
model
was
proposed
for
the
flux
response
(y
),
as
shown
in
Eq.
4.
Meanwhile,
the
quadratic
1
Y isresponses
the predicted
of flux Xor and
As rejection;
Meanwhile,
the
quadratic
model
expressed
in
Eq.
5
was
where, Y is thewhere,
predicted
of fluxresponses
or As rejection;
X
are
independent
factors
in
i
j
model expressed
in Eq. 5 was obtained
for predicting
the Asresponse
rejection response
Xi and Xj are independent factors in coded levels; bi, bii, and obtained
for predicting
the As
rejection
(y2(y):2):
coded levels; bbi,ij bare
bij are the coefficients
of quadratic,
the linear, and
quadratic,
and interaction terms of
ii, and
the coefficients
of the linear,
interaction
(4)
(4)
and ε are the
constant
terms of the
bo, n,coefficient,
the model, respectively;
b ,model,
n, and respectively;
are the constant
number
of studied factors, and
o
random error of the model, respectively.
March 2020 • Vol.62 Number 1
Vietnam Journal of Science,
Technology and Engineering
45
(5)
The observed
(Y1As
) andrejection
As rejection
(Y2) recorded
the designed
experiments
The observed
flux (Yflux
(Y2) recorded
throughthrough
the designed
experiments
in in
1) and
are reported
The F-value
tests conducted
were conducted
with ANOVA
for calculating
RSM RSM
are reported
in Tablein Table
2. The2.F-value
tests were
with ANOVA
for calculating
the the
significance
of
the
mathematical
models.
The
results
showed
that
the
two-factor
interaction
significance of the mathematical models. The results showed that the two-factor interaction
was proposed
flux response
), as shown
4. Meanwhile,
the quadratic
modelmodel
was proposed
for theforfluxtheresponse
(y1), as(y1shown
in Eq.in4.Eq.Meanwhile,
the quadratic
model
expressed
in5 Eq.
was obtained
for predicting
As rejection
response
Physical
Chemistry,
Engineering
model
expressed
in Eq.Sciences
was5obtained
for|predicting
the Astherejection
response
(y2): (y2):
(4) (4)
(5)
where x1, x2, and x3 are the code values of PIP, TMC
concentrations, and reaction time, respectively. The effect
of each variable of the developed model on the responses
are specified with a negative or positive symbol before the
term.
The adequacy of the obtained models and the significance
of the model terms and their interactions was validated
using ANOVA. As can be seen in Table 3, the F-value of the
model for flux is 18.25 and the p-value is lower than 0.05,
which implies that the regression model is significant. The
R2 value for the predicted flux model is 93.19 %, indicating
that only 6.81% of the experimental variations cannot
be explained by the model. Moreover, the adjusted R2 of
88.09% is in reasonable agreement with the R2 value. For
the developed model for As rejection, the F-value is 42.2
and the p-value is lower than 0.05, which shows the high
significance of the model. The R2 value of 93.19 % indicates
that more than 90 % of the variation in the data is explained
by the model, whereas, the adjusted R2 of 96.36 % shows a
good agreement with the R2 value. These results illustrate
the statistical validity of the predicted models. Thus, the
developed models can be used to navigate the separation
performance of the prepared membrane within the range of
studied variables.
According to ANOVA analysis, the p-value of PIP and
TMC concentrations, reaction time, and interaction between
PIP and TMC concentrations are less than 0.05, which
indicates the significance of these factors on the permeation
flux of the prepared membrane. On the contrary, the other
factors are insignificant or less significant in the developed
model. For the As rejection,
according to the analysis, it was
found that the PIP concentration,
TMC concentration, reaction
time, interactions effects of
PIP-TMC concentration, PIP
concentration-reaction time, and
TMC concentration-reaction time
are the most effective parameters.
However, the rest of the factors
show an insignificant influence
due to a p-value higher than 0.05.
Based on the ANOVA results,
the non-significant or less
significant factors were eliminated
from the models for flux and
46
Vietnam Journal of Science,
Technology and Engineering
significance of these factors on the permeation flux of the prepared membrane. On the contrary,
the other factors are insignificant or less significant in the developed model. For the As rejection,
according to the analysis, it was found that the PIP concentration, TMC concentration, reaction
time, interactions effects of PIP-TMC concentration, PIP concentration-reaction time, and TMC
concentration-reaction time are the most effective parameters. However, the rest of the factors
show an insignificant influence due to a p-value higher than 0.05.
Based on the ANOVA results, the non-significant or less significant factors were
from theThereby,
models for fluxthe
and final
As rejection.
Thereby, in
the final
modelsofin terms
of
As eliminated
rejection.
models
terms
actual
actual
factors
are
expressed
in
Eq.
(6)
and
Eq.
(7):
factors are expressed in Eq. (6) and Eq. (7):
(6) (6)
(7)
(7)
Evaluation of model factors on permeation flux and
As rejection
3.2. Evaluation of model factors on permeation flux and As rejection
Equation (6) illustrates the influence of the preparation
Equationon
(6) illustrates
the influenceflux
of the preparation
on permeation
flux of the
conditions
permeation
of theconditions
prepared
membrane.
prepared
can bethe
seen that
the reaction time
affectsaffects
the flux lessthe
significantly
It can
bemembrane.
seen Itthat
reaction
time
flux than
less
the PIP and TMCthan
concentrations.
the PIP concentration
is the most significant
significantly
the Particularly,
PIP and
TMC concentrations.
parameter on thethe
flux PIP
and theconcentration
interaction effect between
concentration
and TMC
Particularly,
is the
thePIPmost
significant
concentrationon
plays the
an important
in controlling
the flux of the membrane.
parameter
fluxroleand
the interaction
effect between
the PIP
concentration
and
TMC
concentration
Figure 2 shows the response surface and contour plots that demonstrate theplays
interactivean
important
role
in
controlling
the
flux
of
the
membrane.
influence of PIP and TMC concentration on the flux at a constant reaction time of 45 s. The flux
was observed2toshows
decrease considerably
when increasing
the PIP orand
TMC concentration,
the
Figure
the response
surface
contour but
plots
that demonstrate the interactive influence of PIP and TMC
concentration on the flux at a constant reaction time of 45
s. The flux was observed to decrease considerably when
increasing the PIP or TMC concentration, but the decrement
of the flux by the increase of PIP concentration is more
significant than that of TMC concentration. This reduction
in flux can be related to the growth of the membrane
thickness [13]. The polymerization occurs at the interface
between the TMC/hexane and PIP/water phases towards the
organic phase due to the low solubility of TMC in water
[14]. Thereby, PIP, with a concentration in great excess
over TMC, is commonly utilized to accelerate the diffusion
of the diamine monomer into the organic phase. Park, et
al. [15] reported that with high TMC concentration (>0.1
wt.%), the kinetics of IP is dominantly governed by the PIP
concentration and the increase in PIP concentration induces
the creation of a thicker polyamide membrane.
Fig. 2. (a) Response surface and (b) contour plots of PIP and TMC concentration effects on
the permeation flux of the fabricated membrane.
March 2020 • Vol.62 Number 1
Physical Sciences | Chemistry, Engineering
The flux depends on not only the thickness but also on the
hydrophilicity of the membrane. The higher hydrophilicity
of the membrane surface, the stronger the affinity between
the membrane and water molecules, and thus the flux
of the membrane improves. The number of carboxylic
groups related to the hydrophilicity of the membrane is
generated by the hydrolysis of unreacted acyl halide groups
in the TMC monomer [12]. Saha and Joshi found that an
increasing TMC concentration can
cause a rise in both the thickness and
hydrophilicity of the membrane [14].
In this present work, the increase in
thickness dominates the hydrophilicity of
the membrane when increasing the TMC
concentration. However, the decline in
flux by increasing PIP concentration is
more considerable than that caused by
increasing TMC concentration.
of amide crosslinking in the prepared membrane. However,
when the PIP concentration is much greater than the TMC
concentration, the As rejection and permeant flux show a
decreasing trend due to the expansion of the reaction zone
that causes a thicker and looser structure membrane [14-16].
As shown in Fig. 3 (c, d, e, f), the increase in TMC
concentration is demonstrated to extend the crosslinking
Evaluation of model factors on As
rejection
The response surface and contour
plots showing the interaction impacts
of PIP-TMC concentration, PIP
concentration-reaction time, and TMC
concentration-reaction time on the As
rejection of the prepared membrane are
illustrated in Fig. 3. It is apparent that the
As rejection improves with an increase in
PIP concentration, TMC concentration,
and reaction time. Regarding Fig. 3(a, b),
the As rejection strongly depends on
the PIP concentration, while the TMC
concentration shows a weaker factor.
It can be explained by the “selflimiting” mechanism of IP that the faster
diffusion of the PIP monomers to the
organic phase to bond with the TMC
monomers forms an initial thin film with
high crosslinking [16]. This dense thin
film is regarded as a barrier that hinders
the diffusion of PIP monomers to the
reaction zone. As a result, the reaction is
limited and then terminates. Over a variety
of TMC concentrations from 0.05 to 0.15
wt.%, the As rejection increases sharply
with an increase in m-phenylenediamine
(MPD) concentration due to the formation
Fig. 3. Response surface (a) and contour plots (b) of the PIP - TMC concentration,
(c,d) PIP concentration - reaction time, and (e,f) TMC concentration - reaction time
effects on As rejection of the prepared membrane.
March 2020 • Vol.62 Number 1
Vietnam Journal of Science,
Technology and Engineering
47
Physical Sciences | Chemistry, Engineering
and thus enhance the As rejection of the resulting
membrane. On the other hand, prolonging the reaction time
can facilitate crosslinking to form a membrane with high As
rejection. This result is in agreement with previous studies
[11-16]. Saha and Joshi [14] suggested that increasing the
TMC concentration could reduce the amine/acyl chloride
ratio to form a thinner and denser membrane. Furthermore,
Kadhom, et al. [16] observed that the polyamide membrane
prepared via interfacial polymerization with short reaction
time (within 15 s) exhibited a high flux and low ion rejection
because the unreacted TMC monomers were hydrolysed
to form linear amide moiety with carboxylic acid groups
instead of a crosslinking structure.
as a function of preparation conditions. The results showed
that the maximum permeation flux and As rejection of
13.9 lm-2h-1 and 96.7%, respectively, were achieved with
a PIP concentration of 2.5 wt.%, TMC concentration of
0.11 wt.%, and reaction time of 40 s. An experiment with
the optimized conditions was performed and the flux and
As rejection of the prepared membrane were recorded to
validate the optimization result as well as the regression
models. The obtained flux and As rejection were 14.2±0.8
lm-2h-1 and 95.01±0.13% respectively, which demonstrates
the validity of the statistical models to optimize the
preparation conditions of the polyamide membrane for
removing As from water.
Conclusions
Optimization
The results indicate a trade-off between the permeation
flux and As rejection of the polyamide membrane. Thus,
the increase of permeation flux is accompanied by the
sacrifice of As rejection. Therefore, it could be suggested
that the determination of the optimal ratio of PIP/TMC
concentration and corresponding reaction time is required
to achieve a membrane with high flux for As removal from
water. Response surface optimization, combined with
desirability function approach, was applied to maximize
the permeation flux and As rejection. In order to obtain
the optimum preparation conditions for a high-separation
performance membrane, the desired goals in terms of
flux and As rejection were defined as maxima. Fig. 4
illustrated the desirability, predicted flux, and As rejection
A polyamide-based TFC membrane was fabricated for
As removal from water. The polyamide membrane was
synthesized through IP onto a polysulfone porous substrate.
RSM, using Box-Behnken design, was applied to determine
the effects of three important preparation conditions,
including PIP concentration, TMC concentration, and
reaction time, on the As rejection and permeate flux of the
synthesized membrane. The study revealed that the PIP
concentration was the most significant factor that influenced
the flux and As rejection of the resulting membrane, while
the reaction time was the least significant parameter.
Furthermore, the small deviation between the predicted
and actual results indicated the accuracy and validity of
the regression models. According to the RSM, the optimal
conditions to fabricate the polyamide membrane are PIP
concentration of 2.5 wt.%, TMC concentration of 0.11
wt.%, and reaction time of 40 s.
The authors declare that there is no conflict of interest
regarding the publication of this article.
References
[1] Sato, Y. Kang, M.Kamei, T. Magara, Yakasumako (2002),
“Performance of nanofiltration for arsenic removal”, Water Research,
36(13), pp.3371-3377.
[2] S.R. Wickramasinghe, Binbing Han, J. Zimbron, Z. Shen,
M.N. Karim (2004), “Arsenic removal by coagulation and filtration:
comparison of groundwaters from the United States and Bangladesh”,
Desalination, 169(3), pp.231-244.
[3] Gupta, Saini, Jain (2005), “Adsorption of As(III) from aqueous
solutions by iron oxide-coated sand”, Journal of Colloid and interface
Science, 288(1), pp.55-60.
Fig. 4. The desirability, predicted flux, and As rejection as a
function of preparation conditions.
48
Vietnam Journal of Science,
Technology and Engineering
[4] Košutić, et al. (2005), “Removal of arsenic and pesticides
from drinking water by nanofiltration membranes”, Separation and
Purification Technology, 42(2), pp.137-144.
March 2020 • Vol.62 Number 1
Physical Sciences | Chemistry, Engineering
[5] Ming - Cheng Shih (2005) “An overview of arsenic removal
by pressure-drivenmembrane processes”, Desalination, 172(1),
pp.85-97.
“Study on the thin-film composite nanofiltration membrane for the
removal of sulfate from concentrated salt aqueous: preparation and
performance”, Journal of Membrane Science, 310(1-2), pp.289-295.
[6] Figoli, A. Casano, A. Criscuoli, et al. (2010), “Influence of
operating parameters on the arsenic removal by nanofiltration”, Water
research, 44(1), pp.97-104.
[12] A.K. Ghosh, B.H. Jeong, X. Huang, Erik M.V. Hoek (2008),
“Impacts of reaction and curing conditions on polyamide composite
reverse osmosis membrane properties”, Journal of Membrane
Science, 311(1-2), pp.34-45.
[7] H. Saitúa, M. Campderros, S. Cerutti, A.P. Padila (2005),
“Effect of operating conditions in removal of arsenic from water by
nanofiltration membrane”, Desalination, 172(2), pp.173-180.
[8] S. Verissimo, K.V. Peinemann, J. Bordado (2006), “Influence
of the diamine structure on the nanofiltration performance, surface
morphology and surface charge of the composite polyamide
membranes”, Journal of Membrane Science, 279(1), pp.266-275.
[9] M.R. Teixeira, et al. (2005), “The role of membrane charge on
nanofiltration performance”, Journal of Membrane Science, 265(1-2),
pp.160-166.
[10] N. Misdan, W.J. Lau, A.F. Ismail, et al. (2014), “Study on the
thin film composite poly (piperazine-amide) nanofiltration membrane:
impacts of physicochemical properties of substrate on interfacial
polymerization formation”, Desalination, 344, pp.198-205.
[11] L. Meihong, Y. Sanchuan, Z. Yong, Gao Congjie (2008),
[13] Ying Jin, Zhaohui Su (2009), “Effects of polymerization
conditions on hydrophilic groups in aromatic polyamide thin films”,
Journal of Membrane Science, 330(1-2), pp.175-179.
[14] N. Saha, S.V. Joshi (2009), “Performance evaluation of thin
film composite polyamide nanofiltration membrane with variation in
monomer type”, Journal of Membrane Science, 342(1-2), pp.60-69.
[15] Seong-Jik Park, Hye-Kyung An (2015), “Optimization of
fabrication parameters for nanofibrous composite membrane using
response surface methodology”, Desalination and Water Treatment,
57(43), pp.1-11.
[16] Mohammed Kadhom, Baolin Deng (2019), “Synthesis
of high-performance thin film composite (TFC) membranes by
controlling the preparation conditions: technical notes”, Journal of
Water Process Engineering, 30, Doi: 10.1016/J.JWPE.2017.12.011.
March 2020 • Vol.62 Number 1
Vietnam Journal of Science,
Technology and Engineering
49