Erosion trend analysis of coastline along ponnani region using multitemporal images
Bạn đang xem bản rút gọn của tài liệu. Xem và tải ngay bản đầy đủ của tài liệu tại đây (545.15 KB, 12 trang )
Int.J.Curr.Microbiol.App.Sci (2020) 9(3): 2606-2617
International Journal of Current Microbiology and Applied Sciences
ISSN: 2319-7706 Volume 9 Number 3 (2020)
Journal homepage:
Original Research Article
/>
Erosion Trend Analysis of Coastline along Ponnani Region Using
Multitemporal Images
P. S. Sheeja1*, B. Vishnu2 and A. J. Ajay Gokul2
1
Indian Agricultural Research Institute, New Delhi, India
Kerala Agricultural University, Thrissur, Kerala, India
2
*Corresponding author
ABSTRACT
Keywords
Remote sensing,
GIS, Coastal
erosion, Shoreline
change, and Erosion
trend analysis
Article Info
Accepted:
20 February 2020
Available Online:
10 March 2020
A study of coastal erosion along the Ponnani coast using multispectral imageries
and GIS was undertaken to assess the temporal changes in coastal erosion, its
extent, magnitude, and trends in the region under study. The study utilized
medium resolution LANDSAT imageries for the mapping and monitoring of the
coastline erosion. The digital image processing software used for calculating the
erosion rate was TNTmips 2014 professional version (Map and Image Processing
System - MIPS) by MicroImages, Inc. Results showed that many places along the
Ponnani shoreline are under severe erosion. Short-term erosion assessment
revealed that many places were having coastal erosion rates more than -4 m/year.
The impact of these shoreline protection structures and coastal processes on the
erosion process was also taken in to account in this study. The study revealed that
Ponnani is an actively eroding coast with fluctuating erosion rates. The erosion
rates were found to be high with a rate more than -4 m/year for about 35 km of the
coastline considered. The areas with accelerated erosion along the coast of
Ponnani need sustainable management and protective measures.
Introduction
The coastal area is a highly dynamic
environment with many physical processes
such as tidal inundation, sea-level rise, land
subsidence, erosion, and sedimentation; these
processes play an important role in the
shoreline change and coastal landscape
development (Dey et al., 2002). The coastal
zone of the world is under increasing stress
due to the development of industries, trade
and commerce, tourism and resultant human
population growth and migration, and
deteriorating water quality. The shoreline,
which is defined as the position of the landwater interface at one instant in time (Genz et
al., 2007) is a highly dynamic feature and is
an indicator for the coastal erosion and
accretion. Shoreline geometry depends on the
interactions between and among waves, tides,
2606
Int.J.Curr.Microbiol.App.Sci (2020) 9(3): 2606-2617
rivers, storms, tectonic and physical
processes. Beach erosion and accretion or
shifting shorelines and sea-level rise are a
chronic problem along most shorelines
worldwide since centuries disturbing a
dynamic equilibrium.
Developing periodic scientific databases on
various environmental indicators such as
water quality, problematic areas etc. and
carrying out regular assessment and analysis
of the condition of the ecosystem is necessary
to ensure sustainable development. Coastal
zone monitoring, mapping and assessment
can be accomplished with the aid of remote
sensing, GIS and GPS and the results can be
used for sustainable management of coastal
areas. The modern spatial technologies of
remote sensing, GIS and GPS are extremely
valuable in the development of databases and
to analyse coastal area periodically in an
integrated way and to develop management
action plans. Remote sensing technology is
useful for assessing the coastal environment
and monitoring the changes that have
occurred over time in the coastal zone
(Nayak, 2000). The availability of synoptic,
multitemporal, and multispectral data from
various satellite platforms, viz. IRS,
LANDSAT, SPOT, etc. has been helping to
generate information on varied features of the
coastal environment.
Geographic Information System (GIS) is
designed to work with spatial data referenced
by geographical coordinates. The major
advantage of GIS in assessing the coastal
erosion is that it allows identifying the spatial
relationships between features and the
temporal changes that have occurred within
an area over a period. For measuring and
monitoring coastal erosion and accretion,
satellite imagery is useful in extracting the
shorelines, and GIS has been used extensively
to overlay multitemporal shoreline maps to
detect and visualize the changes over time.
Seacoast of Ponnani area in Malappuram
district, Kerala, India has been facing erosion.
There are several houses of especially anglers
near to the coastal area, which are facing the
threat of destruction due to sea erosion. This
region is considered for this particular study
to understand the extent and magnitude of the
erosion problem and to suggest steps to
prevent erosion. It is very important to study
the erosion and accretion processes along the
coast to develop proper erosion control
measures along the coast. The present study
was undertaken to apply remote sensing to
assess the temporal changes on the coastal
areas of Ponnani and to study the extent and
magnitude of the coastal erosion over a period
of 17 years.
Materials and Methods
Remote Sensing imageries use different
wavebands to record the reflected energy
from various features of the earth. This
technology has been using commonly to map
the shoreline and it offers the potential of
updating maps frequently (Frihy and Lofty,
1997). These remotely sensed data can be
used to evaluate the coastal processes like
erosion or accretion and shoreline changes.
Remote sensing satellite images have been
effectively used for monitoring shoreline
changes in different locations (Rao et al.,
1984; Alesheikh et al., 2007).
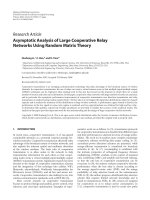
Study area
The study area selected was the coastline
near Ponnani in Malappuram district, along
the central coastline of Kerala extending from
Kuttayi (10°51’31” N, 75°53’44” E) in the
North to Chavakkad (10°33’21” N, 76°0’57”
E) in the South. Ponnani is a seashore town
situated at the mouth of Bharathapuzha (Nila
River), bounded by the Arabian Sea on the
west and estuaries and backwaters on the
northern side. This ancient scenic coastal
2607
Int.J.Curr.Microbiol.App.Sci (2020) 9(3): 2606-2617
town is located at around 10° 46' 3'' N
Latitude and 75° 55' 30 '' E Longitude. It has
an average elevation of five metres above
MSL and it is the smallest taluk of the district.
The major source of income for the people in
the coastline is fishing. The additional source
of income is agriculture involving rice,
coconut and areca nut as the main cultivars.
The tidal port at Ponnani is an important
fishing harbour and houses the office of the
Malappuram district fisheries board.
The Bharathapuzha River is the secondlongest river of Kerala, originating from the
Anamalai Hills (1964 m above mean sea
level) in the Western Ghats. The river below
the confluence of Bharathapuzha and
Gayathripuzha is also called the Ponnani
River. Bharathapuzha flows through the
districts of Palakkad, Malappuram and
Thrissur and drains into the Lakshadweep Sea
near Ponnani town in Malappuram district.
There are several beaches along the Ponnani
coastline. Padinjarekkara beach is the tidal
mouth
of
Bharathapuzha
where
Bharathapuzha and Tirur River join and
drains into the Arabian Sea. The major fishing
harbour of Ponnani is situated on the southern
side of the mouth of the Bharathapuzha River.
Padinjarekkara beach is a beautiful, clean, and
unpolluted beach, which forms the habitat of
several migratory birds during the months of
February and March. Veliyamcode beach is
situated towards the south of the mouth of one
of the tributaries of Bharathapuzha River. The
whole beach is protected by a seawall, with
some frontal beach left. Here the coast is
considerably wider than that at Veliyamcode.
The sea wall is 20-25 m away from the sea.
The coastal area between Kuttayi and
Chavakkad was considered for the study and
the coastal area in between these two places
was divided into 10 coastal zones like:
Zone 1 - Kuttayi,
Zone 2 - Padinjarekkara Azhimukham
Zone 3 - Ponnani
Zone 4 - Puthuponnani
Zone 5 - Veliyamcode
Zone 6 - Palappetty
Zone 7 - Andathode
Zone 8 - Punnayur
Zone 9 - Edakkazhiyur and
Zone 10 - Chavakkad
The Ponnani coast that extends over a length
of 35 km between Kuttayi and Chavakkad
which is interspersed with rivers, unprotected
coast and coast with man-made sea erosion
protection structures was considered for
assessment of erosion. The Malabar Coast is
generally rocky and lateritic on crystalline
and tertiary formations with alluvial patches,
but the Ponnani stretch is composed of
alluvium. Alluvial soils are soils of the low
lands and are mainly seen along the coastal
plains and valleys. The texture of these soils
ranges from exclusively drained to
moderately well-drained sand to sandy clay in
nature.
Landsat Thematic Mapper (TM) imageries of
the coast of Ponnani region acquired for
different periods from 1999 up to June 2014
were used for the long-term erosion and
accretion
assessment.
False-colour
composites with different bands were tested
for visualisation of the shoreline. Band 4 was
found to be most effective for mapping
shoreline and this was used for the coastline
extraction
Image pre-processing and coastal erosion
assessment were carried out using the
TNTmips software.
The spatial filters used to obtain the discrete
line between land and water were:
a) Grayscale LACE filter for enhancement of
spatially varying contrast
2608
Int.J.Curr.Microbiol.App.Sci (2020) 9(3): 2606-2617
affected areas are classified as;
b) P-median filter for noise reduction and
High ( Erosion rates more than -4 m/year)
Medium (Erosion rates between -2 and -4
m/year)
Low (Erosion rates between 0 and -2
m/year)
c) Volterra / unsharp Filter for edge
enhancement of the imageries.
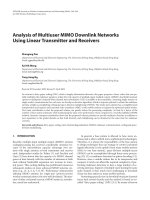
An SML script that generates transects, or
lines orthogonal to a shore baseline, has been
developed for use with TNT products. A
baseline and at least two subsequent shoreline
measurements are all that is required to
produce transects (lines orthogonal to the
baseline) with associated erosion rates. The
erosion rate along each transect is provided as
a DataTip over the transect.
Multitemporal Landsat TM imageries of 1999
and 2014 were used for analysing erosion
trend analysis along the coast for periods of
1999-2000, 2002-2003, 2005-2006, 20082009, 2013-2014, and 2015-2016 The erosion
rates are recorded as both an End Point Rate
(EPR) and a mean rate along each transect.
The landward movement of the shoreline
(erosion) was expressed as a negative number
in this system. The End Point Rate reflects the
length along a transect between the earliest
and most recent shorelines and the time
between these two shoreline positions. If the
distance along a transect between the earliest
and most recent shorelines.
Results and Discussion
Erosion trend analysis
The trend in the temporal variation of erosion
rates along the study area was explored by
estimating the rate of erosion occurred at each
coastal zones namely Kuttayi, Padinjarekkara
Azhimukham,
Ponnani,
Puthuponnani,
Veliyamcode,
Palappetty,
Andathode,
Punnayur, Edakkazhiyur, and Chavakkad in
different periods during the period under
study. Data is provided in appendix I.
According to the erosion rates, the erosion
Kuttayi beach lies at the location between
10°51’31” N, 75°53’44”E and 10°48’33” N,
75°54’22” E. This coast is adjacent to
Padinjarekkara Azhimukham where the
Bharathapuzha and Tirur River joins and
drain into the Arabian Sea. This coast was
under severe erosion before 2002 with a
maximum rate of -3.82 m/year in 1999 and
followed by -3.25 m/year in 2001 (Fig. 3).
However, after 2003 there was an abrupt
reduction in erosion rate, which may be due to
the construction of the breakwater at
Padinjarekkara, which lead to the deposition
of sand near the structure. The Net Shoreline
Movement (NSM) that was calculated at this
zone was -10.7 m during
the period under study (Table 1). The average
landward shift of the shoreline at Kuttayi
coast was around 1 m per year. The study of
shoreline changes at Kuttayi coastal zone
reveals its low erosion rate, which indicates
fair stability of the coast.
Padinjarekkara
Azhimukham
extending
between 10°48’33” N, 75°54’22” E and
10°47’09” N, 75°54’42” E was the zone with
the maximum erosion rate during the
seventeen years under study (Fig. 3). The
variation of erosion rate here is having a
similar pattern as that of Kuttayi zone in
which a drastic variation in shoreline change
was identified after 2001. The Net Shoreline
Movement was recorded as -11.1 m (Table 1).
Ponnani zone lies between 10°47’09” N,
75°54’42” E and 10°45’35” N, 75°55’26” E
to the south of the Padinjarekkara zone.
Erosion trend analysis along this coast is
2609
Int.J.Curr.Microbiol.App.Sci (2020) 9(3): 2606-2617
given in Fig. 3. Erosion along this coast
follows a different pattern than that in
Padinjarekkara and Kuttayi zones. The coast
was identified with more coastal changes
before 2003 and the estimate crossed -4
m/year. Some parts of the coasts are protected
with sea wall. After 2003 erosion rate reduced
to a value of -2.56 m/year in 2007 and again
increased to -2.98 m/year during 2009 and it
has reached a high rate of -3.86 m/year in
2013. As in the case of Padinjarekkara coast,
Ponnani zone is also categorized as eroding
coast. During the seventeen-year study period,
the estimated NSM at this coast was -11.3 m
(Table 1). A speciality of this coast is the
presence of mangroves in this place, which
are found distributed over the shores of
Ponnani near the fishing harbour.
Puthuponnani coast extends south of Ponnani
zone between 10°45’35” N, 75°55’26” E and
10°43’26” N, 75°56'22" E. It is in this zone
that the Lake Biyyam joins the Arabian Sea.
Like the Ponnani zone, a major portion of the
coastline is protected with sea wall except for
the stretch where the Biyyam Lake joins the
sea. Results (Fig. 3) show a varying pattern
over the study period. The coast had higher
erosion before 2003 and the reduction in
erosion rate after 2003 may be due to the
influence of the erected sea wall. The coast
has experienced a medium erosion rate of
average value -3.25 m/year from 2003 to
2007. This value is almost equal to the rate of
erosion that Ponnani zone has experienced in
2002. However, after 2007, the coastline had
recorded high erosion rates, which cross -4
m/year during 2009 and 2016, and in 2011 it
was -3.62 m/year.
The NSM recorded at this zone was -11.1 m
(Table 1) that indicated that the coastline has
reached the sea wall, which was 10-15 m
away from the sea, initially. This means that
the coastline without protection has advanced
11 m landward during the seventeen years of
the study period and this landward
advancement was found to be more near the
point where the Lake Biyyam joins the sea.
This coastal zone is also categorized under the
eroding coast.
Veliyamcode beach is located to the south of
Puthuponnani area and lies between
10°43’26” N, 75°56’22” E and 10°42’27” N,
75°56'50" E. Fig. 3 shows that Veliyamcode
is an eroding coast. During 1999-2002 rate of
erosion was recorded as more than -4 m/year
with maximum erosion in 1999. In 2003 the
coastal change was found to be -2.65 m/year
and reached a minimum change in 2005 with
a rate of -2.03 m/year. The erosion rate
observed has increased in 2007 and followed
by more coastal changes in the proceeding
periods. After 2007, the coast has undergone a
higher erosion rate in the year 2009 with an
estimated erosion rate of -3.81 m/year. The
NSM recorded at this place was -10.85 m
(Table 1). Veliyamcode zone is also
categorized under the eroding coasts.
Palappetty
coast
extends
south
of
Veliyamcode
between
10°42’27”
N,
75°56’50” E and 10°41’10” N, 75°57’22” E.
The erosion pattern along this coast is
somewhat similar to the Veliyamcode zone.
The coast has experienced maximum erosion
during 1999 with a rate -4.78 m/year and
followed by a gradually reduced shoreline
change until 2005 (Fig. 4). After this period,
erosion was found to be increasing and
reached a higher value in 2009 like in the
Veliyamcode zone. However, a sudden
reduction in erosion was noted in 2011, which
was -2.15 m/year, and again in 2016, it has
increased to -3.26 m/year. Palappetty is a
place that undergoes severe erosion during
every monsoon season. In this study, this
region had recorded a higher erosion rate
during 2009. Like the other four coastal
zones, this place also is coming under the
eroding coast category with NSM of -15.65 m
2610
Int.J.Curr.Microbiol.App.Sci (2020) 9(3): 2606-2617
in the period under study (Table 1).
Location of Andathode coast is between
10°41’10” N, 75°57’22” E and 10°39’44” N,
75°58’02”E to the south of Palappetty coast.
Analysis (Fig. 3) shows that this area is not
under severe erosion as the coast has not
experienced erosion rate more than -2.5
m/year. The maximum erosion estimated
along the coastline was -2.36 m/year in 1999
in which all other coasts have experienced
highest erosion. From 1999 to 2007, the
erosion rates reduced gradually with an
increase in 2005. In 2009, the year in which
all the previous coast zones also experienced
comparatively high erosion, this coast was
found to have an erosion rate of -1.98 m/year
which is the maximum rate after 2001. The
results reveal that Andathode coast was under
medium erosion with estimated NSM of -7.3
m (Table 1). In this zone, the area where
people live and cultivate is away from the
coastline, thus avoiding the threat of
destruction, as seawater does not reach this
area. This is not an artificial coast and is
categorized under low erosion areas.
Punnayur zone lies to the south of Andathode
zone between 10°33’44” N, 75°58’02”E and
10°37’45” N, 75°58'53" E. Erosion pattern
over this area is different from other zones.
This area has not experienced erosion more
than -2 m/year except in 2009 (Fig. 4). During
1999, the coast has undergone less erosion
with a rate -1.56 m/year and up to 2003
erosion was gradually increasing to a value of
-1.78 m/year. During 2005-2007, erosion was
very less which again increased to a
maximum rate of 2.02 m/year. Seawater
entered into few houses and caused the loss of
properties (Anon., 2012) in the monsoon
season. Punnayur coast is the place identified
with more erosion than that in 1999. The
NSM calculated for this coast was -8.9 m and
is categorized under low erosion areas (Table
1).
Location of Edakkazhiyur coast is between
10°37’45” N, 75°58’53” E and 10°35’29” N,
75°59’59” E and it is situated to the south of
Punnayur area. The erosion trend analysis
(Fig. 4) along this area reveals that it had a
maximum rate of erosion during 2009 and this
value crossed erosion rate during 1999 like in
the case of Punnayur coast. But the highest
erosion rate recorded in this area was -1.59
m/year, which is comparatively low. From
2005 to 2013 the coastline has undergone
almost similar erosion process with an
increase in 2009.
Table.1 Net Shoreline Movement in the coastal zones
Place
Kuttayi
Padinjarekkara
Ponnani
Puthuponnani
Veliyancode
Palappetty
Andathode
Punnayur
Edakkazhiyur
Chavakkad
Erosion
(m/year)
-1.18
-1.14
-1.42
-2.74
-3.39
-3.71
-1.82
-1.26
-1.35
-2.45
2611
Accretion
(m/year)
0.78
1.12
1.25
1.1
1.32
1.56
1.15
0.96
1.16
1.14
NSM
(m)
-10.7
-11.1
-11.3
-11.1
-10.85
-15.65
-07.3
-08.9
-05.25
-05.75
Int.J.Curr.Microbiol.App.Sci (2020) 9(3): 2606-2617
Figure.1 Study area
Figure.2 Erosion assessment by creating transects
2612
Int.J.Curr.Microbiol.App.Sci (2020) 9(3): 2606-2617
Figure.3 Erosion trend of Zone 1 to 5
Figure.4 Erosion trend of Zone 6 to 10
Figure.5 Erosion at the end of the structre
2613
Int.J.Curr.Microbiol.App.Sci (2020) 9(3): 2606-2617
Figure.6 Damaged sea wall at Veliyamcode coast
The NSM calculated in this zone was -5.25 m
and this zone is coming under low erosion
areas (Table 1). Chavakkad zone lies to the
south of Edakkazhiyur coast between
10°35’29” N, 75°59’59” E and 10°33’21” N,
76°0’57” E. This coast has experienced
erosion rate more than -4 m/year. The NSM
estimated for this area was -5.75 m during the
15 years under study (Table 1). The highest
rate of erosion calculated along the coast was
-4.98 m/year in 2005 (Fig. 4). After this,
erosion recorded was found to be less than -4
m/year in 2007 and 2011 but an increasing
trend was observed after 2013. The average
erosion was much more on this coast,
compared to Edakkazhiyur. This coast is also
categorized under eroding coasts and the
higher erosion rate over this area is a matter
of concern.
The overall analysis of the extent of erosion
by direct inspection at various parts (Ponnani,
Bharathapuzha River mouth, Veliyancode and
Palappetty zone and Periyambalam beach in
Punnayur zone) of study area revealed that
many parts of the shoreline with or without
protection are under the threat of accelerated
erosion. Analysis of erosion trend along
Ponnani coast showed continuous erosion
every year with a decreasing trend from 1999
to 2011 and a sudden increase in the rate in
2013. This may be due to the entry of surging
waves to the land through the gaps formed in
the sea wall (Anon, 2013). During every
monsoon season, people along the coastal belt
here face the threat of destruction by the
furious waves.
The estuary here is protected against erosion
with the aid of two breakwaters of 780 m
(north) and 570 m (south) constructed with a
centre-to-centre distance of 270 m. It was
observed that there was a tremendous
reduction in the coastal changes after the
establishment of the breakwaters in the
estuary. The analysis of the shoreline change
data shows that there is considerable accretion
and net advancement of coastline on the north
breakwater
(between
Kuttayi
and
Padinjarekkara) and net erosion on the south
of southern breakwater (Ponnani). Similar
result has been reported by Tang et al.,
(2017). The estimate of the erosion trend of
the estuary in the present study is analogous
to the results reported in two other previous
studies (Kunhimammu et al., 2008 and
Ramesh et al., 2013). As this is a protected
shoreline, it is an artificial coast and even
though the zone is provided with erosion
control structures, it is an eroding coast. The
2614
Int.J.Curr.Microbiol.App.Sci (2020) 9(3): 2606-2617
rise of sea level during monsoon is more in
this area, leading to high erosive velocities of
waves but the breakwaters ensure protection
along the coast.
Out of the 35 km coastal stretch under study,
around 10 km stretch is protected with sea
wall. Construction of sea wall is intended to
protect the upstream end of coastline from
erosion; however, this also causes increased
erosion. An eroding coast supplies sediments
to sediment transport. But when the erosion is
controlled at certain sections by the
establishment of seawalls, the supply of sand
from this section of the shoreline to the
sediment transport along the adjacent
shorelines will get stopped, thereby the
shorelines at the end of structures is exposed
to increased erosion. The increased depth of
water near the sea wall will produce highenergy waves causing destruction of the
structure as the waves gets stronger. The
increased erosion rates after 2009 may be due
to the destruction of the sea wall and here the
inadequacy of the present sea wall to resist
the high-energy waves can be recognised.
Inadequacy of seawall due to scouring has
been reported by Ahmad et al., (2019).
Construction of sea wall is intended to protect
the upstream end of coastline from erosion;
however, this also caused increased erosion in
some parts of the coast. An eroding coast
supplies sediments to sediment transport. But
when the erosion is controlled at certain
sections by the establishment of seawalls, the
supply of sand from this section of the
shoreline to the sediment transport along the
adjacent shorelines will get stopped, thereby
the shorelines at the end of structures is
exposed to increased erosion. The increased
depth of water near the sea wall will produce
high-energy waves causing destruction of the
structure as the waves gets stronger. Bush et
al., (2004), and French et al., (2001) have also
reported similar process.
At many places along this zone, the sea wall
is destroyed by the high-energy waves and the
remains are ineffective in controlling the
erosion. It was reported that steps are being
taken to reconstruct the sea walls destroyed in
sea erosion in Ponnani coast (Anon., 2009).
The mangrove forest present in the coast was
found to be not effective on the eroding
process, as it could not significantly dissipate
the wave energy. Similar results have been
reported by Ngyuen and Luong (2019).
Mangroves were identified along the banks of
Tirur River also but it has no role in
controlling the coastal erosion. Mangroves
can reduce erosion as they store water for
long periods and their capacity during heavy
rainfall to retain excess floodwater results in
maintaining a constant flow as well as less
erosive effects of sea waves (Triyanti et al.,
2017). However, there is no significant cover
of mangroves there to have an impact on the
coastal erosion and at present; the mangroves
in Ponnani are nearing extinction.
Sea erosion at Puthuponnani worsened and
the surging sea waves destroyed houses and
coconut trees along the coastal belt (Anon,
2012; Anon, 2013). High erosion rate was
observed along Puthuponnani coast during
this period. The fluctuating coastal erosion
due to wave action along the southwest coast
of Kanyakumari has been reported by Kaliraj
et al., (2013). Sea wall at different parts along
Veliyamcode coastline was found to be
damaged (Anon., 2009).
Damage of many houses, sea wall and
uprooting of several trees due to tidal waves
during monsoon season were reported by
Anon, 2004 and Anon, 2012. However,
attempts to form a green wall with casuarinas
did not yield the expected results, as the
lashing tidal waves uprooted most of them.
This shows that the already built structure was
inadequate to resist the erosive high-energy
waves in this coastline. During the time of
2615
Int.J.Curr.Microbiol.App.Sci (2020) 9(3): 2606-2617
monsoon, destruction of trees, houses, and sea
wall occurs every year in this zone.
In conclusion, the Ponnani coast was found to
an active eroding coast. The highest coastal
erosion rate of -3.71 m/year in the long-term
erosion assessment was observed at
Palappetty. During 1999-2000, highest
erosion rates were observed in almost all the
zones, but after this period, only three coastal
zones have experienced more erosion than
this.
The erosion trend analysis shows that the
erosion rate is decreasing from the point of
commencement of the breakwater at the
mouth of the Bharathapuzha River to the
Southern side where shoreline protection
structures are in place. However, it was found
that these structures could not withstand the
continued severe erosive action of the wave
action during the monsoon season, failing
these structures at many places causing loss of
life and property along the coast during fierce
monsoon climate. This indicates that the
accelerated erosion at these spots led to the
instability of the structure and additional
measures are required at these spots.
References
Anonymous. 2009. Steps to prevent sea
erosion in Ponnani. The Times of India,
19 June. 2009, p.3.
Anonymous. 2012. Heavy rain leaves roads
flooded. The Hindu, 13 June. 2012, p. 3.
Anonymous. 2013. Sea erosion worsens at
Puthuponnani. The Hindu, 9 June. 2013,
p. 2.
Aleshelkh, A.A., Ghorbanall, A., and Nouri,
N. 2007.Coastline change detection
using remote sensing. Int. J. Environ.
Sci. Technol. 4(1): 61-66.
Dey, S., Dutta, S., and Adak, S.B. 2002.
Holocene sea level change of West
Bengal coast. Indian Geogr. J. 77(1): 7-
20.
Frihy, O.E. and Lofty, M.F. 1997. Shoreline
changes and beach sand sorting along
the Northern Sinai coast of Egypt. GeoMar. Lett. 17(2): 140-146.
Genz, A.S., Fletcher, C.H., Dunn, R.A.,
Frazer, L.N., and Rooney, J.J. 2007.
The predictive accuracy of shoreline
change rate methods and Alongshore
beach variation on Maui, Hawaii. J.
Coast. Res. 23(1): 87–105.
Kunhimammu, P., Jayadee, T., Sheik, P. P. I.
2008. Influence of estuarine breakwater
constructions on Kerala Coast in India.
Proceedings of 16th IAHR-APD
Congress and 3rd Symposium of IAHRISHS, 20-23 October 2008, Hohai
University, Nanjing, China, pp 12291233.
Nayak, S. 2000. Critical issues in coastal zone
management and role of remote sensing.
Subtle Issues in Coastal Management,
Proceedings of Science Conference,
Indian Institute of Remote Sensing,
Dehradun. pp. 77-98.
Ramesh, R., Purvaja, R. and Senthil, V.A.
2013. Shoreline change assessment for
Kerala
Coast.
Available:
/>/kerala_fact_sheet.pdf.
Rao, P.P., Nair, M.M., and Raju, D.V. 1984.
Assesment of the role of remote sensing
techniques in monitoring shoreline
changes: A case study of Kerala coast.
Int. J. Remote Sens. 6(4): 549-558.
Triyanti, A., Bavinck, M., Gupta, J. and
Marfai, M. A. 2017. Social capital,
interactive governance and coastal
protection: The effectiveness of
mangrove ecosystem-based strategies in
promoting inclusive development in
Demak, Indonesia. Ocean Coast.
Manag. 150: 3-11.
Ahmad, N., Bihs, H., Myrhaug, D., Kamath,
A. and Arnsten, O. 2019. Numerical
modeling of breaking wave induced
2616
Int.J.Curr.Microbiol.App.Sci (2020) 9(3): 2606-2617
seawall scour. Coast. Eng. 150: 108120.
Nguyen, H.T.L. and Luong, H.PV 2019.
Erosion and deposition processes from
field experiments of hydrodynamics in
the coastal mangrove area of Can Gio,
Vietnam. Oceanologia. 61(2): 252-264.
Kaliraj, S., Chandrasekhar, N. and Magesh
N.S. 2014. Evaluation of coastal erosion
and accretion processes along the
southwest coast of Kanyakumari, Tamil
Nadu using geospatial techniques. J.
Coast. Sci. 1(1): 63-71.
Bush, D.M., Neal, W.J., Longo, N.J.,
Lindeman, K.C., Pilkey, D.F., Esteves,
L.S., Congleton, J.D. and Pilkey, O.H.
2004. Living with Florida’s Atlantic
Beaches: Coastal Hazards from Amelia
Island to Key West. USA: Duke
University Press. 352 p.
French, P.W. 2001. Coastal defences:
Processes, Problems and Solutions.
London: Routledge. 388p.
How to cite this article:
Sheeja, P. S., B. Vishnu and Ajay Gokul, A. J. 2020. Erosion Trend Analysis of Coastline
along Ponnani Region Using Multitemporal Images. Int.J.Curr.Microbiol.App.Sci. 9(03): 26062617. doi: />
2617