Molecular and cellular characteristics of hybrid vigour in a commercial hybrid of Chinese cabbage
Bạn đang xem bản rút gọn của tài liệu. Xem và tải ngay bản đầy đủ của tài liệu tại đây (1.31 MB, 15 trang )
Saeki et al. BMC Plant Biology (2016) 16:45
DOI 10.1186/s12870-016-0734-3
RESEARCH ARTICLE
Open Access
Molecular and cellular characteristics of
hybrid vigour in a commercial hybrid of
Chinese cabbage
Natsumi Saeki1†, Takahiro Kawanabe2†, Hua Ying3, Motoki Shimizu1, Mikiko Kojima4, Hiroshi Abe5, Keiichi Okazaki1,
Makoto Kaji6, Jennifer M. Taylor3, Hitoshi Sakakibara4, W. James Peacock3,7, Elizabeth S. Dennis3,7
and Ryo Fujimoto2,8*
Abstract
Background: Heterosis or hybrid vigour is a phenomenon in which hybrid progeny exhibit superior performance
compared to their parental inbred lines. Most commercial Chinese cabbage cultivars are F1 hybrids and their level
of hybrid vigour is of critical importance and is a key selection criterion in the breeding system.
Results: We have characterized the heterotic phenotype of one F1 hybrid cultivar of Chinese cabbage and its
parental lines from early- to late-developmental stages of the plants. Hybrid cotyledons are larger than those of the
parents at 4 days after sowing and biomass in the hybrid, determined by the fresh weight of leaves, is greater than
that of the larger parent line by approximately 20 % at 14 days after sowing. The final yield of the hybrid harvested
at 63 days after sowing is 25 % greater than the yield of the better parent. The larger leaves of the hybrid are a
consequence of increased cell size and number of the photosynthetic palisade mesophyll cells and other leaf cells.
The accumulation of plant hormones in the F1 was within the range of the parental levels at both 2 and 10 days
after sowing. Two days after sowing, the expression levels of chloroplast-targeted genes in the cotyledon cells were
upregulated in the F1 hybrid relative to their mid parent values. Shutdown of chlorophyll biosynthesis in the
cotyledon by norflurazon prevented the increased leaf area in the F1 hybrid.
Conclusions: In the cotyledons of F1 hybrids, chloroplast-targeted genes were upregulated at 2 days after sowing. The
increased activity levels of this group of genes suggested that their differential transcription levels could be important
for establishing early heterosis but the increased transcription levels were transient. Inhibition of the photosynthetic
process in the cotyledon reduced heterosis in later seedling stages. These observations suggest early developmental
events in the germinating seedling of the hybrid may be important for later developmental vigour and yield advantage.
Keywords: Heterosis, Hybrid vigour, Yield, gene expression, Chloroplast-targeted genes, Chinese cabbage
Background
Hybrid vigour or heterosis refers to the superior performance of hybrid progeny relative to their parents, and this
phenomenon is important in the production of many crops
and vegetables. Genetic analyses of F1 hybrids in maize and
rice have defined a large number of QTLs, which may
* Correspondence:
†
Equal contributors
2
Graduate School of Agricultural Science, Kobe University, Rokkodai, Nada-ku,
Kobe 657-8501, Japan
8
Japan Science and Technology Agency (JST), Precursory Research for
Embryonic Science and Technology (PRESTO), Saitama 332-0012, Japan
Full list of author information is available at the end of the article
make contributions to heterosis. Gene interactions such as
dominance, overdominance, pseudo-overdominance, and
epistasis have been suggested to explain the development
of heterosis [1, 2]. Recent molecular analyses of transcriptomes, proteomes, and metabolomes, together with reference to the epigenome of the parents and hybrids have
begun to uncover some new facts about the generation of
hybrid vigour [3–6]. High-throughput sequencing technology enables us to not only compare the expression level of
genes between the F1 and parental lines but also to examine the parental allelic contributions to gene expression in
F1 hybrids at the whole genome level [7].
© 2016 Saeki et al. Open Access This article is distributed under the terms of the Creative Commons Attribution 4.0
International License ( which permits unrestricted use, distribution, and
reproduction in any medium, provided you give appropriate credit to the original author(s) and the source, provide a link to
the Creative Commons license, and indicate if changes were made. The Creative Commons Public Domain Dedication waiver
( applies to the data made available in this article, unless otherwise stated.
Saeki et al. BMC Plant Biology (2016) 16:45
In Arabidopsis thaliana, several hybrids such as
Columbia-0 (Col) x C24 and Landsberg erecta (Ler) x C24
show heterosis in vegetative biomass. A heterosis phenotype is seen in early development with hybrids having
increased cotyledon size only a few days after sowing
[8–11]. The efficiency of the photosynthetic process is
equivalent in parents and C24 x Col hybrids, and leaves of
the hybrids are larger than the leaves of the parents. The
total amount of photosynthesis is greater in the hybrids
than in parents because of the larger leaves [9].
The genus Brassica includes important vegetables
(Brassica rapa L. and Brassica oleracea L.) and oilseed
crops (Brassica napus L.), and is related to A. thaliana.
B. rapa vegetables such as Chinese cabbage (var. pekinensis), turnip (var. rapa), pak choi (var. chinensis), and
Komatsuna (var. perviridis) are widely grown in Asia.
Most cultivars of B. rapa are self-incompatible, preventing self-fertilization, although some oilseed cultivars
(var. tricolaris) are self-compatible [12–14]. In Japan,
most B. rapa commercial varieties are F1 hybrid cultivars
which have increased yields relative to their parents.
Self-incompatibility or cytoplasmic male sterility is utilized in producing the F1 hybrid seeds [14].
Though there is no doubt that F1 hybrids exhibit heterosis in yield, there are few reports evaluating the yield
characteristics of Chinese cabbage hybrids, and there is
no report focusing on early developmental stages of the
hybrid plant. In this study, we examined the plant size
and hormone concentrations in early seedlings and yield
in the commercial Chinese cabbage hybrid “W39” and
its parents to find when heterosis occurs and how much
the yield increases in the F1 hybrid relative to parental
lines. It has been suggested that heterosis could be a
result of changes in the transcriptional network. We
identified the differentially expressed genes between the
F1 and parental lines together with the allele-specific
expressed genes in the F1 at 2 days after sowing (DAS)
by RNA sequencing (RNA-seq). We found that increased production of photosynthesis in the first week
after germination is critical for heterosis and that upregulation of chloroplast-targeted genes at 2 DAS might
contribute to this process.
Methods
Plant materials
A commercial F1 hybrid cultivar of Chinese cabbage,
“W39” (Watanabe Seed Co. Ltd., Japan), and its parental
inbred lines, S27 (female) and R29 (male), were used for
analysis of the heterosis phenotype. Selfed seeds of parental lines were harvested using honeybees as pollinators
after spraying with NaCl solution, which weakens the
self-incompatibility. Seeds of F1 hybrids were harvested
by open crossing between parental lines. Fifty dry seeds
of parental lines and hybrids were weighed and statistical
Page 2 of 15
comparisons of the weight of 50 dry seeds were performed using Student’s t-test (p < 0.05).
Plants were grown in plastic dishes containing Murashige
and Skoog (MS) agar medium supplemented with 1.0 % sucrose (pH 5.7) in growth chambers under a 16-h/8-h light/
dark cycle at 22 °C. The parents and hybrids were placed at
equal intervals on the same agar plate divided into two or
four regions (Additional file 1: Fig. S1A), and samples were
harvested for examination of cotyledon/leaf area and cell
size, flow cytometric analysis, hormonome analysis, chlorophyll quantification, and expression analysis.
For the inhibitor studies, seedlings were grown for a
week on MS plates and transferred to MS plates with 1.0
μM norflurazon (Sigma-Aldrich), or seeds were sown on
the MS plates with 1.0 μM norflurazon and after one
week treated seedlings were transferred to MS plates.
For examining the yield under field conditions, seeds
were sown on multi cell trays on 17th August 2011 and
grown in a greenhouse. On 5th September 2011, seedlings
were transplanted to the field at Osaki, Miyagi, Japan (38°
57’N, 141°00’E). Thirty plants per plot were transplanted
and plot size was 13.5 x 0.7 meters. Row spacing is 70 cm
and planting distance is 40 cm. On 29th October 2011,
plants were harvested. Statistical comparisons of fresh
weight of total biomass and harvested biomass were performed using Student’s t-test (p < 0.05).
Cotyledon/leaf area and cell size
Cotyledons in seeds, cotyledons at 2, 4, or 6 DAS, and
1st and 2nd leaves at 10, 12, or 14 DAS were fixed in a
formalin/acetic acid/alcohol solution (ethanol: acetic
acid: formalin = 16: 1: 1). The image of the whole cotyledon or leaf was photographed under a stereoscopic
microscope, and sizes were determined with Image-J
software ( After examination
of cotyledon or leaf area, they were cleared in a chloral
hydrate/glycerol/water solution (chloral hydrate: H2O:
glycerol = 8: 2: 1), and the samples were photographed
under Nomarski optics. The palisade cell number per
fixed unit area in the subepidermal layer of the center of
the leaf blade between the midvein and the leaf margin
was counted. More than three independent experiments
were performed for examination of cotyledon/leaf area
and cell size. Statistical comparisons of cotyledon/leaf
area and cell size were performed using Student’s t-test
(p < 0.05).
Flow cytometric analysis
Nuclei from cotyledons at 6 DAS or 1st and 2nd leaves at
14 DAS grown on MS agar plates in a growth chamber
were released in nuclei extraction buffer by lightly chopping the cotyledons or leaves with a razor blade and
stained following the manual of Partec CyStain UV precise
P (PARTEC). Ploidy levels were measured by a Ploidy
Saeki et al. BMC Plant Biology (2016) 16:45
Page 3 of 15
Analyzer (PARTEC). Flow cytometry experiments were
repeated three times using cotyledons or true leaves from
different plants.
Hormone analysis
The 2 day cotyledon and 10 day 1st and 2nd leaves were
harvested. Plant hormones were extracted, purified, and
quantified as described previously [15, 16]. Statistical comparisons of plant hormone contents were performed using
Student’s t-test (p < 0.05).
Chlorophyll extraction and quantification
Cotyledons at 6 DAS were ground in 80 % (vol/vol) acetone. Absorbance of the supernatants was measured at
646.6 and 663.6 nm, and concentrations of total chlorophyll were calculated using the following formulae: total
chlorophyll (μg/mL) = 17.76 × A646.6 + 7.34 × A663.6. Data
presented are the average and standard error (SE) from six
biological replications.
Gene expression analysis
The parents and hybrids were grown on MS agar plates in
a growth chamber. Total RNA was isolated from five
bulked cotyledons of both hybrids and parents from 2 – 6
DAS using the SV Total RNA Isolation System (Promega).
cDNA was synthesized from 500 ng total RNA using
PrimeScript RT reagent Kit (Takara bio). Prior to quantitative RT-PCR, the specificity of the primer set for each
gene was first tested by electrophoresis of PCR amplified
products using EmeraldAmp MAX PCR Master Mix
(Takara bio) on 2.0 % agarose gel in which single products
were observed. Absence of genomic DNA contamination
was confirmed by the PCR of no RT control. PCR conditions were 95 °C for 3 min followed by 30 cycles of 95 °C
for 30 s, 55 °C for 30 s, and 72 °C for 30 s.
Quantitative RT-PCR was performed using a LightCycler
Nano (Roche). The cDNA was amplified using FastStart
Essential DNA Green Master (Roche). PCR conditions
were 95 °C for 10 min followed by 40 cycles of 95 °C for 10
s, 60 °C for 10 s, and 72 °C for 15 s, and Melting program
(60 °C to 95 °C at 0.1 °C/s). After amplification cycles, each
reaction was subjected to melt temperature analysis to confirm single amplified products. The relative expression level
of each gene relative to ACTIN (Bractin) was automatically
calculated using automatic CQ calling according to the
manufacturer’s instructions (Roche) [17]. Data presented
are the average and SE from three biological and experimental replications and statistically analysed using the
Student’s t-test, p < 0.05. The primers used in this study are
listed in Additional file 2: Table S1.
RNA sequencing
Cotyledons were collected at 2 DAS and total RNA was
isolated with SV Total RNA Isolation System (Promega).
Sequence library preparation, sequencing, mapping short
reads, identification of differentially expressed genes,
and gene ontology analysis were followed as described
previously [18]. RNA-seq was performed using Illumina
Hiseq2000. Totally, 16,357,770 (~1500 Mbp), 17,548,397
(~1600 Mbp), and 16,267,428 (~1500 Mbp) reads in S27,
R29, and F1 were uniquely mapped to Brassica genome
release 1.2, respectively. The gene expression level was
scored by fragments per kilobase per million (FPKM). The
merged reads of S27 and R29 were used for mid-parent
values (MPV).
We searched the SNPs between S27 and R29 from
RNA-seq data with a minimum coverage of eight reads
per site. Of 41,174 annotated genes, 10,931 genes (26.5 %)
had no reads both in S27 and R29, and 12,770 (31.0 %)
genes had more than one SNP.
Results
Heterosis can be detected in young seedlings
We followed the development of the leaves in the hybrid
and parents from germination to 30 DAS. The germination rate did not differ among parental lines and F1
hybrids. The R29 parent had more leaves from 12 to 30
DAS than did the F1 hybrid or the S27 parent (Additional
file 1: Fig. S1B). At 30 DAS the F1 hybrid had 71 % and 11
% greater fresh weight than the S27 and R29 parental lines,
respectively (Additional file 1: Fig. S1C).
The mature seeds of the F1 hybrid have a greater dry
weight than the parental seeds (Table 1), and the cotyledon
in the mature F1 seed has an increased area relative to the
area of the cotyledon in the better performing parent R29
(Table 1). We checked whether the increased size of the F1
cotyledon was due to an increased number or to increased
size of the palisade mesophyll cells in the cotyledon, or
whether both factors apply. The adaxial layer of palisade
mesophyll cells has fewer cells per unit area in the F1
Table 1 Dry weight, cotyledon size, and cell number per unit area of cotyledon in mature seeds
S27 (female)
R29 (male)
F1-S27 × R29
50 seed weight (mg)
138.3 ± 1.0a (n = 5)
160.4 ± 1.3b (n = 5)
171.9 ± 4.6c (n = 5)
Cotyledon area (mm2)*
2.72 ± 0.08a (n = 30)
3.04 ± 0.08b (n = 30)
3.27 ± 0.08c (n = 30)
Cell number per unit area (250 μm2)
55.09 ± 1.89b (n = 11)
61.91 ± 1.48c (n = 11)
47.77 ± 1.25a (n = 13)
Different letters indicate significant differences at p < 0.05 (Student’s t-test)
*The area is half of the cotyledon
Mean ± Standard errors
Saeki et al. BMC Plant Biology (2016) 16:45
Page 4 of 15
hybrid than in the parental lines (Table 1), indicating the
palisade cells are larger in the F1 hybrid than in the parents.
In the germinating seedlings the cotyledons of the F1
hybrids remained larger than the cotyledons of the parents over the period 2–6 DAS (Table 2). The cotyledons
begin to senescence after this time. The first two leaves
of the F1 hybrid at 14 DAS were larger and wider than
those of the larger parent, S27 (Table 2). The cotyledons
and leaves of the F1 hybrids had cell sizes equal to the
R29 parent, which has larger cells than the S27 parent
(Table 3). The distribution of ploidy levels in the cells of
the cotyledons and leaves in parents and the F1 hybrid
showed no difference in the cotyledons at 6 DAS and 1st
and 2nd leaves at 14 DAS (Additional file 1: Fig. S2). In
seedling development the F1 hybrid had a greater fresh
weight at 7 and 14 DAS than the larger parent (Table 2).
Heterosis was not evident in the root system at either 7
or 14 DAS (data not shown).
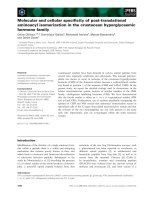
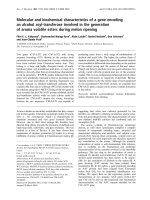
In field conditions the F1 hybrid showed more than 20 %
greater total biomass and harvested biomass (in which the
outer leaves were stripped for marketing) than the larger
parent (Fig. 1a, b). The height, width, and circumference
of the harvested F1 plants were all greater than the corresponding dimensions of the parental plants (Fig. 1c).
Hormone profiles were similar in parental lines and the
F1 hybrid
As hormone signaling has been suggested to be important
in heterotic hybrids of A. thaliana [19], we examined endogenous hormone contents in the parents and F1 hybrid.
We measured the levels of auxins, cytokinins, ABA, gibberellins, jasmonates, and salicylic acid in 2 day cotyledons
and 10 day 1st and 2nd leaves. 20 of the 43 hormone
derivatives assayed were not detected in any lines
(Additional file 2: Table S2). GA8 was not detected in
F1 hybrid, tZ was not detected in S27 and R29, and
IAPhe was not detected in R29 and the F1 hybrid. 10,
5, and 7 molecular types showed significantly different
contents between S27 and R29, between S27 and F1
hybrid, and between R29 and F1 hybrid (p < 0.05).
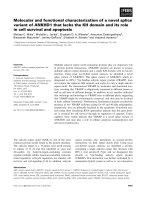
GA8, GA12, GA20, and GA53 accumulated to higher levels
in R29 than in S27 and F1 hybrid (Fig. 2, Additional file 2:
Table S2). SA had higher levels in the F1 hybrid than
in the parents.
In the 10 day 1st and 2nd leaves, 15 of the 43 hormone
types were not detected in any lines (Additional file 2:
Table S2). As was the case in 2 day cotyledons, plant
hormone accumulation did not show over or under
dominance in the F1 hybrid except for iPRPs and
GA20 (Additional file 2: Table S2). These results indicate that the accumulation of plant hormones in the
F1 hybrid was within the range of the parental levels
at both 2 and 10 DAS.
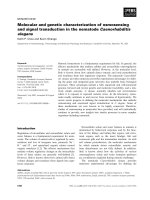
Expression level of organ size-associated genes
The increased cotyledon and leaf area in F1 hybrids suggested that organ size-associated genes contribute to the
heterosis phenotype as has been reported in maize and
Larix [20, 21]. We examined the expression level of four
genes, ARGOS, ANT, EBP1, and CYCD3;1, which are involved in development of organ size [22], from 2 to 6
DAS and compared the expression levels between the F1
hybrid and each parent or between the F1 hybrid and
MPV. The expression level of ANT was low, and the
Table 2 Area and size of cotyledon and true leaf and fresh weight in S27, R29, and F1
S27 (female)
R29 (male)
F1-S27 × R29
Relative to MPV
Relative to BPV
13.04 ± 0.68b (n = 24)
1.16
1.12
68.82 ± 3.00b (n = 33)
1.29
1.28
Cotyledon area (mm2)
2 DAS
4 DAS
6 DAS
10.77 ± 0.59a (n = 19)
a
52.87 ± 2.46 (n = 42)
a
80.14 ± 3.51 (n = 37)
11.69 ± 0.48ab (n = 20)
a
53.59 ± 2.14 (n = 36)
a
b
77.13 ± 2.75 (n = 38)
100.52 ± 4.69 (n = 36)
1.28
1.25
84.51 ± 2.03a (n = 36)
119.26 ± 5.25b (n = 30)
1.39
1.36
158.40 ± 6.57b (n = 36)
1.24
1.10
1st and 2nd leaf area (mm2)
10 DAS
12 DAS
14 DAS
87.62 ± 5.57a (n = 26)
b
143.51 ± 5.59 (n = 30)
b
a
111.01 ± 2.86 (n = 36)
a
c
146.48 ± 5.02 (n = 36)
114.62 ± 4.62 (n = 34)
179.13 ± 6.96 (n = 36)
1.37
1.22
1.50 ± 0.03a (n = 36)
1.45 ± 0.03a (n = 36)
1.74 ± 0.04b (n = 36)
Leaf size at 14 DAS
Length (cm)
Width (cm)
1.18
1.16
0.94 ± 0.02 (n = 36)
0.86 ± 0.02 (n = 36)
1.13 ± 0.03b (n = 36)
1.26
1.20
79.04 ± 1.88a (n = 25)
77.51 ± 1.88a (n = 37)
90.22 ± 2.32b (n = 41)
1.15
1.14
1.22
1.07
a
a
Fresh weight (mg)
7 DAS
14 DAS
b
239.86 ± 5.83 (n = 42)
a
182.75 ± 4.24 (n = 44)
Letters indicate significant differences at p < 0.05 (Student’s t-test)
MPV mid-parent value, BPV best-parent value
Mean ± Standard errors
c
257.63 ± 5.24 (n = 43)
Saeki et al. BMC Plant Biology (2016) 16:45
Page 5 of 15
Table 3 Cell number per unit area in the first layer of palisade mesophyll cells of cotyledon and true leaf
S27 (female)
R29 (male)
F1-S27 × R29
Cotyledon at 2 DAS
2130.82 ± 81.54a (n = 17)
1991.53 ± 52.32a (n = 17)
1930.67 ± 55.06a (n = 18)
Cotyledon at 4 DAS
152.12 ± 4.21c (n = 17)
128.20 ± 5.75b (n = 20)
111.63 ± 4.04a (n = 19)
Cell number per unit area (400x400 μm2)
b
111.16 ± 4.67 (n = 19)
86.35 ± 2.64 (n = 20)
86.85 ± 3.15a (n = 20)
1st and 2nd leaves at 10 DAS
186.59 ± 6.75b (n = 17)
109.82 ± 3.83a (n = 17)
121.81 ± 4.92a (n = 16)
1st and 2nd leaves at 12 DAS
119.61 ± 2.67b (n = 18)
75.78 ± 2.39a (n = 23)
82.06 ± 3.49a (n = 17)
Cotyledon at 6 DAS
a
Cell number per unit area (200x200 μm2)
b
1st and 2nd leaves at 14 DAS
a
81.32 ± 3.80 (n = 19)
62.17 ± 4.02a (n = 18)
66.74 ± 2.25 (n = 19)
Letters indicate significant differences at p < 0.05 (Student’s t-test)
Mean ± Standard errors
in the F1 hybrids and parents, but were higher in the F1
hybrid than in parental lines (Fig. 3c, d, Table 4); 6 of the 8
genes, ATPD, CHL27, CHLM, LHCA2, PORC, PsbP, were
significantly upregulated in the F1 hybrids relative to the
MPV. At 3 DAS the expression of these chloroplasttargeted genes was increased in both F1 hybrids and
parental lines, and only LHCA2 had higher expression in
the F1 hybrids than in the parental lines (Fig. 3c, d,
Table 4). At 4 DAS there was a decrease in expression
level of all eight genes in both F1 hybrids and parental
lines, and the expression levels were similar in all lines
(Fig. 3c, d, Table 4). At 5 and 6 DAS there was similar expression to the 4 DAS expression levels with no difference
expression levels of ARGOS, CYCD3;1, and EBP1 gradually
decreased over time (Fig. 3a, b, Table 4). At 2 or 3 DAS,
the expression levels of ARGOS, CYCD3;1, and EBP1 in
S27 were higher than those in R29 and F1 hybrids
(Fig. 3a, b, Table 4), suggesting these loci do not contribute significantly to the heterosis of the F1 hybrid.
Chloroplast-targeted genes have increased expression
levels in early developmental stages
We measured the expression level of eight genes involved
in chlorophyll biosynthesis or in the photosynthesis
process with products active in the chloroplast or plastid.
At 2 DAS the expression levels of all eight genes were low
a
b
F1
(S27xR29)
S27
R29
c
32
18
28
a
a
26
24
10
8
6
4
22
R29
F1
MPV
52
50
a
a
S27
R29
48
46
42
0
S27
54
44
2
20
b
56
a
12
a
Widht (cm)
Height (cm)
14
Circumference (cm)
30
58
b
16
b
S27
R29
F1
MPV
F1
MPV
Fig. 1 Harvested and total biomass of F1 hybrid and parents in Chinese cabbage. a Harvested biomass. The scale bar is 10 cm. b Fresh weight of
total biomass in S27 (n = 23), R29 (n = 30), and F1 hybrid (n = 30). c Height, width, and circumference of harvested S27 (n = 15), R29 (n = 15), and
F1 hybrid (n = 15). Letters above the bars indicate significant differences at p < 0.05 (Students t-test). MPV, mid parent value
Saeki et al. BMC Plant Biology (2016) 16:45
Page 6 of 15
10 day 1st and 2nd leaves
2 day cotyledon
R29
S27
tZRPs
tZRPs
iPRPs
iPRPs
GA12
GA20
iPR
cZROG
iP7G
GA24
GA20
GA19
GA53
cZ
tZR
tZ7G
GA24
tZ
SA
GA12
iP
GA4
GA4
cZRPs
tZ7G
IAIle+IALeu
cZR
ABA
cZRPs
GA53
IAIle+IALeu
cZR
GA19
iP
IAAla
iP7G
JA
iP9G
ABA
SA
IAPhe
F1
1.00
0.00
-1.00
iPR
JA
R29
S27
F1
Fig. 2 Hierarchical average linkage clustering of plant hormone contents. Hormone contents higher or lower than the median are shown
in yellow and blue, respectively
between the F1 hybrids and MPV except for PORB at 6
DAS (Fig. 3c, d, Table 4).
We examined the chlorophyll content per gram fresh
weight at 6 DAS. The chlorophyll content of the F1 hybrid (0.136 ± 0.005 μg/mg) is similar to that of R29
(0.127 ± 0.010 μg/mg) but greater than that of S27
(0.094 ± 0.009 μg/mg). When the larger leaves are considered the total chlorophyll content of the F1 hybrid is
greater than that of parents because of the increased size
and number of cells resulting in an increased leaf area
and fresh weight in the F1 hybrid.
Transcriptome analysis of 2 DAS cotyledons
As the expression levels of chloroplast-targeted genes
tended to be higher in the F1 hybrids than MPV at 2
DAS (Table 4), we performed a transcriptome analysis
in the parental lines (S27 and R29) and the F1 hybrid.
To verify the RNA-seq analysis, we compared the
relative ratio of expression levels between the F1 hybrid and MPV calculated by qPCR and RNA-seq data
in the organ size-associated and chloroplast-targeted
genes (Table 4, Additional file 2: Table S3). A high
correlation (r = 0.95) was observed between the two
analyses (Fig. 4a).
Less than 1 % of the genes showed a two-fold difference
(log2 ratio > = 1.0) in expression with 95 % confidence between parental lines (204 of 41,174 genes) or between the
F1 hybrid and each parental line (F1 vs. S27; 157 genes, F1
vs. R29; 206 genes) (Fig. 4b, Additional file 2: Tables S4-6).
Between F1 hybrid and MPV (see Methods) 195 (0.5 %)
genes showed a two-fold difference (log2 ratio > = 1.0) in
expression with 95 % confidence, and 13 of these 195
genes were differential expressed in the parental lines
(Fig. 4b, Additional file 2: Table S7).
We performed a Gene Ontology (GO) analysis of genes
differentially expressed in the parental lines (S27 vs. R29),
Saeki et al. BMC Plant Biology (2016) 16:45
140
120
100
80
60
40
600
500
400
300
200
20
100
0
0
R29
S27
F1
CYCD3;1
R29
Relative ratio of expression level (vs. MPV)
1.2
4
1.1
1
0.9
0.8
0.7
.
0.6
0.5
R29
F1
60
40
20
2000
1500
1000
500
0
S27
R29
S27
F1
CHLM
1.2
1.1
1
0.9
0.8
0.7
R29
F1
F1
3
1.3
1.2
1.1
1
0.9
0.8
0.7
S27
R29
LHCA2
1.4
0.6
S27
80
d
EBP1
1.3
2500
100
F1
1.3
1.4
120
0
Relative ratio of expression level (vs. MPV)
b
Relative ratio of expression level (vs. MPV)
700
3000
Expression level (vs. Bractin)
800
160
LHCA2
140
Relative ratio of expression level (vs. MPV)
180
CHLM
Expression level (vs. Bractin)
900
S27
c
EBP1
CYCD3;1
200
Expression level (vs. Bractin)
Expression level (vs. Bractin)
a
Page 7 of 15
2.5
2
1.5
1
0.5
S27
R29
F1
S27
R29
F1
Fig. 3 Expression level of genes involved in organ size (a, b) and chloroplast-targeted genes (c, d) in S27, R29, and F1 hybrid from 2 to 6 DAS. (a, c)
The expression level compared with that of Bractin. (b, d) The relative expression level compared with MPV. Data is shown in Table 4
between the F1 hybrid and each parental line (F1 vs. S27,
F1 vs. R29), and between the F1 hybrid and the MPV
(Table 5, Additional file 2: Tables S8-S11). In the upregulated genes in the F1 hybrid compared with S27, R29, or
MPV, GO categories of ‘Photosynthesis’ and ‘Chloroplast
part’ were overrepresented. In the downregulated genes in
the F1 hybrid, the GO categories of ‘Response to heat’,
‘Response to high light intensity’, and ‘Response to
temperature stimulus’ were over-represented (Table 5,
Additional file 2: Tables S8-S11).
Overall, chloroplast-targeted genes, especially those
having a function in photosynthesis, such as Light
harvesting chlorophyll a/b-binding protein (LHCB),
Photosystem I subunit (PSA), and NDH-dependent
Cyclic Electron Flow (NDF) had a higher expression
level in the F1 hybrid than in the parental lines and
genes involved in the category of ‘response to heat’,
‘response to temperature stimulus’, and ‘response to
high light intensity’ such as Heat shock protein (HSP)
and Heat stress transcription factor (HSF) had a
lower expression level in the F1 hybrid than in
parental lines (Additional file 1: Fig. S3, Table 5,
Additional file 2: Tables S5-S7, S9-S11).
Identification of allele specific expressed genes in the F1
hybrid
The parental alleles expressed in the F1 hybrid were identified through a SNP analysis. The two allelic expression
levels in each gene in the F1 hybrid (AEL) were compared
to the relative expression levels (REL) in the two parents.
436 (3.5 %) of 12,321 (excluding 449 non-expressed genes
in S27 and/or R29) genes showed a difference between
AEL and REL (p < 0.01) (Fig. 5, Additional file 1: Fig. S4).
Genes that were either differentially expressed between
the parents (11.9 %) or showed differential expression
relative to the MPV (15.8 %) were overrepresented (Fig. 5,
Additional file 1: Fig. S5).
We identified allele-specific expressed genes in the F1
hybrid. We classified genes as allele-specific expressed
if they satisfied the following criterion: five fold difference of SNP numbers per site between S27 and R29
alleles (p < 0.05) or p < 0.001 if only one-parental SNP
Saeki et al. BMC Plant Biology (2016) 16:45
Page 8 of 15
Table 4 Expression level of genes involved in organ size and chloroplast-targeted genes detected by quantitative RT-PCR at different
times after sowing
2 DAS
S27 (female)
R29 (male)
F1-S27 × R29
ANT
0.05 ± 0.013b (1.60)
0.02 ± 0.002a (0.55)
0.03 ± 0.007ab (1.11)
CYCD3;1
169.99 ± 15.920b (1.29)
92.64 ± 18.702a (0.71)
118.23 ± 19.826ab (0.90)
Genes involved in organ size
b
ab
478.61 ± 75.656a (0.75)
EBP1
791.80 ± 63.295 (1.24)
480.63 ± 117.658
ARGOS
38.14 ± 3.839b (1.52)
12.16 ± 0.804a (0.48)
18.60 ± 3.388a (0.74)
7.27 ± 0.723a (1.00)
7.43 ± 0.849a (1.00)
9.57 ± 0.116b (1.31*)
(0.76)
Chloroplast-targeted genes
CHLM
ab
CHL27
4.76 ± 0.368
(1.16)
3.47 ± 0.301 (0.84)
5.94 ± 0.668b (1.44*)
PORB
18.44 ± 2.558b (1.46)
6.74 ± 1.238a (0.54)
20.63 ± 2.589b (1.64)
b
a
LHCA2
18.40 ± 0.671 (1.41)
7.63 ± 0.691 (0.59)
37.94 ± 5.624c (2.91**)
PORC
1.22 ± 0.085a (0.88)
1.54 ± 0.249ab (1.12)
2.11 ± 0.107b (1.53**)
a
a
PsbS
0.01 ± 0.001 (0.86)
0.01 ± 0.005 (1.14)
0.02 ± 0.008a (2.21)
ATPD
17.06 ± 3.687a (0.95)
18.89 ± 3.689a (1.05)
39.26 ± 8.350b (2.18*)
37.57 ± 6.258 (0.82)
96.10 ± 4.271b (2.09**)
S27 (female)
R29 (male)
F1-S27 × R29
ANT
0.11 ± 0.035a (1.47)
0.04 ± 0.009a (0.53)
0.05 ± 0.024a (0.72)
CYCD3;1
60.47 ± 4.589b (1.29)
33.15 ± 5.176a (0.71)
27.29 ± 4.522a (0.58)
PsbP
a
a
54.56 ± 3.150 (1.18)
a
3 DAS
Genes involved in organ size
b
a
EBP1
231.00 ± 20.657 (1.26)
134.80 ± 20.743 (0.74)
117.18 ± 17.538a (0.64)
ARGOS
11.76 ± 0.966b (1.14)
8.86 ± 1.563ab (0.86)
5.27 ± 0.442a (0.51*)
109.15 ± 7.716a (1.12)
85.37 ± 9.127a (0.88)
108.53 ± 9.602a (1.12)
Chloroplast-targeted genes
CHLM
a
CHL27
273.81 ± 5.100 (0.72)
484.32 ± 146.105 (1.28)
223.76 ± 23.998a (0.59)
PORB
879.58 ± 53.892b (1.32)
456.81 ± 71.574a (0.52)
509.17 ± 72.665a (0.76)
a
a
ab
LHCA2
895.36 ± 89.621 (0.68)
1729.73 ± 188.985
PORC
34.55 ± 0.321a (0.89)
43.16 ± 4.084a (1.11)
41.58 ± 5.773a (1.07)
0.29 ± 0.011 (0.90)
0.36 ± 0.041 (1.10)
0.35 ± 0.046a (1.06)
ATPD
1019.51 ± 74.779a (1.03)
955.55 ± 121.680a (0.97)
814.55 ± 216.658a (0.82)
a
3939.02 ± 403.225 (0.94)
a
2354.13 ± 398.359b (1.79*)
PsbS
PsbP
a
(1.32)
a
4445.87 ± 611.073 (1.06)
6319.69 ± 1259.573a (1.51)
R29 (male)
F1-S27 × R29
4 DAS
S27 (female)
Genes involved in organ size
ANT
CYCD3;1
0.03 ± 0.007a (1.31)
a
12.91 ± 2.030 (1.08)
a
0.02 ± 0.001a (0.69)
a
10.96 ± 2.726 (0.92)
a
0.03 ± 0.006a (1.14)
10.80 ± 1.860a (0.90)
EBP1
95.48 ± 13.552 (1.05)
85.76 ± 20.561 (0.95)
84.79 ± 13.540a (0.92)
ARGOS
0.93 ± 0.183a (1.23)
0.58 ± 0.126a (0.77)
0.65 ± 0.122a (0.83)
1.97 ± 0.208a (0.76)
3.24 ± 0.913a (1.24)
2.83 ± 0.659a (1.09)
Chloroplast-targeted genes
CHLM
CHL27
2.79 ± 0.531 (0.47)
9.15 ± 3.558 (1.53)
3.17 ± 0.59a (0.53)
PORB
18.43 ± 0.372a (0.96)
20.05 ± 0.210a (1.04)
18.31 ± 0.276a (0.95)
LHCA2
a
a
428.10 ± 155.529 (0.96)
a
a
449.70 ± 131.546 (1.02)
574.12 ± 318.830a (1.31)
Saeki et al. BMC Plant Biology (2016) 16:45
Page 9 of 15
Table 4 Expression level of genes involved in organ size and chloroplast-targeted genes detected by quantitative RT-PCR at different
times after sowing (Continued)
PORC
7.60 ± 4.034a (0.87)
9.77 ± 2.704a (1.13)
11.92 ± 5.452a (1.37)
PsbS
0.03 ± 0.017a (1.26)
0.02 ± 0.006a (0.74)
0.01 ± 0.003a (0.56)
b
b
ATPD
122.09 ± 5.773 (0.86)
163.22 ± 13.719 (1.14)
91.23 ± 9.503a (0.64*)
PsbP
718.75 ± 75.843a (1.03)
682.77 ± 44.241a (0.97)
612.86 ± 49.441a (0.87)
S27 (female)
R29 (male)
F1-S27 × R29
0.03 ± 0.004b (1.23)
0.02 ± 0.002a (0.82)b
5 DAS
Genes involved in organ size
ANT
b
0.02 ± 0.002a (0.62*)
CYCD3;1
6.82 ± 0.801 (1.21)
4.49 ± 0.470 (0.79)
4.70 ± 0.671a (0.83)
EBP1
33.02 ± 3.196a (1.14)
24.89 ± 4.347a (0.86)
27.02 ± 3.787a (0.93)
0.46 ± 0.088 (1.37)
0.21 ± 0.038 (0.63)
0.22 ± 0.021a (0.66)
CHLM
2.20 ± 0.289a (1.14)
1.67 ± 0.309a (0.86)
1.79 ± 0.319a (0.93)
CHL27
1.96 ± 0.168a (1.13)
1.52 ± 0.389a (0.87)
1.52 ± 0.340a (0.88)
ARGOS
a
a
a
Chloroplast-targeted genes
a
PORB
2.23 ± 0.169 (0.97)
2.39 ± 0.340 (1.03)
2.24 ± 0.313a (0.97)
LHCA2
39.10 ± 5.653a (1.08)
33.21 ± 5.320a (0.92)
36.19 ± 5.032a (1.00)
a
a
PORC
0.61 ± 0.078 (0.77)
0.97 ± 0.245 (1.23)
0.86 ± 0.165a (1.09)
PsbS
0.00 ± 0.002a (1.26)
0.00 ± 0.000a (0.74)
0.00 ± 0.000a (0.74)
a
a
a
ATPD
21.62 ± 0.925 (1.05)
19.51 ± 1.521 (0.95)
21.96 ± 2.212a (1.07)
PsbP
153.34 ± 8.824a (1.11)
122.08 ± 4.314a (0.89)
171.79 ± 23.599a (1.25)
S27 (female)
R29 (male)
F1-S27 × R29
0.01 ± 0.006a (0.77)
0.01 ± 0.010a (1.23)
6 DAS
Genes involved in organ size
ANT
a
0.00 ± 0.001a (0.28)
CYCD3;1
2.10 ± 0.388 (0.82)
3.02 ± 0.392 (1.18)
2.57 ± 0.787a (1.23)
EBP1
19.52 ± 3.345a (0.77)
31.08 ± 4.424a (1.23)
27.88 ± 8.320a (1.10)
0.25 ± 0.067 (1.07)
0.21 ± 0.026 (0.93)
0.23 ± 0.035a (1.01)
CHLM
4.15 ± 0.187a (1.12)
3.24 ± 0.504a (0.88)
3.68 ± 0.536a (1.00)
CHL27
5.28 ± 0.742a (1.13)
4.06 ± 0.369a (0.87)
4.10 ± 0.257a (0.88)
ARGOS
a
a
a
Chloroplast-targeted genes
ab
PORB
1.91 ± 0.060
LHCA2
39.94 ± 2.660a (1.06)
(1.15)
a
a
1.41 ± 0.073 (0.85)
3.37 ± 0.768b (2.03**)
35.17 ± 3.957a (0.94)
44.60 ± 1.578a (1.19)
PORC
1.14 ± 0.324 (0.68)
2.20 ± 0.525 (1.32)
1.26 ± 0.331a (0.76)
PsbS
0.01 ± 0.001a (0.67)
0.01 ± 0.007a (1.33)
0.01 ± 0.002a (0.62)
a
a
a
ATPD
38.36 ± 7.410 (0.93)
44.09 ± 9.913 (1.07)
41.11 ± 15.227a (1.00)
PsbP
192.31 ± 32.822a (1.19)
131.54 ± 7.282a (0.81)
216.30 ± 21.144a (1.34)
Letters indicate significant differences at p < 0.05 (Student’s t-test)
The relative ratio of expression level compared with MPV (mid parent values) is shown in parentheses
*,p < 0.05 (F1 vs. MPV); **,p < 0.01 (F1 vs. MPV)
Mean ± Standard errors
was detected. We found 162 (41; only S27 alleles, 121;
S27 > R29) S27 allele specific and 194 (39; only R29
alleles, 155; R29 > S27) R29 allele specific genes (Additional
file 1: Fig. S6, Additional file 2: Table S12). 145 (40.7 %) of
356 allele-specific expressed genes showed a difference
between AEL and REL (Fig. 5).
We performed a GO analysis of these allele specific
genes. In the S27 allele specific expressed genes, GO
categories of ‘Cytoplasm’, ‘Chloroplast’, ‘Ribosome’,
and ‘Translation’ showed significant enrichment (Additional
file 2: Table S13). In the R29 allele specific expressed genes,
GO categories of ‘Cytoplasm’, ‘Ribosome’, ‘Response to
Saeki et al. BMC Plant Biology (2016) 16:45
Page 10 of 15
Relative expression level (F1 / MPV)
(RNA-seq)
a
4.0
LHCA2
3.5
3.0
PsbP
2.5
PORC
CHLM
PsbS
2.0
ATPD
CHL27
1.5
PORB
R² = 0.90
1.0
EBP1
0.5
ANT
CYCD3;1
ARGOS
0.0
0.0
0.5
1.0
1.5
2.0
2.5
3.0
Relative expression level (F1 / MPV) (qPCR)
b
3.5
S27 vs. R29
S27 vs. R29
60
68
75
1
51
S27 vs. F1
37
191
F1 vs. MPV
4
105
F1 > MPV
9
77
F1 < MPV
93
R29 vs. F1
Fig. 4 Verification of RNA-seq data by quantitative RT-PCR (a). Venn diagram representing the number of differentially expressed genes at
2 DAS (b). Filled circles and triangles in the scatter diagram show the organ size and chloroplast-targeted genes, respectively. MPV, mid parent value
water’, and ‘Translation’ showed significant enrichment
(Additional file 2: Table S13). Genes categorized into
both ‘Translation’ and ‘Ribosome’ tended to show both
S27 and R29-allele specific expression in the F1 hybrid
(Additional file 1: Fig. S7).
recover chlorophyll biosynthesis after removal of norflurazon as reported [24]. These experiments show that
photosynthesis at the cotyledon stage is critical for
heterosis in the F1 hybrid.
Discussion
Shutdown of chlorophyll biosynthesis in the cotyledon
decreased heterosis
Heterosis is observed in mature seeds, post-germination
seedlings, and mature plants
Chloroplast-targeted genes were upregulated in the F1
hybrid at 2 DAS, especially those having a function in
photosynthesis. To examine the relationship between
photosynthesis and increased cotyledon/leaf area at an
early developmental stage, young seedlings were treated
with norflurazon, an inhibitor of phytoene desaturase, at
two different stages [23]. Seeds were grown on MS medium
for one week, and transferred to MS medium with 1.0 μM
norflurazon and grown a further two weeks. The treated
seedlings did not produce chlorophyll and had white 1st
and 2nd leaves (Additional file 1: Fig. S8). The 1st and 2nd
leaves of the F1 hybrids were larger than those of parental
lines after two weeks on the norflurazon medium (Table 6,
Additional file 1: Fig. S8). Seeds grown on MS medium
with 1.0 μM norflurazon for one week and transferred to
MS medium without norflurazon did not show any heterosis (Table 6, Additional file 1: Fig. S8), though plants did
The pattern of development showing different aspects of
heterosis in Chinese cabbage is similar to that described
for A. thaliana, another member of the Brassica family
[9–11, 25–27]. We showed that the mature seed of the
F1 hybrid is larger than the seeds of either of the parents,
and the area of the embryo is greater in the F1 hybrid
than in the parents. Large embryo sizes and increased
post germination seedling sizes have been reported in A.
thaliana and maize F1 hybrids [9–11, 26, 28, 29], suggesting that the seed heterosis in B. rapa is likely to be
an innate characteristic of the F1 hybrid rather than a
result of the sodium chloride treatment in parents used
to overcome the self-incompatibility (see Methods).
In A. thaliana, the larger size of the cotyledon and leaves
of F1 hybrids are associated with increased size and number
of the photosynthetic palisade mesophyll cells. At maturity,
the C24 x Col hybrid has approximately 25 %–30 % greater
Saeki et al. BMC Plant Biology (2016) 16:45
Page 11 of 15
Table 5 Top 3 of overrepresented GO terms in Biological process in differentially expressed genes among S27, R29, F1, and MPV
Expression levels in vertical on the left lines are higher than that in right of the horizontal lines
***,P < 0.001; **,P < 0.01
biomass than either of the parents [9, 10]. In “W39”, the
R29 male parent has larger photosynthetic cells than the
S27 female parent, which has an increased cell number
relative to R29, and the F1 hybrid combines both these
properties. Difference in cell number or size did not result
in difference in the organ size between parental lines, but
the increased cell number and size in the F1 hybrid resulted
in an increased organ size and was associated with an
increased photosynthetic capacity. Heterotic F1 hybrids of
A. thaliana also showed both increased cell number and
size [9–11], suggesting that the occurrence of both events
is important for increased organ size in heterotic F1 hybrids.
Saeki et al. BMC Plant Biology (2016) 16:45
***
100%
90%
80%
70%
60%
50%
40%
30%
20%
10%
0%
Page 12 of 15
***
***
Total
DE
NA
AS
SNP vs. RNA-seq
Difference
No-Difference
Fig. 5 Bar graph of the percentage of the genes showing different
allelic expression ratios to their parental expression levels (between
AEL (SNP) and REL (RNA-seq)) (p < 0.01). Total, all expressed genes
(except for non-expressed genes in S27 and/or R29); DE, differentially
expressed genes between parental lines; NA, non-additively expressed
genes between F1 hybrid and mid parent value; AS, allele-specific
expressed genes in F1 hybrid satisfying the following criterion,
five fold difference of SNP numbers per site between parental alleles
(p < 0.05) or p < 0.001 if only one-parent SNP was detected.
***,p < 0.0001
We checked whether the increased cell size could be attributed to endopolyploidy and found that there was no difference in the distribution of cell ploidies in the F1 hybrids
and parents. Since it is known that increased cell size or
number in the leaves of plants is correlated with increased
chloroplast number and chlorophyll content, it is likely that
the overall amount of photosynthesis in the hybrid plant is
greater than in either of the parents [9, 30]. As the leaves of
the hybrid “W39” are greater in total area than the parents
and the chlorophyll content per fresh weight in “W39” was
similar to that of best parent, an increased production of
photosynthate could be expected.
Plant hormones play important roles in regulating plant
growth and development. We measure the hormone levels
in 2 day cotyledons and 10 day leaves, before or just after
the appearance of the increased leaf area. Most of the
hormone concentrations in the F1 hybrid were within the
parental range. As sensitivity to hormone signalling is important for the heterosis phenotype in A. thaliana [19],
sensitivity rather than concentrations of hormones may be
important for the heterosis phenotype.
Tissue, organ or stage-specific heterosis has been observed in a number of plants and these all result in
increased yield [31, 32]. Heterosis in the “W39” F1 hybrid
of Chinese cabbage results in a greater harvestable biomass
than in the parents. It is possible that changes in the leaf
cells in some of the earliest stages of the germinating seedling may lead to the continuing increase in size of leaves in
the F1 hybrid with genetic factors responsible for increased
cell number and size. This property could be of fundamental importance in generating the increased biomass of the
F1 hybrid. Further study will be required to determine
whether increased cotyledon or leaf size is a general predictor of high yield heterosis in B. rapa F1 hybrids.
Chloroplast-targeted genes were upregulated in F1
hybrids at two days after sowing
There are reports which claim to identify heterosis related
genes such as a flowering time gene in tomato, circadian
rhythm genes in A. thaliana, and organ size genes in
maize and Larix [20, 21, 33, 34]. We examined four genes
whose orthologs in A. thaliana were involved in leaf size
control. In S27, which has more cells than R29 and F1 hybrids, the expression level of the three genes, CYCD3;1,
EBP1, and ARGOS, was higher than that in R29 and F1
hybrid at 2–3 DAS, and these three genes are similarly
expressed in the F1 hybrid and R29. Though increased cell
number in S27 is related to the increased expression levels
of these three genes, the increased cotyledon size in the F1
hybrid, being partly dependent on increased cell number,
is less dependent on the pathway involving these genes.
Upregulation of chloroplast-targeted genes occurs in the
Arabidopsis C24 x Col hybrid, the heterotic intra-specific
hybrids of rice, and the heterotic inter-specific hybrids of
A. thaliana and related species [9, 33, 35, 36]. Eight of the
upregulated chloroplast-targeted genes reported in the
Arabidopsis C24 x Col hybrid were upregulated in “W39”
at 2 DAS. The 2 DAS transcriptome analysis identified
genes involved in the categories of ‘Photosynthesis’ and
‘Chloroplast part’ as upregulated in the F1 hybrid compared to the parental lines. This transient increase in gene
expression of the photosynthesis related genes on day 2
may be a prerequisite to the continuing increases in both
cell size and number of photosynthetic cells, processes
Table 6 Leaf area after norflurazon treatment
R29 (male)
S27 (female)
F1-S27 × R29
Relative to MPV
Relative to BPV
A. Leaf area in 1st and 2nd leaves after three weeks sowing
1.00a
1.19 ± 0.15a
2.74 ± 0.33b
2.54
2.29
B. Leaf area in 3rd and 4th leaves after four weeks sowing
1.00a
1.92 ± 0.17b
1.50 ± 0.18ab
0.93
0.78
Relative ratio in leaf area compared with R29
A. Seeds were sown on MS medium and grown for one week. The seedlings were transferred to MS medium with 1.0 μM norflurazon and grown for a further
two weeks
B. Seeds were grown on MS medium with 1.0 μM norflurazon for one week, then transferred to MS medium for three weeks
Letters (a and b) indicate significant differences at p < 0.05 (Student’s t-test)
MPV mid-parent values, BPH best-parent values
Mean ± Standard errors
Saeki et al. BMC Plant Biology (2016) 16:45
initiated in the cotyledon in the final growth stages of the
seed. A dependence on photosynthesis in the cotyledon
stage for subsequent heterosis in germinating seedlings
was suggested by the results of the norflurazon treatment
on young seedlings. Plants could grow during the oneweek norflurazon treatments of seeds because sucrose was
provided by the medium. However equalizing the source
by blocking photosynthesis eliminates the heterosis
phenotype even when plants are grown on MS medium
for 2 weeks after norflurazon treatment. This suggests that
an increased production of photosynthesis in the first
week of cotyledon growth is important for increased leaf
size in F1 hybrids even after the cotyledon stage. The transient increase in gene expression of the photosynthesis
related genes in the cotyledon may be required for the
heterosis seen after the cotyledon stage.
Genes involved in stress were downregulated in F1
hybrids at two days after sowing
In C24 x Col hybrids in A. thaliana, genes in the stress response category were overrepresented in both up- and
downregulated genes in the F1 hybrid relative to the MPV
at both cotyledon and seedling stages [9]. Differential
expression of stress responsive genes between inter- or
intra-specific hybrids and their parental lines has been
widely observed in plants [9–11, 36, 37]. In this study, we
found downregulation of genes involved in the categories
of ‘Response to heat’, ‘Response to temperature stimulus’,
and ‘Response to high light intensity’ such as HSP genes in
the F1 hybrid relative to parental lines. It is not clear
whether this implies that the F1 hybrid may be less
responsive to environmental effects or it is only obvious in
unchallenged conditions. Downregulation of HSP genes
was also observed in heterotic inter-specific hybrids
between A. thaliana and A. arenosa, and the authors
suggested this is due to buffering effects [37], which may
be involved in the vigour phenotype.
Allele-specific expressed genes
RNA-seq enables us to distinguish the parental alleles of
transcripts in F1 hybrids at the whole genome level. In this
study, we compared the AEL and REL in all expressed
genes, genes differentially expressed between parental
lines, or genes non-additively expressed between F1 hybrid
and MPV. Fewer than 16 % of genes showed a significant
difference between AEL and REL, suggesting that differences in the expression levels between parental lines is
maintained in the allelic bias of transcripts in F1 hybrids.
Of the AEL genes, about 45.7 % of genes had more transcripts derived from S27 alleles than that from R29 alleles,
indicating that there is no preference for the expression
alleles from one parent in the F1 transcripts.
We identified 365 genes as being allele-specific expressed,
and the GO categories of ‘Translation’ and ‘Ribosome’ were
Page 13 of 15
over-represented in both S27- and R29-allele specific
expressed genes. Mutations in ribosomal protein genes
in A. thaliana cause various types of developmental defects including in leaf development and cell proliferation [38, 39]. Single recessive mutants of the ribosomal
protein genes, api2/rpl36ab or rpl36aa, showed a
pointed-leaf phenotype, and these two genes with identical amino acid sequences are located on different
chromosomes. The hybrid between apl2 and rpl36aa
(API2/api2; RPL36aA/apl36aa) revealed the same
phenotype as each of the single mutants, indicating that
non-allelic non-complementation of ribosomal proteins
combining to produce haploinsufficiency, plays a role
in leaf development [40]. Different combinations of
ribosomal proteins caused by allele-specific expression
of ribosomal proteins observed in this study may be
related to the increased leaf area in F1 hybrid.
Conclusions
The heterosis phenotype first seen in the cotyledons was
observed a few days after sowing. Most genes showed an
additive expression pattern, and any difference of expression levels between parental lines was maintained in the
F1 hybrids. Genes categorized in the GO analysis into
‘Photosynthesis’ and ‘Chloroplast part’ tended to be upregulated in F1 hybrids at 2 DAS. Norflurazon treatment on
germinating seeds leads to a white cotyledon and reduced
heterosis in leaves. Norflurazon treatment on one-week
seedlings, which have green cotyledons, continued to have
heterosis in leaf size. These observations suggest the upregulation of chloroplast-targeted genes in the cotyledon
and photosynthesis at the cotyledon stage are important
for increased leaf area in F1 hybrids, and this increased leaf
area could lead to the increased yield seen at harvest.
Availability of supporting data
All supporting data are included as additional files. The
RNA sequencing data have been deposited with DDBJ
under DRA003125.
Additional files
Additional file 1: Figure S1. Development of S27, R29, and F1 hybrid.
(A) Two day seedlings of S27, R29, and F1 hybrid. The number of true
leaves (B) and fresh weight at 30 DAS (C) in F1 hybrid and parental
lines. Figure S2. Flow cytometry analysis of nuclei from cotyledon at 6
DAS (A) and 1st and 2nd leaves at 14 DAS (B) in S27, R29, and the F1
hybrid. Figure S3. Bar graph of the expression levels of upregulated
(left panel) and downregulated (right panel) genes in F1 hybrid compared
with parental lines. Figure S4. Comparison between relative ratio of SNP
numbers between parental alleles in F1 hybrid (x axis) and relative
expression levels between parental lines (y axis) in the total expressed
genes. Figure S5. Comparison between ratio of SNP numbers in parental
alleles in F1 hybrid (x axis) and relative expression levels in parental
lines (y axis) in the non-additively expressed genes between F1 and
mid parent value (circles) and differentially expressed genes between
parental lines (squares). Figure S6. Scatter diagram of SNP numbers
Saeki et al. BMC Plant Biology (2016) 16:45
of S27 alleles (x axis) and R29 alleles (y axis) in F1 hybrid transcripts. Figure
S7. Parental allelic ratio in allele-specific expressed genes involved in the GO
category of ‘Ribosome’. Figure S8. Phenotypes with norflurazon treatment.
(PPT 11230 kb)
Additional file 2: Table S1. Sequences of primers used for quantitative
RT-PCR. Table S2. Plant hormone contents in 2 day cotyledon and
10 day 1st and 2nd leaves in S27, R29, F1. Table S3. Expression level
of organ size associated and chloroplast-targeted genes by RNA-seq.
Table S4. Differentially expressed genes between S27 and R29 in 2
day cotyledon. Table S5. Differentially expressed genes between S27
and F1 in 2 day cotyledon. Table S6. Differentially expressed genes
between R29 and F1 in 2 day cotyledon. Table S7. Differentially
expressed genes between F1 and MPV (Mid Parent Values) in 2 day
cotyledon. Table S8. GO term overrepresented in differentially expressed
genes between parental lines in 2 day cotyledon. Table S9. GO terms
overrepresented in differentially expressed genes between S27 and F1
in 2 day cotyledon. Table S10. GO terms overrepresented in differentially
expressed genes between R29 and F1 in 2 day cotyledon. Table S11. GO
terms overrepresented in differentially expressed genes between F1 and
MPV (Mid parent values) in 2 day cotyledon. Table S12. Allele-specific
expressed genes in F1 hybrid. Table S13. GO term overrepresented in
allele specific expressed genes in F1 at 2 days after sowing. (XLSX 157 kb)
Abbreviations
AEL: Allelic expression level in the F1 hybrid; ANT: Aintegumenta;
ARGOS: Auxin-regulated gene involved in organ size; ATPD: ATP synthase
delta-subunit gene; CHLM: Magnesium-protoporphyrin IX methyltransferase;
CYCD3: Cyclin D3; DAS: Day after sowing; EBP1: ErbB-3 epidermal growth
factor receptor binding protein 1; GO: Gene ontology; LHCA2: Photosystem I
light harvesting complex 2; MPV: Mid parent value; POR: Protochlorophylide
oxidoreductase; PsbP: Photosystem II subunit P; REL: Relative expression level
in the two parents.
Competing interests
The authors declare that they have no competing interest.
Authors’ contribution
NS carried out the characterization of heterosis phenotype at the early
developmental stages (measurement of leaf and cell size, Flow cytometric
analysis), prepared RNA-seq libraries, and carried out qPCR analysis. TK carried
out the characterization of heterosis phenotype at early developmental stages
(measurement of chlorophyll content, treatment of norflurazon) and did the
GO analysis. MS participated in the measurement and statistical analysis of the
biomass in the field condition and helped qPCR analysis and data analysis
of RNA-seq data. HY carried out the bioinformatics and statistical analysis
of RNA-seq data. JMT carried out the bioinformatics and statistical analysis
of RNA-seq data. MK carried out the measurement of hormone content.
HA helped the measurement of hormone content and carried out the statistical
analysis of data of hormone content. HS participated in the design of the study
and organized the analysis of hormone content. MK organized the field
test and prepared materials. WJP participated in the design of the study
and wrote the paper. ESD participated in the design of the study and
wrote the paper. RF organized the design of the study, helped all molecular
genetic analyses, and wrote the paper. All authors have read and approved the
final version of the paper.
Acknowledgements
We thank Mr. Shuhei Konno, Mr. Hirofumi Abe, and Mr. Hiroya Tomita for
excellent technical assistance and Dr. Hiroshi Fukayama for his expertise in
chlorophyll quantification. This work was supported in part by a grant-in-aid
for Scientific Research on Innovative Areas (24113509) (JSPS), by the Sasakawa
Scientific Research Grant (24–517) from The Japan Science Society, by Grant
for Promotion of Niigata University Research Projects (23C024) and by PREST
(12101066) (JST) to R. Fujimoto.
Author details
1
Graduate School of Science and Technology, Niigata University,
Ikarashi-ninocho, Niigata 950-2181, Japan. 2Graduate School of Agricultural
Science, Kobe University, Rokkodai, Nada-ku, Kobe 657-8501, Japan. 3CSIRO
Agriculture, Canberra ACT 2601, Australia. 4Center for Sustainable Resource
Page 14 of 15
Science, 1-7-22, Suehiro, Tsurumi, Yokohama 230-0045, Japan. 5Experimental
Plant Division, RIKEN BioResource Center, Tsukuba 305-0074, Japan.
6
Watanabe Seed Co., Ltd, Machiyashiki, Misato-cho, Miyagi 987-0003, Japan.
7
University of Technology, Broadway, SydneyPO Box 123, NSW 2007,
Australia. 8Japan Science and Technology Agency (JST), Precursory Research
for Embryonic Science and Technology (PRESTO), Saitama 332-0012, Japan.
Received: 28 August 2015 Accepted: 9 February 2016
References
1. Lippman ZB, Zamir D. Heterosis: revisiting the magic. Trends Genet. 2007;23:60–6.
2. Charlesworth D, Willis JH. The genetics of inbreeding depression.
Nat Rev Genet. 2009;10:783–96.
3. Groszmann M, Greaves IK, Albert N, Fujimoto R, Helliwell CA, Dennis ES,
et al. Epigenetics in plants-vernalisation and hybrid vigour. Biochim Biophys
Acta. 2011;1809:427–37.
4. Groszmann M, Greaves IK, Fujimoto R, Peacock WJ, Dennis ES. The role
of epigenetics in hybrid vigour. Trends Genet. 2013;29:684–90.
5. Baranwal VK, Mikkilineni V, Zehr UB, Tyagi AK, Kapoor S. Heterosis:
emerging ideas about hybrid vigour. J Exp Bot. 2012;63:6309–14.
6. Schnable PS, Springer NM. Progress toward understanding heterosis in
crop plants. Annu Rev Plant Biol. 2013;64:71–88.
7. Chodavarapu RK, Feng S, Ding B, Simon SA, Lopez D, Jia Y, et al. Transcriptome
and methylome interactions in rice hybrids. Proc Natl Acad Sci USA.
2012;109:12040–5.
8. Groszmann M, Greaves IK, Albertyn ZI, Scofield GN, Peacock WJ, Dennis ES.
Changes in 24-nt siRNA levels in Arabidopsis hybrids suggest an epigenetic
contribution to hybrid vigor. Proc Natl Acad Sci USA. 2011;108:2617–22.
9. Fujimoto R, Taylor JM, Shirasawa S, Peacock WJ, Dennis ES. Heterosis of
Arabidopsis hybrids between C24 and Col is associated with increased
photosynthesis capacity. Proc Natl Acad Sci USA. 2012;109:7109–14.
10. Meyer RC, Witucka-Wall H, Becher M, Blacha A, Boudichevskaia A, Dörmann
P, et al. Heterosis manifestation during early Arabidopsis seedling
development is characterized by intermediate gene expression and
enhanced metabolic activity in the hybrids. Plant J. 2012;71:669–83.
11. Groszmann M, Gonzalez-Bayon R, Greaves IK, Wang L, Huen AK,
Peacock WJ, et al. Intraspecific Arabidopsis hybrids show different
patterns of heterosis despite the close relatedness of the parental
genomes. Plant Physiol. 2014;166:265–80.
12. Murase K, Shiba H, Iwano M, Che FS, Watanabe M, Isogai A, et al.
A membrane-anchored protein kinase involved in Brassica self-incompatibility
signaling. Science. 2004;303:1516–9.
13. Fujimoto R, Sugimura T, Fukai E, Nishio T. Suppression of gene expression of
a recessive SP11/SCR allele by an untranscribed SP11/SCR allele in Brassica
self-incompatibility. Plant Mol Biol. 2006;61:577–87.
14. Fujimoto R, Nishio T. Self-incompatibility. Adv Bot Res. 2007;45:139–54.
15. Kojima M, Kamada-Nobusada T, Komatsu H, Takei K, Kuroha T, Mizutani M,
et al. Highly sensitive and high-throughput analysis of plant hormones
using MS-probe modification and liquid chromatography-tandem mass
spectrometry: an application for hormone profiling in Oryza sativa.
Plant Cell Physiol. 2009;50:1201–14.
16. Kojima M, Sakakibara H. Highly sensitive high-throughput profiling of six
phytohormones using MS-probe modification and liquid chromatographytandem mass spectrometry. Methods Mol Biol. 2012;918:151–64.
17. Fujimoto R, Sasaki T, Nishio T. Characterization of DNA methyltransferase
genes in Brassica rapa. Genes Genet Syst. 2006;81:235–42.
18. Shimizu M, Fujimoto R, Ying H, Pu ZJ, Ebe Y, Kawanabe T, et al. Identification
of candidate genes for Fusarium yellows resistance in Chinese cabbage by
differential expression analysis. Plant Mol Biol. 2014;85:247–57.
19. Shen H, He H, Li J, Chen W, Wang X, Guo L, et al. Genome-wide analysis
of DNA methylation and gene expression changes in two Arabidopsis
ecotypes and their reciprocal hybrids. Plant Cell. 2012;24:875–92.
20. Guo M, Rupe MA, Dieter JA, Zou J, Spielbauer D, Duncan KE, et al. Cell
number regulator1 affects plant and organ size in maize: implications for
crop yield enhancement and heterosis. Plant Cell. 2010;22:1057–73.
21. Li A, Zhou Y, Jin C, Song W, Chen C, Wang C. LaAP2L1, a Heterosis-associated
AP2/EREBP transcription factor of Larix, increases organ size and final biomass
by affecting cell proliferation in Arabidopsis. Plant Cell Physiol. 2013;54:1822–36.
22. Gonzalez N, Vanhaeren H, Inzé D. Leaf size control: complex coordination
of cell division and expansion. Trends Plant Sci. 2012;17:332–40.
Saeki et al. BMC Plant Biology (2016) 16:45
Page 15 of 15
23. Breitenbach J, Zhu C, Sandmann G. Bleaching herbicide norflurazon inhibits
phytoene desaturase by competition with the cofactors. J Agric Food Chem.
2001;49:5270–2.
24. Wilson PC, Koch R. Influence of exposure concentration and duration on
effects and recovery of Lemna minor exposed to the herbicide norflurazon.
Arch Envn Contam Toxicol. 2013;64:228–34.
25. Barth S, Busimi AK, Friedrich Utz H, Melchinger AE. Heterosis for biomass
yield and related traits in five hybrids of Arabidopsis thaliana L Heynh
Heredity. 2003;91:36–42.
26. Meyer RC, Törjék O, Becher M, Altmann T. Heterosis of biomass production
in Arabidopsis. Establishment during early development. Plant Physiol. 2004;
134:1813–23.
27. Moore S, Lukens L. An evaluation of Arabidopsis thaliana hybrid traits and
their genetic control. G3. 2011;1:571–9.
28. Meyer S, Pospisil H, Scholten S. Heterosis associated gene expression in
maize embryos 6 days after fertilization exhibits additive, dominant and
overdominant pattern. Plant Mol Biol. 2007;63:381–91.
29. Jahnke S, Sarholz B, Thiemann A, Kühr V, Gutiérrez-Marcos JF, Geiger HH,
et al. Heterosis in early seed development: a comparative study of F1
embryo and endosperm tissues 6 days after fertilization. Theor Appl
Genet. 2010;120:389–400.
30. Pyke KA, Leech RM. Rapid image analysis screening procedure for identifying
chloroplast number mutants in mesophyll cells of Arabidopsis thaliana (L.)
Heynh. Plant Physiol. 1991;96:1193–5.
31. Flint-Garcia SA, Buckler ES, Tiffin P, Ersoz E, Springer NM. Heterosis is prevalent
for multiple traits in diverse maize germplasm. PLoS One. 2009;4:e7433.
32. Shi J, Li R, Zou J, Long Y, Meng J. A dynamic and complex network regulates
the heterosis of yield-correlated traits in rapeseed (Brassica napus L.). PLoS One.
2011;6:e21645.
33. Ni Z, Kim ED, Ha M, Lackey E, Liu J, Zhang Y, et al. Altered circadian rhythms
regulate growth vigour in hybrids and allopolyploids. Nature. 2009;457:327–31.
34. Krieger U, Lippman ZB, Zamir D. The flowering gene SINGLE FLOWER TRUSS
drives heterosis for yield in tomato. Nat Genet. 2010;42:459–63.
35. Song GS, Zhai HL, Peng YG, Zhang L, Wei G, Chen XY, et al. Comparative
transcriptional profiling and preliminary study on heterosis mechanism of
super-hybrid rice. Mol Plant. 2010;3:1012–25.
36. Fujimoto R, Taylor JM, Sasaki T, Kawanabe T, Dennis ES. Genome wide gene
expression in artificially synthesized amphidiploids of Arabidopsis. Plant Mol
Biol. 2011;77:419–31.
37. Wang J, Tian L, Lee HS, Wei NE, Jiang H, Watson B, et al. Genomewide
nonadditive gene regulation in Arabidopsis allotetraploids. Genetics. 2006;
172:507–17.
38. Horiguchi G, Mollá-Morales A, Pérez-Pérez JM, Kojima K, Robles P, Ponce MR,
et al. Differential contributions of ribosomal protein genes to Arabidopsis
thaliana leaf development. Plant J. 2011;65:724–36.
39. de Bossoreille de Ribou S, Douam F, Hamant O, Frohlich MW, Negrutiu I.
Plant science and agricultural productivity: why are we hitting the yield
ceiling? Plant Sci. 2013;210:159–76.
40. Casanova-Sáez R, Candela H, Micol JL. Combined haploinsufficiency and
purifying selection drive retention of RPL36a paralogs in Arabidopsis. Sci
Rep. 2014;4:4122.
Submit your next manuscript to BioMed Central
and we will help you at every step:
• We accept pre-submission inquiries
• Our selector tool helps you to find the most relevant journal
• We provide round the clock customer support
• Convenient online submission
• Thorough peer review
• Inclusion in PubMed and all major indexing services
• Maximum visibility for your research
Submit your manuscript at
www.biomedcentral.com/submit