Transcriptome and metabolite profiling reveals that prolonged drought modulates the phenylpropanoid and terpenoid pathway in white grapes (Vitis vinifera L.)
Bạn đang xem bản rút gọn của tài liệu. Xem và tải ngay bản đầy đủ của tài liệu tại đây (3.47 MB, 17 trang )
Savoi et al. BMC Plant Biology (2016) 16:67
DOI 10.1186/s12870-016-0760-1
RESEARCH ARTICLE
Open Access
Transcriptome and metabolite profiling
reveals that prolonged drought modulates
the phenylpropanoid and terpenoid
pathway in white grapes (Vitis vinifera L.)
Stefania Savoi1,2, Darren C. J. Wong3, Panagiotis Arapitsas1, Mara Miculan2,4, Barbara Bucchetti2, Enrico Peterlunger2,
Aaron Fait5, Fulvio Mattivi1 and Simone D. Castellarin2,3*
Abstract
Background: Secondary metabolism contributes to the adaptation of a plant to its environment. In wine grapes,
fruit secondary metabolism largely determines wine quality. Climate change is predicted to exacerbate drought
events in several viticultural areas, potentially affecting the wine quality. In red grapes, water deficit modulates
flavonoid accumulation, leading to major quantitative and compositional changes in the profile of the anthocyanin
pigments; in white grapes, the effect of water deficit on secondary metabolism is still largely unknown.
Results: In this study we investigated the impact of water deficit on the secondary metabolism of white grapes using
a large scale metabolite and transcript profiling approach in a season characterized by prolonged drought. Irrigated
grapevines were compared to non-irrigated grapevines that suffered from water deficit from early stages of berry
development to harvest. A large effect of water deficit on fruit secondary metabolism was observed. Increased
concentrations of phenylpropanoids, monoterpenes, and tocopherols were detected, while carotenoid and flavonoid
accumulations were differentially modulated by water deficit according to the berry developmental stage. The RNAsequencing analysis carried out on berries collected at three developmental stages—before, at the onset, and at late
ripening—indicated that water deficit affected the expression of 4,889 genes. The Gene Ontology category secondary
metabolic process was overrepresented within up-regulated genes at all the stages of fruit development considered,
and within down-regulated genes before ripening. Eighteen phenylpropanoid, 16 flavonoid, 9 carotenoid, and 16
terpenoid structural genes were modulated by water deficit, indicating the transcriptional regulation of these
metabolic pathways in fruit exposed to water deficit. An integrated network and promoter analyses identified a
transcriptional regulatory module that encompasses terpenoid genes, transcription factors, and enriched droughtresponsive elements in the promoter regions of those genes as part of the grapes response to drought.
Conclusion: Our study reveals that grapevine berries respond to drought by modulating several secondary metabolic
pathways, and particularly, by stimulating the production of phenylpropanoids, the carotenoid zeaxanthin, and of
volatile organic compounds such as monoterpenes, with potential effects on grape and wine antioxidant potential,
composition, and sensory features.
Keywords: Abiotic stress, Grapevine, Network analysis, RNA sequencing, Transcriptomics, Water deficit
* Correspondence:
2
Dipartimento di Scienze Agro-alimentari, Ambientali e Animali, University of
Udine, Via delle Scienze 208, 33100 Udine, Italy
3
Wine Research Centre, The University of British Columbia, 2205 East Mall,
Vancouver, BC V6T 1Z4, Canada
Full list of author information is available at the end of the article
© 2016 Savoi et al. Open Access This article is distributed under the terms of the Creative Commons Attribution 4.0
International License ( which permits unrestricted use, distribution, and
reproduction in any medium, provided you give appropriate credit to the original author(s) and the source, provide a link to
the Creative Commons license, and indicate if changes were made. The Creative Commons Public Domain Dedication waiver
( applies to the data made available in this article, unless otherwise stated.
Savoi et al. BMC Plant Biology (2016) 16:67
Background
Plant secondary metabolites include more than 200,000
compounds that display a large chemical diversity while
accumulating in specific organs, tissues, and cells [1].
They ensure a plant’s survival in the environment by
performing a multitude of functions, such as defending
plant tissues from pathogens or herbivorous attacks,
and aiding reproduction by attracting pollinators or
seed dispersers [2]. Berry fruits accumulate a variety of
secondary metabolites such as polyphenols, stilbenoids,
carotenoids, and free and bound volatile organic compounds (VOCs) [3, 4]. These metabolites affect fruit
pigmentation and flavour, and confer to the fruit wellknown health benefits. In several fruit crops, the concentration of these metabolites significantly impacts the
quality of the fruit and, indeed, the economic value of
production. As part of the adaptation mechanism of a
plant to its environment, secondary metabolism is sensitive to biotic and abiotic cues [1]. Hence, in agricultural settings the effect of climatic constraints on the
accumulation of these metabolites should be taken into
consideration for developing cultivation strategies that
optimize fruit composition and crop economic value.
Grapes are one of the major fruit crops in the world
[5]. Dry and warm Mediterranean climates are considered optimal for wine grape production; in these climates, grapes are often produced without artificial
irrigation. However, limited water availability results in
reduced vine vigor and fruit growth, significant losses in
crop yield, and changes in fruit composition [6]. Moreover, climate change is predicted to exacerbate drought
events in several viticultural areas; and Hannah et al. [7]
postulate that these phenomena may reduce the viability
of viticulture in regions where grapes have been traditionally cultivated.
Grapevine berry secondary metabolism is under strong
genetic control and varies among cultivars [8, 9]. Hence,
the task of understanding the response of this metabolism to environmental cues is complicated. Several studies have investigated the impact of drought and deficit
irrigation strategies on berry secondary metabolism in
red grape cultivars, focusing specifically on the accumulation of phenolics. Recently, Hochberg et al. [10]
employed large-scale metabolite analyses to investigate
the impact of deficit irrigation on this metabolism in
Cabernet Sauvignon and Shiraz grapes, and showed cultivar specificity in the magnitude of response. In general,
it is recognized that moderate and severe water deficits
promote the synthesis and increase the concentration of
flavonoids in red grapes, often resulting into better sensory attributes of wines [6]. Besides phenolics, many
other secondary metabolites accumulate in the grape
berry. These include carotenoids [11] and free and glycosylated VOCs such as C13-norisoprenoids, terpenes,
Page 2 of 17
aldehydes, ketones, esters, and alcohols [12]. Deluc et al.
[13] adopted a microarray platform to investigate differences in the transcriptome response to water deficit between Cabernet Sauvignon, a red grape variety, and
Chardonnay, a white grape variety. The study revealed
that genes of several secondary metabolic pathways were
modulated by water deficit and this metabolic response
varied with the cultivar considered. In Chardonnay
grapes, water deficit increased the level of expression of
one terpene synthase, indicating that terpenes might be
part of the metabolic response to water deficit.
The effect of water deficit on secondary metabolism
remains largely unexplored in fruits; particularly, very
little information is available on the effect of this deficit
on the concentration of VOCs, key determinants of
fruit economic value, and in the case of wine grapes, of
the wine sensory features. Recently, large scale transcript and metabolite analyses have been adopted to reveal the metabolic responses of white grapes to cluster
exposure to sunlight and to a biotic stress [14, 15]. In
this case study, we employed a large-scale metabolite
profiling and RNA-sequencing analyses to evaluate the
impact of water deficit on berry secondary metabolism
in white grapes in a year characterized by high temperatures and low rainfalls (Additional file 1: Table S1) in a
North Italian viticultural region where irrigation is
rarely applied to the grapevines. We hypothesize that
water deficit may activate the terpenoid pathway and
the production of monoterpenes. Two different water
regimes were applied to Tocai Friulano vines and the
effect of water deficit on the transcriptome program
and the phenolic, carotenoid, tocopherol, and free VOC
accumulation were investigated at different stages of
berry development. Finally, an integrated network analysis was undertaken to investigate the impact of the
water deficit on metabolite-metabolite and metabolitetranscript interactions in developing grapes.
Results
Impact of irrigation treatments on plant water status,
yield, berry growth, berry soluble solids, and titratable
acidity
Two irrigation treatments were applied to vines during
the season. Irrigated vines (defined as C, controls,
henceforward) were weekly irrigated in order to keep
their stem water potential (ΨStem) above −0.8 MPa,
whereas vines subjected to deficit irrigation (defined as
D, deficit irrigation, henceforward) were not irrigated
from fruit set until harvest, unless they displayed signs
of extreme water deficit: ΨStem lower than −1.5 MPa and
fading of the canopy.
Rainfalls during the 2012 season were very limited
(Fig. 1a) and mean temperatures peaked just before veraison (the onset of fruit ripening), which was recorded
Savoi et al. BMC Plant Biology (2016) 16:67
Page 3 of 17
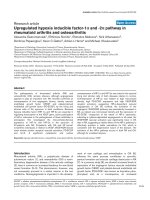
Fig. 1 Weather conditions at the experimental site and impact of
irrigation treatments on plant and fruit physiology. a Daily rainfall
and average temperature. Progress of b stem water potential
(ΨStem), c berry weight, d soluble solid accumulation, and e titratable
acidity in fully irrigated (C) and deficit irrigated (D) vines. Dotted lines
indicate veraison. Bars represent ± SE. Asterisks indicate significant
differences between treatments at P < 0.05 (*), P < 0.01 (**), P < 0.001
(***) evaluated by one-way ANOVA
65 days after anthesis (DAA). ΨStem of D vines decreased
from early stages of fruit development (Fig. 1b) while
ΨStem of C vines generally remained above −0.8 MPa.
ΨStem of D vines reached the seasonal minimum
(−1.5 MPa) at 67 DAA. Afterward, three consecutive irrigations together with some rainfalls initiated a partial
recovery of ΨStem values in D vines.
Irrigation treatments significantly affected vine productivity and D reduced both cluster weight and yield per
vine (Additional file 2: Table S2). Moreover, water deficit
severely reduced berry weight in D during most part of
the season (Fig. 1c), produced increased soluble solids (a
good indicator of sugar concentration) before veraison
(41 and 54 DAA) and at harvest (93 DAA) (Fig. 1d), and
increased and decreased the concentration of acids
before (41 DAA) and after (68 and 82 DAA) veraison,
respectively, but not at harvest (Fig. 1e).
Impact of water deficit on secondary metabolites and
integrated networks of metabolites
Berries were sampled for secondary metabolite analyses
(Additional file 3: Table S3) six times during the season:
three times before ripening (27, 41, and 54 DAA), one at
the beginning of ripening (68 DAA), one at midripening (82 DAA), and one at late ripening (93 DAA)
that coincided with the harvest date of the vineyard.
Large scale metabolite analysis identified 27 phenolics, 8
carotenoids, 2 tocopherols, and 37 VOCs. A principal
component analysis over the metabolite profiles of the
48 samples analyzed (two treatments x six developmental stages x four biological replicates) was performed
(Additional file 4: Figure S1). The analysis indicates that
the metabolite profile largely varied based on the berry
development, with a sharp distinction between before ripening (27, 41, 54 DAA) and ripening stages (68, 82, 93
DAA), largely driven by the PC1. The irrigation treatment
also affected the metabolite profile, with a clear separation
of C and D samples at late ripening (93 DAA).
Water deficit affected the concentration of 20 out of
27 phenolics at one or more developmental stages
(Fig. 2a, Additional file 5: Figure S2). Water deficit
generally increased the concentration of derivatives of
cinnamic and benzoic acids, and modulated the accumulation of flavan-3-ols and proanthocyanidins. Their
concentration was increased and decreased by water
Savoi et al. BMC Plant Biology (2016) 16:67
Page 4 of 17
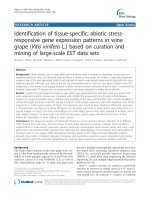
Fig. 2 Effect of water deficit on secondary metabolites during fruit development. Heatmaps represent log2FC(D/C) of the a phenolic, b
carotenoid and tocopherol, and c VOC concentration under water deficit conditions at 27, 41, 54, 68, 82, 93 DAA. Blue and red boxes indicate
lower and higher concentration in D, respectively. Asterisks indicate significant differences (P < 0.05) between treatments. Metabolites were
hierarchically clustered based on their response to water deficit
deficit before (27, 41, and 54 DAA) and after (68, 82,
and 93 DAA) veraison, respectively. Limited effects of
water deficit on stilbenoid accumulation were observed. In contrast, D largely affected the accumulation
of carotenoid and tocopherols in the berry (Fig. 2b,
Additional file 6: Figure S3). The concentration of
most carotenoids was increased and decreased in D
before and after veraison, respectively. Zeaxanthin, αtocopherol, and γ-tocopherol concentrations were higher
in D than in C after veraison. Water deficit also increased
the concentration of 12 VOCs (Fig. 2c, Additional file 7:
Figure S4) at late ripening (93 DAA). At this stage, D promoted the accumulation of monoterpenes such as hotrienol, linalool, nerol, and α-terpineol.
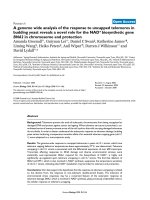
Differences in metabolic network properties could be
observed between C and D (Additional file 8: Table S7A)
for the phenolic (Fig. 3a,b) and VOC (Fig. 3c,d) networks, but not for the carotenoid and tocopherol ones
(Additional file 9: Figure S5). Water deficit affected the
phenolic and VOC network topology by increasing the
network connectedness in comparison with the controls.
In general, the majority of both C and D metabolite-
metabolite correlations are based on positive interactions
among nodes, but negative correlations were observed
especially under D, in particular for gallic acid. We observed two highly interconnected clusters within the
VOC network of D berries; one of these clusters contained many of the VOCs that were significantly modulated under D.
Impact of water deficit on berry transcriptome
To investigate the molecular changes that take place in
the berry under water deficit, and to relate these
changes to the observed changes in the berry metabolite profile, we compared the transcriptome of C and D
berries at three selected developmental stages, 41 DAA
(before ripening), 68 DAA (beginning of ripening), 93
DAA (late ripening).
After filtering for organelles contamination and quality
trimming, the average number of unique reads that
mapped the V1 version of the grape genome [16] was
25.4 M (Additional file 10: Table S4). Among the 29,971
genes of the grapevine genome, 23,603 (78.8 %) were
expressed at 41 DAA, 22,259 (74.4 %) at 68 DAA, and
Savoi et al. BMC Plant Biology (2016) 16:67
Page 5 of 17
Fig. 3 Network representation of phenolics and VOCs in C (a, c) and D (b, d) berries during development. Nodes represent ‘metabolites’ and edges
represent ‘relationships’ between any two metabolites. Edges colored in ‘red’ and ‘blue’ represent positive and negative correlations (P < 0.001),
respectively. Metabolites in bold indicate a significant effect of water deficit on the concentration of that metabolite at one or more developmental
stages. Number of correlating edges were 13, 35, 11, 42 in (a, b, c, and d), respectively. The average node neighborhood was 1.53, 3.89, 1.57, and 3.11
in (a, b, c, and d), respectively. The clustering coefficient was 0.08, 0.53, 0.00, and 0.49 in (a, b, c, and d), respectively
22,349 (74.7 %) at 93 DAA. At harvest, the number of
expressed genes was significantly higher in D (22,655)
than in C (22,042).
A strong relationship was found between the RNA-seq
and qPCRs gene expression values of 15 genes selected
for validating the transcriptomic dataset (Additional file
11:Table S5, Additional file 12: Figure S6). Coefficient of
correlation between RNA-seq and qPCR gene expression
ranged between 0.792 and 0.999, indicating the reliability
of the whole transcriptome assays.
A principal component analysis over the transcriptome
profiles of the 18 samples analyzed (two treatments x
three developmental stages x three biological replicates)
was performed (Fig. 4a). The first three principal components explain 52.9, 26.5, and 7.1 % of the variance among
samples, respectively. Similarities and differences among
Fig. 4 Analysis of the berry transcriptome in fully irrigated (C) and deficit irrigated (D) vines. a Principal component analysis (PCA) of the berry
transcriptome of 18 independent samples collected from C and D vines at 41, 68, and 93 DAA. Circles, triangles and squares represent berries at
41, 68, and 93 DAA, respectively. Full and open symbols identify C and D berries, respectively. b Common and unique DE genes at 41, 68, and 93
DAA are represented in the Venn diagram
Savoi et al. BMC Plant Biology (2016) 16:67
berry transcriptomes were mostly driven by the developmental stage when berries were sampled. C and D samples
were mixed within the group of the samples harvested at
41 DAA, but were clearly separated at 68 and 93 DAA,
with the majority of the variance explained by the second
principal component.
The total number of differentially expressed (DE)
genes between C and D was 4,889 (Additional file 13:
Table S6A, B, C). The number of DE genes changed during fruit development. D modulated the expression of
1,016 genes (316 up-regulated; 700 down-regulated) at
41 DAA, 2,448 genes (1,119 up-regulated; 1,329 downregulated) at 68 DAA, and 2,446 genes (1,142 upregulated; 1,304 down-regulated) at 93 DAA. Some
genes were differentially regulated in unison among two
or three developmental stages (Fig. 4b, Additional file
13: Table S6A, B, C, D).
Seventeen plant GO categories (slim biological processes) were significantly overrepresented among DE
genes (Additional file 13: Table S6E). Before ripening (41
DAA), carbohydrate metabolic process, development, and
response to biotic stress were the three major Gene
Ontology (GO) categories within up-regulated genes,
while response to stress, transport, and response to abiotic
stress were the major GO categories within downregulated genes. At the beginning of ripening (68 DAA),
response to stress, carbohydrate, and response to abiotic
stress were the three major GO categories within upregulated genes, and response to stress, transport, and development were overrepresented GO categories within
down-regulated genes. At late ripening (93 DAA), response to stress, development, and response to abiotic
stress were the three major GO categories within upregulated genes, and response to stress, transport, and
carbohydrate metabolic process were enriched GO categories within down-regulated genes. The GO category
secondary metabolic process was overrepresented within
up-regulated genes at all the stages of fruit development
considered, and within down-regulated genes at 41 DAA.
Impact of water deficit on phenylpropanoid, flavonoid,
carotenoid, and terpenoid pathway
Because this study focuses on the impact of water
deficit on secondary metabolism, we did identify the
DE genes that belonged to the major secondary metabolic pathways in the grapevine berry during development (Additional file 13: Table S6 F, G, H). The
impact of water deficit on the expression of these
genes was expressed as the log2 fold change of the
transcript level in D compared to C. Finally, the genes
were mapped into the related metabolic pathways (Figs. 5,
6, 7).
Water deficit modulated the expression of many genes
that codify for structural enzymes of the phenylpropanoid
Page 6 of 17
and flavonoid pathway (Fig. 5). Most of these genes were
up-regulated under D, particularly at 41 and 93 DAA.
Among the DE genes, three genes annotated as
phenylalanine ammonia lyases (VviPALs) were upregulated by D at 41 and 93 DAA. One trans-cinnamate 4-monooxygenase (VviC4H; VIT_06s0004g08150)
was up-regulated by D at 41 and 93 DAA, while another
VviC4H (VIT_11s0065g00350) was down-regulated at 41
and up-regulated at 68 DAA. Four 4-coumarate-CoA
ligase (Vvi4CL; VIT_02s0025g03660, VIT_02s0109g
00250, VIT_11s0052g01090, VIT_16s0039g02040) were
up-regulated by D at different developmental stages.
Other two Vvi4CL (VIT_16s0050g00390, VIT_18s00
01g00290) were down-regulated at 41 DAA. One pcoumaroyl shikimate 3'-hydroxylase (VviC3H) and one
hydroxycinnamoyl-CoA:shikimate/quinate hydroxycinnamoyltransferase (VviHCT) were up-regulated by D
at 93 DAA. Two caffeic acid 3-O-metyltransferase
(VviCOMT) were up-regulated by D: one (VIT_02s0
025g02920) at 68 and 93 DAA, the other one
(VIT_08s0007g04520) only at 68 DAA. Finally, a
caffeoyl-CoA 3-O-methyltransferase (VviCCoAMT;
VIT_03s0063g00140) was down-regulated at 68 and
up-regulated at 93 DAA, while another VviCCoAMT
(VIT_07s0031g00350) was up-regulated at all the three
stages of development.
In parallel, water deficit modulated the expression of
most structural flavonoid genes; particularly three chalcone synthases (VviCHSs), two chalcone isomerases
(VviCHIs), one flavonoid-3′5′-hydroxylase (VviF3′5′H),
two flavanone-3-hydroxylases (VviF3Hs), one dihydroflavonol reductase (VviDFR), and two leucoanthocyanidin
dioxygenases (VviLDOX). All the above genes except
one VviLDOX (VIT_08s0105g00380) were up-regulated
by D. The flavonol synthase (VviFLS) is a key enzyme
for flavonol production. Water deficit significantly promoted the expression of one VviFLS (VIT_18s0001g0
3470) at 68 and 93 DAA while down-regulating the expression of another VviFLS (VIT_18s0001g03430) at 68
DAA. The leucoanthocyanidin reductase (VviLAR) and
anthocyanidin reductase (VviANR) are key regulators of
the flavan-3-ol and proanthocyanidin biosynthesis. VviLAR1 was up-regulated by water deficit at 41 DAA,
while VviLAR2 was down-regulated in the same condition at 68 DAA and up-regulated at 93 DAA. VviANR
was up-regulated by water deficit at 41 DAA and downregulated at 68 DAA.
Despite the fact that VviMyb14 (VIT_07s0005g03340)
and VviMyb15 (VIT_05s0049g01020)—transcription factors that regulate stilbene synthesis in grapevine
[17]—were differentially expressed in D at 68 DAA
(Additional file 13: Table S6B), transcript levels of the
48 annotated VviSTSs [18] were never affected by
water deficit.
Savoi et al. BMC Plant Biology (2016) 16:67
Page 7 of 17
Fig. 5 Modulation of phenylpropanoid and flavonoid pathway under water deficit. Log2FC (D/C) levels of differential gene expression are
presented at 41 (left box), 68 (central box), and 93 (right box) DAA. Blue and red boxes indicate down- or up-regulation of the gene under water deficit,
respectively. Bold margins identify significant differences (P < 0.05) between treatments. Symbols identify commonly regulated steps of the pathway.
Transcript levels, expressed as normalized counts, in C and D berries at 41, 68, and 93 DAA, are reported in Additional file 13: Table S6 F
The effect of water deficit on the carotenoid pathway
was analyzed according to the Vitis vinifera carotenoid
genes identified by Young et al. [11]. A phytoene synthase gene (VviPSY2) was upregulated under water deficit but only at 68 DAA (Fig. 6). The same was
observed for a ζ-carotene desaturase (VviZDS1). On the
contrary, water deficit down-regulated the expression
of a lycopene β-cyclase (VviLBCY), a β-carotene hydroxylase (VviBCH2), and a carotene hydroxylase (VviLUT5) at 68 DAA, and of a carotenoid isomerase
(VviCISO1) at 93 DAA. The expression of a lycopene εcyclase (VviLECY1) was down-regulated by D at 41 and
up-regulated at 93 DAA.
In plants, carotenoids are also the substrate for the
production of norisoprenoids. Some C13-norisoprenoids,
such as β-ionone and β-damascenone, are important determinants of the grape and wine aroma [12]. The enzymes (9,10) (9′,10′) cleavage dioxygenase (CCD4) and
(5,6) (5′,6′) (9,10) (9′,10′) cleavage dioxygenase (CCD1)
are key enzymes in the norisoprenoid synthesis. In this
study, D up-regulated the expression of VviCCD4b at 68
DAA and down-regulated the expression of VviCCD4a
at 93 DAA.
Plant terpenes are synthesized in the plastids through
the 2C-methyl-D-erythritol-4-phosphate pathway (MEP),
and in the cytosol through the mevalonate (MVA)
Savoi et al. BMC Plant Biology (2016) 16:67
Page 8 of 17
The impact of water deficit on the expression of key
genes of the phenylpropanoid, flavonoid, and terpenoid
pathway was then investigated at all the six sampling
dates with targeted gene expression analyses (Additional
file 14: Figure S7). VviPAL2, VviCHS1, VviFLS, and
VviANR were up-regulated by water deficit at several developmental stages in parallel with the observed increase
of phenolic concentration under the same conditions
(Fig. 2a). Similarly, the expression profile of two VviTPSs
(VIT_12s0134g00030 and VIT_19s0014g04930) indicated
that water deficit stimulated a higher synthesis of terpenes from 82 DAA.
Impact of water deficit on integrated networks of
metabolites and transcripts
Fig. 6 Modulation of carotenoid pathway under water deficit.
Log2FC (D/C) levels of differential gene expression are presented
at 41 (left box), 68 (central box), and 93 (right box) DAA. Blue
and red boxes indicate down- or up-regulation of the gene
under water deficit, respectively. Bold margins identify significant
differences (P < 0.05) between treatments. Symbols identify
commonly regulated steps of the pathway. Transcript levels,
expressed as normalized counts, in C and D berries at 41, 68,
and 93 DAA, are reported in Additional file 13: Table S6 G
pathway. Water deficit modulated the expression of
several genes of the two pathways (Fig. 7). Genes regulating early steps of the MEP pathway, such as one 1deoxy-D-xylulose-5-phosphate synthase (VviDXS1) and
the 1-deoxy-D-xylulose-5-phosphate reductoisomerase
(VviDXR) were down-regulated by D at 41 DAA, while
another VviDXS was down-regulated at 68 DAA and
up-regulated at 93 DAA. Terpene synthases (VviTPSs)
were generally up-regulated under water deficit, particularly at 93 DAA. The terpene synthases gene family
was recently characterized in Vitis vinifera [19]. Water
deficit modulated the expression of seven terpene
synthases of the TPS-a family (VIT_18s0001g04280,
VIT_18s0001g04530, VIT_18s0001g05240, VIT_18s000
1g05290, VIT_18s0001g05430, VIT_19s0014g04810,
VIT_19s0014g04930), one of the TPS-b family (VIT_12s
0134g00030), and one of the TPS-g family (VIT_00s
0266g00070).
The increased average node degree, clustering coefficient, and network density between the C and D
metabolite-metabolite networks prompted us to perform an association study between metabolites and
transcripts in order to reveal the major transcripts
that were associated with changes in metabolite networks (Additional file 8: Table S7B, C, D). Emphasis
was given on biosynthetic genes of the metabolite
pathways considered. The number of positive correlations between phenolic compounds and phenolic biosynthetic genes slightly increased under D particularly
because of an increase in the number of correlations
within benzoic and cinnamic acid pathway elements
(Additional file 8: Table S7C, D). VOC-transcript links
were also affected by water deficit. Correlations between geraniol, citronellol, and hotrienol levels and
terpenoid transcripts were observed in controls only
(Additional file 8: Table S7B, D). In contrast, correlations between nerol and α-terpineol levels and terpenoid transcripts were observed only under water deficit
(Additional file 8: Table S7C). Water deficit also modulated the correlations between the non-terpenoid
VOCs and the fatty acid related transcripts: reducing
them for (EE)-2,4-hexadienal and (E)-2-pentenal, and
increasing them for nonanal, hexanol, and 3-hexenol.
The number of carotenoid-transcript correlations was
not affected by water deficit.
The knowledge of the regulation of monoterpene biosynthesis is lacking. Because of the remarkable effect of
water deficit on the VOC networks, we furthered our
analysis into gene-metabolite relationship focusing on
ripening-related monoterpenes induced by water deficit.
These included linalool, nerol, and α-terpineol. The
gene-metabolite network included the top 100 gene correlators for each of these monoterpenes (Fig. 8a). Among
the 222 genes present in the network, 116 genes (52 %)
were differentially expressed under water deficit. There
were 49, 48, and 64 gene-metabolite relationship that
were specific for α-terpineol, nerol, and linalool,
Savoi et al. BMC Plant Biology (2016) 16:67
Page 9 of 17
Fig. 7 Modulation of terpenoid pathway under water deficit. Log2FC (D/C) levels of differential gene expression are presented at 41 (left box), 68
(central box), and 93 (right box) DAA. Blue and red boxes indicate down- or up-regulation of the gene under water deficit, respectively. Bold
margins identify significant differences (P < 0.05) between treatments. Transcript levels, expressed as normalized counts, in C and D berries
at 41, 68, and 93 DAA, are reported in Additional file 13: Table S6 H
respectively. Inspection of the overall network showed
that a large proportion of these correlated genes were involved in terpenoid (18), lipid (10), and hormone (7) metabolism, as well as various transport (11) and signaling
(13) mechanisms (Additional file 8: Table S7E). Eleven
gene-metabolite interactions were found for all the three
metabolites and 29 interactions were in common between α-terpineol and nerol. We highlight several potential transcriptional regulators annotated as MYB24
(VIT_14s0066g01090), C2H2 Zinc finger (VIT_07s
0005g02190), and Constans-like 11 (VIT_19s0014g
05120), which significantly correlated with these monoterpenes. Promoter enrichment analysis of the top 100
correlated transcripts for each metabolite further
revealed that many of the genes within each network
contain significantly enriched (P < 0.01) MYB recognition (such as MYBZM, MYBCOREATCYCB1, MYB1AT,
MYBPLANT, MYBCORE, MYB2CONSENSUSAT) and
various drought-responsive (RYREPEATBNNAPA, LTRE
COREATCOR15, DRECRTCOREAT, MYCCONSENSU
SAT, MYCATRD22) motif elements (Fig. 8b, Additional
file 8: Table S7F).
Discussion
The prolonged and severe water deficit imposed in
this experiment modulated the accumulation of
Savoi et al. BMC Plant Biology (2016) 16:67
Page 10 of 17
Fig. 8 Predicted gene-metabolite networks related to linalool (1), α-terpineol (2), and nerol (3) in grapevine berries during development. a Genes
and metabolites are represented by circle and square nodes respectively. Edges represent associations (P < 0.001) between transcripts and
metabolites. The top 100 correlators for each metabolite are shown. Node borders in red represent DE transcripts. Node colors indicate
the pathway of the transcripts. b Heatmap of cis-regulatory elements enriched (P < 0.01) within the networks in a. Cis-regulatory elements
in bold and underlined are associated with ABA/drought response and MYB binding, respectively. Light and dark red color denotes enrichment scores
between 2 (P < 0.01) and 4 (P < 0.0001) respectively. White color represents no significant enrichment. *, **, ***, and **** denotes other
PLACE cis-regulatory motifs sharing similar consensus sequence with the associated motif (Additional file 8: Table S7F)
phenylpropanoids, flavonoids, carotenoids, and several
VOCs in the berry.
At present, little information is available on the effect of water deficit on phenolic accumulation in
white grapes. Our study indicates that the phenylpropanoid and the flavonoid pathway respond to water
deficit at the transcript and metabolite level, and determine a general increase in phenolic concentrations.
In red grape cultivars, water deficit strongly promotes
accumulation of flavonoids, particularly anthocyanin
[13, 20]. Anthocyanin biosynthesis is limited in white
grapes; however, these grapes do accumulate other
major flavonoids such as flavonols, flavan-3-ols, and
proanthocyanidins. Recent studies reported that water
deficit increases flavonol concentration [9, 13] and reduces [10] or does not affect proanthocyanidin concentration in grapes [20]. Water deficit can increase
the concentration in the berry of secondary metabolites produced in the skin and in the seed by reducing
the berry volume and increasing relative skin and
seed masses [21–23]. This was not the case in this
study, since relative skin and seed masses were not affected by water deficit (Additional file 15: Figure S8). Our
gene expression analysis indicated that many phenylpropanoid and flavonoid genes were up-regulated under
water deficit, and the modulation of these pathways increased the concentration of derivatives of benzoic and
cinnamic acids and of several flavonoids. Interestingly, key
structural genes for the flavonol and flavan-3-ol biosynthesis, such as flavonol synthases (VviFLSs) and leucoanthocyanidin reductases (VviLARs), were up-regulated
at late stages of development, while flavonols, flavan-3-ols,
and proanthocyanidin increased in concentration under
water deficit only at early stages of development (except
procyanidin B1, which was also higher at harvest). Similarly, in Cabernet Sauvignon vines exposed to water deficit, VviLAR, VviANR, and VviFLS were up-regulated after
the onset of fruit ripening, but no differences in flavonol
and proanthocyanidin concentration were observed [20].
Our combined transcript and metabolite data suggest that
a competition for precursors between enzymes of the flavonoid and phenylpropanoid pathways is occurring, with
Savoi et al. BMC Plant Biology (2016) 16:67
phenylpropanoid enzymes being more efficient in directing the substrates into the production of benzoic and cinnamic acid derivatives than the flavonoid enzymes in
sequestrating these precursors for the productions of flavonoids, particularly after the onset of fruit ripening when
the accumulation of flavan-3-ols and proanthocyanidins
decreases dramatically. To this extent, the increase in connectivity (with negative connections) of gallic acid with
some flavan-3-ols and proanthocyanidins observed under
water deficit highlights the role of this benzoic acid derivative in the drought response, particularly at late stages of
development.
Water deficit affected the concentration of carotenoids
and tocopherols in the berry, but the modulation of carotenoid genes was much lower than for the phenylpropanoid and flavonoid genes. Carotenoids are normally
degraded after the onset of fruit ripening [11], and our
data indicate that this degradation is increased under
water deficit. However, water deficit increased the concentration of zeaxanthin—the only carotenoid synthesized after the onset of berry ripening (Additional file 6:
Figure S3). Zeaxanthin’s role in drought tolerance has
been already hypothesized in plants. Nerium oleander
increased zeaxanthin content in the leaf under water
deficit [24], and the enhancement of zeaxanthin levels in
the transgenic tobacco lines made plants more tolerant
to drought stress [25]. As in our work with berries, previous studies have shown a positive correlation between
tocopherol accumulation and water deficit in photosynthesizing tissues [26, 27]. However, we did not observed
a consistent upregulation of key genes of the tocopherol
pathway under water deficit and, at late stages of ripening (93 DAA), the gene VviHPT (VIT_11s0052g00610)
that encodes for one key enzyme of the pathway was actually down-regulated in D berries (Additional file 13:
Table S6), indicating that the accumulation of tocopherols might be affected by post-translational regulation
and/or that other unknown genes might be involved in
the regulation of this pathway. This result agrees with
previous findings in Arabidopsis, where wild-type plants
subjected to water deficit increased the accumulation of
the same tocopherols in the leaves without a parallel
modulation of tocopherol biosynthetic genes [27].
The VOC profiling indicated that in Tocai Friulano,
VOCs are primarily accumulated at early stages of development (Additional file 7: Figure S4), but prolonged
water deficit can stimulate the accumulation of several
VOCs at late stages of development. The network analysis revealed that most of the VOCs modulated by water
deficit mapped in the same network, but only under
water deficit conditions. This suggests that water deficit
has a major effect on the accumulation of these VOCs,
regardless the pathway they belong to or the type of accumulation pattern they have under normal conditions.
Page 11 of 17
Among these VOCs, four monoterpenes—key aromatics
of several white grapes [4]—were largely increased under
water deficit, in parallel with an up-regulation of key
structural genes of the MEP pathway. In particular, key
genes for monoterpene production in the grapes such as
VviDXS and two VviTPSs [19, 28] were up-regulated.
The induction of monoterpene production under water
deficit has been reported in several plants (reviewed in
[29]), including the recent studies in grapevine leaves
[30, 31], but the information on the effect of drought on
monoterpene biosynthesis in fruits (where monoterpenes
impact the quality and value of production) is lacking
[32]. Besides monoterpene synthases, water deficit also
up-regulated seven sesquiterpene synthases [19]. We
identified only two sesquiterpenes, α-humulene and
trans-caryophyllene, which were accumulated in the
berry only at early stages and were not affected by water
deficit. However, the molecular data indicate that a more
detailed profiling of the sesquiterpene accumulated in
the berry is necessary to investigate the role of these
compounds in the response to water deficit. Other key
odorants of grapes and wines are the carotenoid degradation products C13-norisoprenoids that were observed to
increase in red grapes subjected to a limiting irrigation
regime (reviewed in [12]). Interestingly, despite the
higher degradation of carotenoids observed under
water deficit, no clear modulation in the concentration of C13-norisoprenoids, such as β-damascenone
and β-ionone, and of β-cyclocitral—a 7,8 cleavage
product of β-carotene [33]—was observed.
Metabolomic studies coupled with network analysis
comparing contrasting genotypes, stress perturbations,
and tissues have been useful for understanding the
mechanism of genotype—environment interactions of
plants [34]. Deficit irrigation increased the metabolite
network connectivity for primary metabolites in grapevine leaf, but the effect was genotype-dependent for
phenolic networks [35]. Network-based analysis conducted here on secondary metabolism revealed that
water deficit contributed significantly to restructuring
the underlying network properties of fruit metabolites.
The higher network connectivity of secondary metabolites observed under water deficit also coincided with
the modulation of several genes of the related biosynthetic pathway. It is therefore likely that the observed
differential network connectivity between irrigation
treatments may be determined by regulation at the transcript level [36, 37]. In support of this hypothesis, we
have observed strong gene-metabolite correlations with
phenolic and VOC pathway genes. Our results also
showed that this observation could be extended to other
pathways, such as that for terpenoid biosynthesis. The
higher number of positive metabolite-transcript correlations for phenolics and terpenoids further strengthens
Savoi et al. BMC Plant Biology (2016) 16:67
our finding that those metabolic pathways take part of
the grape response to water deficit, producing secondary
metabolites that potentially enhance grapevine fitness
under this abiotic stress.
In grapes, correlation network analysis has been used
recently to ascribe functions to candidate genes potentially involved in the regulation of color development
[38, 39]. Ma et al. [40] recently adopted a metabolitetranscript network approach to identify key regulators of
the terpenoid pathway in Artemisia annua. Similarly, we
aimed to identify new genes potentially involved in the
regulation of terpenoid metabolism during development
and under water deficit. The comprehensive metabolitetranscript network constructed with three key monoterpenes whose synthesis was promoted under water deficit
showed strong positive association of these metabolites
with terpenoid transcripts. Interestingly, transcripts
related to hormone synthesis (salicylic and jasmonic
acid) and signaling (auxin and brassinosteroid) were
also highly correlated. Terpene levels were significantly increased with the application of BTH (a salicylic acid analog) and methyljasmonate to berries [41]
in grapevine. Additionally, our analysis allowed us to
identify a transcription factor annotated as VviMYB24
(VIT_14s0066g01090) as a promising regulatory candidate for monoterpene and fatty acid biosynthetic
pathways in grapevine. Closer inspection of the annotated MYB gene showed high homology towards Arabidopsis MYB24, MYB21, and MYB57, all of which
are involved in regulating terpenoid biosynthesis [42].
Recently MYB24 was found to be strongly upregulated under solar UV radiation in grape skins, in
parallel with the up-regulation of three terpenoid
structural genes [43], suggesting a major role in the
grapevine berry response to abiotic factors.
Previous studies have shown that terpenoid metabolism responds to light and UV stimuli in berry and leaf
tissues [43–45], and we discovered that light-responsive
motif elements were significantly enriched throughout
the monoterpene gene network (Additional file 8: Table
S7F). This data also indicates that the effects of water
limitation on berry terpenes may be indirect, in part
owing to changes in the fruit microclimate due to a reduction in canopy density. Water deficit can reduce canopy growth determining a higher level of cluster
exposure and, by consequence, higher berry temperature
[46, 47]. The accumulation of grape volatiles can be influenced by light exposure and temperature. Indeed, exposure of berries to sunlight favors accumulation of
norisoprenoids and monoterpenes, and other free VOCs
[15, 45, 48–50]. However, recent studies showed that
water deficit and ABA treatments significantly increased
the monoterpene and sesquiterpene concentration in
grapevine leaves [30, 31] even in the absence of UV
Page 12 of 17
radiation [30]. Moreover, the enrichment of drought
associated elements (e.g., MYB and DRE motifs) in
the promoter region of many up-regulated terpenoid
genes observed in our study suggests a major direct
modulation of the terpenoid pathway at the transcriptional level, possibly via an ABA mediated stimulus.
These elements were frequently associated with abiotic stress responses and particularly to drought and
ABA regulation [51]. Nevertheless, further tests under
more climate-controlled conditions are necessary to
reveal to what extent the impact of water deficit on
fruit metabolism is due to the modification of berry
microclimate.
The stage when deficit is applied and the severity of
deficit certainly impact the response of fruit metabolism
[32]. In grapes it is known that these factors strongly
affect the physiological and metabolic response of the
berry to water deficit [6]. In this case study, large effects
on fruit metabolism were observed with drought occurring from early stages of berry development to harvest; a
condition that also determined a lower yield and higher
berry sugar concentration. However, further investigations that compare water deficit imposed at different
timings and at different level of severity should be carried out to fully understand the fruit response to this
abiotic stress in white grapes, and how this response is
consistent among seasons.
Conclusion
Our study sheds new light into the metabolic mechanisms of fruit response to drought events. Recently it
was hypothesized that an overproduction of key odorants, such as terpenoids and the carotenoids-derived
norisoprenoids, might be part of the adaptation of
white grapes to environmental stresses [5]. Our transcriptome and metabolite analyses showed that, beside
the flavonoid pathway, phenylpropanoid and terpenoid
pathways can take part in the berry’s response to
water deficit in non-pigmented berries; suggesting
that an over-production of monoterpenes is part of
the fruit response to drought. Our network and promoter analyses highlighted a transcriptional regulatory
mechanism that encompasses terpenoid genes, transcription factors, and drought-responsive elements
enriched in the promoter regions of those genes; this
mechanism might be the basis of monoterpenes overproduction. Overall, these results indicate that water
deficit conditions can potentially impact the quality of
white wines by increasing the accumulation of potential antioxidant and flavor compounds (e.g., derivatives of benzoic and cinnamic acids, zeaxanthin, and
monoterpenes) in the grapes. These results are also
pivotal to future studies that evaluate the impact of
deficit irrigation strategies on wine quality.
Savoi et al. BMC Plant Biology (2016) 16:67
Methods
Field experiment, physiological measurements, and sample
preparation
The field experiment was conducted in 2012 in a vineyard at the University of Udine’s (Italy) experimental
farm (46°01'52.3"N 13°13'30.6"E). The field experiment
was conducted in accordance with local legislation and
no specific permission was required for the study.
Climatological data were recorded during the experiment by an automated weather station located 100 m
from the experimental site. Monthly mean temperatures and amount of rainfalls measured in 2012, as well
as the averages of the 2000–2012 period, are shown in
Additional file 1: Table S1. Seven years old Tocai Friulano
(also known as Sauvignon vert and Sauvignonasse in Chile
and France, respectively) grapevines grafted onto SO4
were planted at 2.5 m x 1.0 m spacing in north–south oriented rows, and trained to a cane-pruned ‘Guyot’ system.
Two irrigation treatments were established. Control (C)
vines were irrigated in order to maintain midday stem
water potential (ψStem) above −0.8 MPa. Deficit irrigated
(D) vines were not irrigated unless the ψStem was measured lower than −1.5 MPa. Plant water status was monitored weekly by measuring ψStem using a Scholander
pressure chamber [52]. Irrigation was supplied when rainfall in the preceding week was below 100 % ETc. or ψStem
was measured lower than −1.5 MPa, as discussed above. A
surface drip irrigation system with emitters (0.5 m x
2.5 m) set to an 8 L h−1 application rate was used. At the
maximum rate, water was supplied at approximately 40 L
per vine per week. Due to a prolonged drought, irrigation
(20 L per vine) was applied to D vines at 67, 70, 76 days
after anthesis (DAA) in order to mitigate the extreme
water deficit. Each irrigation treatment was replicated on
four plots of six vines each, arranged in a completely randomized design. No effect of the irrigation treatments was
observed on the number of shoots and clusters per vine.
Samplings were carried out at 27, 41, 54, 68, 82, and
93 DAA. Three sets of berries were randomly collected
from each plot. The first set of 60 berries was used to
measure berry weight, total soluble solid concentration,
and titratable acidity. The second one of 10 berries was
used to measure skin and seed weights and calculate the
relative skin and seed masses. The third set of 40 berries
was used for transcript and metabolite analyses. Berries
were carefully trimmed off the cluster at the pedicel with
a pair of scissors, quickly brought to the laboratory,
weighed, and processed for soluble solids and titratable
acidity [52] or immediately frozen at −80 °C for transcript and metabolite analyses. Before metabolite and
RNA extractions, pedicel was removed with a scalpel
and berries were ground to a fine powder under liquid
nitrogen using an analytical mill (IKA®-Werke GMbH &
CO). One quality control (QC) sample was prepared by
Page 13 of 17
pooling an aliquot of all the samples and was used for
QC runs in the metabolite analyses.
Grapes were harvested for commercial wine production
at 93 DAA, when titratable acidity reached approximately
5 mg/L in both treatments; yield per vine, number of clusters per vine, and cluster weight were recorded.
Metabolite analyses
Phenolic compounds were determined accordingly to
Vrhovsek et al. [53] with some modifications. Briefly,
0.8 mL of chloroform and 1.2 mL of a mix of methanol
and water (2:1) were added to one gram of frozen powder of ground berries. A 50 μL aliquot of o-coumaric
acid solution (2 mg/mL in MeOH) was added as an internal standard. The extraction mixture was shaken for
15 min on an orbital shaker (Grant-Bio Rotator PTR-60)
and then centrifuged for 10 min at 1000 g. The upper
aqueous-methanolic phase was collected. The extraction
was repeated by adding 1.2 mL of methanol and water.
The aqueous-methanolic phase was collected and combined with the previous one, brought to a final volume
of 5 mL with Milli-Q water, and filtered with a 0.2 μm
PTFE filter (Millipore). The chromatographic analysis
was carried out using a Waters Acquity UPLC system
(Milford) coupled to a Waters Xevo triple-quadrupole
mass spectrometer detector (Milford). Compounds were
identified based on their reference standard, retention
time, and qualifier and quantifier ion, and were quantified by their calibration curve.
Carotenoids and tocopherols were analyzed accordingly to Wehrens et al. [54]. Briefly, the chloroform
phase of the extraction solution described above was
collected. Twenty μL of trans-β-apo-8′-carotenal
(25 μg/mL) was used as internal standard. Ten μL of
a 0.1 % triethylamine solution was added to prevent
rearrangement of carotenoids. After extraction, samples were dried with N2, and stored at −80 °C until
analysis. Dried samples were suspended in 50 μL of
ethyl acetate, and transferred to dark vials. The chromatographic analysis was performed in a 1290 Infinity
Binary UPLC (Agilent) equipped with a RP C30 3 μm
column coupled to a 20 x 4.6 mm C30 guard column.
Spectra components and elution profiles were determined as in Wehrens et al. [54]. Compounds were
quantified from linear calibration curves built with
standard solutions.
Free (non-glycosylated) VOCs were analyzed accordingly to Fedrizzi et al. [55] with some modifications. On
the day of analysis, four grams of frozen grape powder
were weighed out in a 20 mL SPME dark-glass vial.
Three grams of NaCl, 15 mg of citric acid, 15 mg of ascorbic acid, 50 μL of sodium azide, and 7 mL of milliQ
water were added to the sample. Fifty μL of a solution
containing five internal standards, d10-4-methyl-3-
Savoi et al. BMC Plant Biology (2016) 16:67
penten-2-one (1 g/L), d11-ethyl hexanoate (1 g/L), d16octanal (1 g/L), d8-acetophenone (1 g/L), d7-benzyl alcohol (1 g/L), was added to each sample. Prior to injection,
the sample was pre-incubated at 60 °C in a SMM Single
Incubator (Chromtech) for 10 min stirring at 450 rpm.
Next, the sample was incubated in the same conditions
for 40 min with a DVB-CAR-PDMS 50/30 μm x 2 cm
(Supelco) fiber in the headspace for absorption. Free
VOCs were thermally desorbed in splitless mode for
4 min at 250 °C. Extractions and injections were carried
out with a CTC Combi-PAL autosampler (Zwingen).
The analysis was performed with a Trace GC Ultra gas
chromatograph (Thermo Scientific) coupled to a TSQ
Quantum Tandem mass spectrometer. GC separation
was performed on a 30 m Stabilwax (Restek Corporation) capillary column with an internal diameter of
0.25 mm and a film thickness of 0.25 μm with the conditions described in Fedrizzi et al. [55]. VOCs were identified by comparing the retention times of individual
peaks with the retention times of their reference standards, and by identifying the mass spectra using the
NIST library. The ratio of each VOC area to the d16-octanal internal standard area was considered to reduce
technical variability among extractions and chromatographic runs and VOCs quantity were expressed as
μg/kg of berry of d16-octanal equivalents.
Extractions and injections of the samples were performed in a random sequence and QC samples were
injected at the beginning of the sequence and every six
sample injections.
A list of the secondary metabolites analyzed in this
study is reported in Additional file 3: Table S3.
RNA extraction and RNA sequencing analysis
Samples collected at 41, 68, and 93 DAA were selected for transcriptome analyses. Three biological
replicates per treatment were considered. Total RNA
was extracted with the ‘Spectrum Plant total RNA’ kit
(Sigma-Aldrich) from 0.2 g of ground berries. The
quantity and quality of the RNA were determined
with a Caliper LabChip® GX (Perkin-Elmer).
Library preparation was performed using the TruSeq
RNA Sample Prep Kit v2.0 according to the manufacturer’s instructions (Illumina). Libraries were quantified
using a 2100 Bioanalyzer (Agilent Technologies). Multiplexed cDNA libraries were pooled in equimolar
amounts, and clonal clusters were generated using Cbot
(Illumina). Sequencing was performed with an Illumina
HiSeq 2000 platform (Illumina pipeline 1.8.2) at IGA
Technology Services (Udine, Italy).
An average of 28.9 M 50-nt single-end reads was generated per sample (Additional file 10: Table S4). Trimming
for quality and length, and filtering for mitochondria and
chloroplast contamination were performed by the ERNE
Page 14 of 17
package version 1.2 tool ERNE-FILTER [56]. The minimum PHRED score accepted for trimming was 20, and
reads shorter than 40 bp were discarded. Reads were
aligned against the reference grapevine genome PN40024
12x [16] using the software TopHat version 2.0.6 [57] with
default parameters. Aligned reads were counted with a
htseq-count (version 0.6.0) in intersection-non-empty
mode for overlap resolution [58]. Vitis vinifera annotation
GTF-file (V1) was downloaded from Ensembl Plants website. Differentially expressed (DE) genes (false discovery
rate less than 0.05) analysis was performed with the R
package DeSeq2 [59]. Functional annotations of genes
were retrieved from Grimplet et al. [60] and VitisCyc [61].
Gene ontology analyses were carried out for each sampling. Overrepresented genes categories were identified
with the BINGO app 3.0.2 of Cytoscape 3.1.1 [62]. PlantGoSlim categories, referred to biological processes, were
used to run the gene enrichment analysis using a hypergeometric test with a significance threshold of 0.05 after
Benjamini and Hochberg false discovery rate correction.
Quantitative real-time polymerase chain reaction
The validation of RNA-Seq data was carried out on a
set of DE genes using the quantitative real-time polymerase chain reaction (qPCR) technique. RNA was extracted from independent biological samples collected
at the same stage than the ones used for RNA-Seq analysis. The reverse transcription of RNA samples was
performed with the QuantiTect Reverse Transcription
Kit (Qiagen) and the Quantiscript Reverse Transcriptase (Qiagen). Specific primers for 15 selected genes were
designed with Primer3web version 4.0.0 (Additional file 11:
Table S5). qPCR reactions, conditions, and calculation of
relative expression values were carried out as in Falginella
et al. [63]. The annealing temperature was 58 °C for all primer pairs except the VviUbiquitin housekeeping gene pair,
which annealed at 56 °C. Correlation analysis based on the
Pearson Correlation Coefficient (PCC) was carried out between the RNA-seq normalized counts and qPCR relative
gene expression (Additional file 11: Table S5, Additional
file 12: Figure S6).
qPCR was also carried out to determine the level of expression of selected structural genes of the phenylpropanoid,
flavonoid, and terpenoid pathway at each sampling date.
Statistical, network, and promoter analyses
A one-way ANOVA was performed using JMP 7 (SAS Institute Inc.) to detect significant differences (P < 0.05) between irrigation treatments at each sampling point.
Heatmaps representing log2 fold change (log2FC) of metabolite concentrations between treatments (D/C) and
principal component analysis (PCA) on the metabolite
profiles and on the entire transcriptome dataset were constructed and performed, respectively, using R software.
Savoi et al. BMC Plant Biology (2016) 16:67
The metabolite correlation network was constructed for
each condition (C and D) using all 74 metabolite accumulation profiles separately. The PCC was used as an index
of similarity between any two variables (i.e. metabolites).
Correlation pairs were deemed statistically significant
when the |PCC| > 0.8 and P value < 0.001 (2,000 permutations). The Cytoscape software (version 3.1.1) [64] was
used for network visualization and analysis of network
properties such as the average node degree, clustering coefficient, and network density. Additionally, the two matrices (C and D) of metabolite and transcript datasets were
merged and used for the construction of a global
metabolite-transcript network focused on structural genes
of phenylpropanoid, flavonoid, carotenoid, fatty acid, and
terpenoid pathway. Selected networks were constructed
for three monoterpenes (linalool, nerol, and α-terpineol)
considering the top 100 correlating genes. All calculations
and permutation tests were performed in R using the
‘rsgcc’ package [65].
Promoter motif enrichment analysis was conducted as
described previously in Ma et al. [66]. A total of 29,839
grapevine promoter sequences (1 kb upstream of the 5′
UTR) based on the 12x grapevine genome assembly were
retrieved from Gramene v45 ( />Known cis-regulatory motifs of plants were retrieved from
PLACE [67]. Enrichment of motifs was validated using the
hypergeometric distribution test. Cis-regulatory motifs
were considered significantly enriched if the associated P
value was < 0.01 and at least 10 promoters were associated
with the given motif.
Availability of Data and Materials
All raw sequence reads have been deposited in NCBI Sequence Read Archive ( />The BioProject and SRA accession are PRJNA313234
and SRP070855, respectively.
Additional files
Additional file 1: Table S1. Comparison of the climatological data in
the season of the study (2012) with data of the 2000–2012 period.
(DOC 35 kb)
Additional file 2: Table S2. Effect of water deficit on crop production.
Yield per vine, clusters per vine, and cluster weight of fully irrigated (C,
controls) and deficit irrigated (D, water deficit) grapevines reported as the
average ± the standard error. Numbers in bold indicate significant
differences between treatments (P < 0.05) identified by one-way ANOVA
(n = 4). (DOC 29 kb)
Additional file 3: Table S3. List of phenolics, carotenoids, tocopherols
and free VOCs identified in the study. (DOC 88 kb)
Additional file 4: Figure S1. Principal component analysis (PCA) of the
berry secondary metabolite profile of 48 independent samples collected
from C and D vines at 27, 41, 54, 68, 82, and 93 DAA. Full and open
symbols identify C and D berries, respectively. (PNG 27 kb)
Additional file 5: Figure S2. Phenolic profiling. Trends of phenolic
concentrations in C and D berries during fruit development. (DOCX 358 kb)
Page 15 of 17
Additional file 6: Figure S3. Carotenoid and tocopherol profiling.
Trends of carotenoid and tocopherol concentrations in C and D
berries during fruit development. (DOCX 163 kb)
Additional file 7: Figure S4. VOC profiling. Trends of VOC
concentrations in C and D berries during fruit development. (DOCX 468 kb)
Additional file 8: Table S7. Network analysis metrics. Detailed
information concerning the various metabolite/transcript annotations,
correlation relationships (PCC), and statistical significance (empirical P value)
are depicted for the global (C and D) metabolite-metabolite network (A)
and metabolite-transcript network in C (B) and D (C). Frequency tables for
the significant metabolite-transcript correlations from (B) and (C) are
summarized in (D). Correlation values (PCC, statistical significance of
PCC, and correlation ranks) for the predicted monoterpene (linalool,
nerol, and α-terpineol)-transcript network reported in Fig. 8a (E). Contingency
tables containing enriched (P < 0.01) PLACE cis-regulatory elements
and associated information (e.g., motif description, occurrence of motif
within promoter regions) identified in the combined monoterpenetranscript network presented in Fig. 8a (F). (XLSX 91 kb)
Additional file 9: Figure S5. Carotenoid network. Network
representation of carotenoids in C (A) and D (B) berries during
development. Nodes represent ‘metabolites’ and edges represent
‘relationships’ between any two metabolites. Edges colored in red and
blue represent significant (P < 0.001) positive and negative correlations,
respectively. Metabolites in bold indicate a significant effect (P < 0.05) of
water deficit on the concentration of that metabolite at one or more
developmental stages. Number of correlating edges, average node
neighborhood, and clustering coefficient were similar between C and D
networks. (PNG 63 kb)
Additional file 10: Table S4. RNA sequencing analysis metrics.
Transcriptome analyses were performed in C and D berries at three
selected berry developmental stages (41 DAA, before ripening; 68 DAA,
beginning of ripening; 93 DAA, late ripening) using an Illumina HiSeq
platform. (DOC 54 kb)
Additional file 11: Table S5. List of genes assayed for expression by
qPCR. For each, the coefficient of correlation between RNA-Seq data and
qPCR data, the P value, forward and reverse primers used, and literature
references are shown. (DOC 38 kb)
Additional file 12: Figure S6. Scatterplot of the correlation between
the fold changes (log2(D/C)) in the expression levels of the 15 genes
reported in Additional file 11: Table S5 obtained by RNA-seq and qPCR
analyses. (TIF 1009 kb)
Additional file 13: Table S6. Differentially expressed genes. Summary
of differentially expressed genes (P < 0.05) and associated information
(12x V1 identification number, predicted annotation, fold change values,
and adjusted P value) identified between C and D at 41 (A), 68 (B), and
93 (C) days after anthesis (DAA). The ‘Venn’ column in A, B, C identifies
where each gene maps in the Venn diagram of Fig. 4. List of the genes
differentially expressed at all the developmental stages (D). Plant gene
ontology (GO) slim biological process categories enriched (P < 0.05)
within significantly up- and down-regulated genes at 41, 68, and 93 DAA
are represented as the relative (%) contribution of genes ascribed to that
biological process over the total DE genes at each developmental stage
(E). Level of expression of DE genes of the phenylpropanoid and flavonoid (F), carotenoid (G), and terpenoid (H) pathways at 41, 68, 93 DAA in C
and D berries. Red-blue color scale identifies high (red) and low (blue)
levels of expression. (XLSX 1175 kb)
Additional file 14: Figure S7. Target gene expression analysis. Impact
of water deficit on transcript abundance of selected genes of the
phenylpropanoid, flavonoid, and terpenoid pathway. Using qPCR, gene
expression was analyzed at each sampling time. Gene expression levels
analyzed with RNA-sequencing at 41, 68, and 93 DAA are reported in
inset graphs for comparison. Bars represent ± SE. Asterisks indicate
significant differences between treatments at P < 0.05 (*). (PNG
275 kb)
Additional file 15: Figure S8. Evolution of the relative skin and seed
masses expressed as % of berry fresh weight (FW) across development in
C and D berries. (TIF 1797 kb)
Savoi et al. BMC Plant Biology (2016) 16:67
Abbreviations
4CL: 4-coumarate-CoA ligase; ANR: anthocyanidin reductase; BCH: β-carotene
hydroxylase; C: control; C3H: p-coumaroyl shikimate 3'-hydroxylase;
C4H: trans-cinnamate 4-monooxygenase; CCD1: (5,6) (5′,6′) (9,10) (9′,10′)
cleavage dioxygenase; CCD4: (9,10) (9′,10′) cleavage dioxygenase;
CCoAMT: caffeoyl-CoA 3-O-methyltransferase; CHI: chalcone isomerase;
CHS: chalcone synthase; CISO: carotenoid isomerase; COMT: caffeic acid
3-O-metyltransferase; D: deficit irrigation; DAA: days after anthesis;
DE: differentially expressed; DFR: dihydroflavonol reductase; DVB-CARPDMS: divinylbenzene-carboxen-polydimethylsiloxane; DXR: 1-deoxy-Dxylulose-5-phosphate reductoisomerase; DXS: 1-deoxy-D-xylulose-5phosphate synthase; ETc.: crop evapotranspiration; F3′5′H: flavonoid-3′5′hydroxylase; F3H: flavanone-3-hydroxylase; FLS: flavonol synthase;
FW: fresh weight; GO: gene ontology; HCT: hydroxycinnamoyl-CoA:shikimate/
quinate hydroxycinnamoyltransferase; HPLC-DAD: high performance liquid
chromatography-diode array detector; HPT: homogentisate phytyl transferase;
HS-SPME-GC-MS: headspace-solid phase microextraction-gas chromatography–
mass spectrometry; LAR: leucoanthocyanidin reductase; LBCY: lycopene
β-cyclase; LDOX: leucoanthocyanidin dioxygenases; LECY: lycopene
ε-cyclase; LUT: carotene hydroxylase; MEP: 2C-methyl-D-erythritol-4phosphate; MVA: mevalonate; PAL: phenylalanine ammonia lyase;
PCA: principal component analysis; PCC: Pearson correlation coefficient;
PSY: phytoene synthase; QC: quality control; qPCR: quantitative PCR;
RNA-seq: RNA sequencing; STS: stilbene synthase; TPS: terpene synthase;
UFGT: UDP-glucose:flavonoid 3-O-glucosyltransferase; UHPLC-MS/
MS: ultra-high performance liquid chromatography-tandem mass spectrometer; VOCs: volatile organic compounds; Vvi: Vitis vinifera; ZDS: ζCarotene desaturase; ΨStem: stem water potential.
Competing interests
The authors declare that they have no competing interests.
Authors’ contributions
SS participated in the design of the study, carried out the metabolite
extractions and analyses, RNA extractions, and part of the transcriptome
data analyses, and drafted part of the manuscript; DCJW carried out the
network analysis and part of the transcriptome data analysis, and drafted
part of the manuscript; PA contributed to the metabolite extractions and
analyses; MM performed part of the transcriptome analysis; BB
performed the field experiment; EP coordinated the field experiments;
AF critically revised the manuscript; FM participated in the design of the
study, supervised the metabolite analysis, and critically revised the
manuscript; SDC conceived the study, coordinated the experiments,
supervised the field, transcriptome, and network analyses, interpreted the
results, and drafted part of the manuscript. All authors read and
approved the final manuscript.
Acknowledgement
This study was funded by the Italian Ministry of Agricultural and Forestry
Policies (VIGNETO); the Fondazione Edmund Mach (GMPF), the COST Action
FA1106 Quality Fruit, the University of British Columbia (10R18459), and
Natural Sciences and Engineering Research Council of Canada (10R23082).
We thank Georg Weingart for his contribution in the sample preparation for
metabolite extractions and Christopher J. Walkey for critically reading the
article.
Author details
1
Department of Food Quality and Nutrition, Research and Innovation Centre,
Fondazione Edmund Mach, Via E. Mach 1, 38010 San Michele all’Adige, Italy.
2
Dipartimento di Scienze Agro-alimentari, Ambientali e Animali, University of
Udine, Via delle Scienze 208, 33100 Udine, Italy. 3Wine Research Centre, The
University of British Columbia, 2205 East Mall, Vancouver, BC V6T 1Z4,
Canada. 4Istituto di Genomica Applicata, Parco Scientifco e Tecnologico Luigi
Danieli, via Jacopo Linussio 51, 33100 Udine, Italy. 5The Jacob Blaustein
Institutes for Desert Research, Ben-Gurion University of the Negev, Midreshet
Ben-Gurion, Israel.
Received: 11 December 2015 Accepted: 15 March 2016
Page 16 of 17
References
1. Hartmann T. From waste products to ecochemicals: Fifty years research of
plant secondary metabolism. Phytochemistry. 2007;68:2831–46.
2. Kliebenstein DJ. Secondary metabolites and plant/environment interactions:
A view through Arabidopsis thaliana tinged glasses. Plant Cell Environ. 2004;
27:675–84.
3. Klee HJ, Giovannoni JJ. Genetics and control of tomato fruit ripening and
quality attributes. Annu Rev Genet. 2011;45:41–59.
4. Lund ST, Bohlmann J. The molecular basis for wine grape quality–a volatile
subject. Science. 2006;311:804–5.
5. Ferrandino A, Lovisolo C. Abiotic stress effects on grapevine (Vitis vinifera L.):
Focus on abscisic acid-mediated consequences on secondary metabolism
and berry quality. Environ Exp Bot Elsevier BV. 2014;103:138–47.
6. Chaves MM, Zarrouk O, Francisco R, Costa JM, Santos T, Regalado AP, et al.
Grapevine under deficit irrigation: hints from physiological and molecular
data. Ann Bot. 2010;105:661–76.
7. Hannah L, Roehrdanz PR, Ikegami M, Shepard AV, Shaw MR, Tabor G,
et al. Climate change, wine, and conservation. Proc Natl Acad Sci. 2013;
110:6907–12.
8. Mattivi F, Guzzon R, Vrhovsek U, Stefanini M, Velasco R. Metabolite
profiling of grape: flavonols and anthocyanins. J Agric Food Chem.
2006;54:7692–702.
9. Degu A, Morcia C, Tumino G, Hochberg U, Toubiana D, Mattivi F, et al.
Metabolite profiling elucidates communalities and differences in the
polyphenol biosynthetic pathways of red and white Muscat genotypes.
Plant Physiol Biochem Elsevier Masson SAS. 2015;86:24–33.
10. Hochberg U, Degu A, Cramer GR, Rachmilevitch S, Fait A. Cultivar specific
metabolic changes in grapevines berry skins in relation to deficit irrigation
and hydraulic behavior. Plant Physiol Biochem Elsevier Masson SAS. 2015;88:
42–52.
11. Young PR, Lashbrooke JG, Alexandersson E, Jacobson D, Moser C, Velasco R,
et al. The genes and enzymes of the carotenoid metabolic pathway in Vitis
vinifera L. BMC Genomics. 2012;13:243.
12. Robinson AL, Boss PK, Solomon PS, Trengove RD, Heymann H, Ebeler SE.
Origins of grape and wine aroma. Part 1. Chemical components and
viticultural impacts. Am. J Enol Vitic. 2014;65:1–24.
13. Deluc LG, Quilici DR, Decendit A, Grimplet J, Wheatley MD, Schlauch KA, et
al. Water deficit alters differentially metabolic pathways affecting important
flavor and quality traits in grape berries of Cabernet Sauvignon and
Chardonnay. BMC Genomics. 2009;10:212.
14. Blanco-Ulate B, Amrine KCH, Collins TS, Rivero RM, Vicente AR, Morales-Cruz
A, et al. Developmental and metabolic plasticity of white-skinned grape
berries in response to Botrytis cinerea during noble rot. Plant Physiol. 2015;
169:2422–43.
15. Young P, Eyeghe-Bickong HA, du Plessis K, Alexandersson E, Jacobson DA,
Coetzee ZA, et al. Grapevine plasticity in response to an altered
microclimate: Sauvignon Blanc modulates specific metabolites in response
to increased berry exposure. Plant Physiol. 2015;170(3):1235–54.
16. Jaillon O, Aury J-M, Noel B, Policriti A, Clepet C, Casagrande A, et al. The
grapevine genome sequence suggests ancestral hexaploidization in major
angiosperm phyla. Nature. 2007;449:463–7.
17. Höll J, Vannozzi A, Czemmel S, D’Onofrio C, Walker AR, Rausch T, et al. The
R2R3-MYB transcription factors MYB14 and MYB15 regulate stilbene
biosynthesis in Vitis vinifera. Plant Cell. 2013;25:4135–49.
18. Vannozzi A, Dry IB, Fasoli M, Zenoni S, Lucchin M. Genome-wide analysis of
the grapevine stilbene synthase multigenic family: genomic organization
and expression profiles upon biotic and abiotic stresses. BMC Plant Biol.
2012;12:130.
19. Martin DM, Aubourg S, Schouwey MB, Daviet L, Schalk M, Toub O, et al.
Functional annotation, genome organization and phylogeny of the
grapevine (Vitis vinifera) terpene synthase gene family based on genome
assembly, flcdna cloning, and enzyme assays. BMC Plant Biol. 2010;10:226.
20. Castellarin SD. Matthews M a, Di Gaspero G, Gambetta GA. Water deficits
accelerate ripening and induce changes in gene expression regulating
flavonoid biosynthesis in grape berries. Planta. 2007;227:101–12.
21. Roby G, Matthews MA. Relative proportions of seed, skin and flesh, in ripe
berries from Cabernet Sauvignon grapevines grown in a vineyard either
well irrigated or under water deficit. Aust J Grape Wine Res. 2004;10:74–82.
22. Roby G, Harbertson JF, Adams DA, Matthews MA. Berry size and vine water
deficits as factors in winegrape composition: Anthocyanins and tannins.
Aust J Grape Wine Res. 2004;10:100–7.
Savoi et al. BMC Plant Biology (2016) 16:67
23. Bucchetti B, Matthews MA, Falginella L, Peterlunger E, Castellarin SD. Effect
of water deficit on Merlot grape tannins and anthocyanins across four
seasons. Sci Hortic. 2011;128:297–305.
24. Demmig B, Winter K, Krüger A, Czygan F-C. Zeaxanthin and the heat
dissipation of excess light energy in Nerium Oleander exposed to a
combination of high light and water stress. Plant Physiol. 1988;87:17–24.
25. Zhao Q, Wang G, Ji J, Jin C, Wu W, Zhao J. Over-expression of Arabidopsis
thaliana β-carotene hydroxylase (chyB) gene enhances drought tolerance in
transgenic tobacco. J Plant Biochem Biotechnol. 2013;23:190–8.
26. Munné-Bosch S, Schwarz K, Alegre L. Enhanced formation of α-Tocopherol
and highly oxidized abietane diterpenes in water-stressed rosemary plants.
Plant Physiol. 1999;121:1047–52.
27. Cela J, Chang C, Munné-Bosch S. Accumulation of γ-rather than α-tocopherol
alters ethylene signaling gene expression in the vte4 Mutant of Arabidopsis
thaliana. Plant Cell Physiol. 2011;52:1389–400.
28. Battilana J, Emanuelli F, Gambino G, Gribaudo I, Gasperi F, Boss PK,
et al. Functional effect of grapevine 1-deoxy-D-xylulose 5-phosphate
synthase substitution K284N on Muscat flavour formation. J Exp Bot.
2011;62:5497–508.
29. Selmar D, Kleinwächter M. Stress enhances the synthesis of secondary plant
products: The impact of stress-related over-reduction on the accumulation
of natural products. Plant Cell Physiol. 2013;54:817–26.
30. Alonso R, Berli FJ, Bottini R, Piccoli P. Acclimation mechanisms elicited by
sprayed abscisic acid, solar UV-B and water deficit in leaf tissues of fieldgrown grapevines. Plant Physiol Biochem. 2015;91:56–60.
31. Griesser M, Weingart G, Schoedl-Hummel K, Neumann N, Becker M, Varmuza K,
et al. Severe drought stress is affecting selected primary metabolites,
polyphenols, and volatile metabolites in grapevine leaves (Vitis vinifera cv.
Pinot noir). Plant Physiol. Biochem. Elsevier Masson SAS. 2015;88:17–26.
32. Ripoll J, Urban L, Staudt M, Lopez-Lauri F, Bidel LPR, Bertin N. Water
shortage and quality of fleshy fruits—making the most of the unavoidable.
J Exp Bot. 2014;65:4097–117.
33. Sánchez AM, Winterhalter P. Carotenoid cleavage products in saffron
(Crocus sativus L.). Carotenoid Cleavage Prod.. American Chemical Society;
2013; 45–63.
34. Stitt M, Sulpice R, Keurentjes J. Metabolic networks: how to identify key
components in the regulation of metabolism and growth. Plant Physiol.
2010;152:428–44.
35. Hochberg U, Degu A, Toubiana D, Gendler T, Nikoloski Z, Rachmilevitch S,
et al. Metabolite profiling and network analysis reveal coordinated changes
in grapevine water stress response. BMC Plant Biol. 2013;13:184.
36. Zamboni A, Di Carli M, Guzzo F, Stocchero M, Zenoni S, Ferrarini A, et al.
Identification of putative stage-specific grapevine berry biomarkers and
omics data integration into networks. Plant Physiol. 2010;154:1439–59.
37. Degu A, Hochberg U, Sikron N, Venturini L, Buson G, Ghan R, et al.
Metabolite and transcript profiling of berry skin during fruit development
elucidates differential regulation between Cabernet Sauvignon and Shiraz
cultivars at branching points in the polyphenol pathway. BMC Plant Biol.
2014;14:188.
38. Wong DC, Sweetman C, Drew DP, Ford CM. VTCdb: a gene co-expression
database for the crop species Vitis vinifera (grapevine). BMC Genomics.
2013;14:882.
39. Costantini L, Malacarne G, Lorenzi S, Troggio M, Mattivi F, Moser C, et al.
New candidate genes for the fine regulation of the colour of grapes. J Exp
Bot. 2015;66:4427–40.
40. Ma D-M, Wang Z, Wang L, Alejos-Gonzales F, Sun M-A, Xie D-Y. A Genomewide Scenario of Terpene Pathways in Self-pollinated Artemisia annua. Mol
Plant. 2015;8(11):1580–98. Elsevier Ltd.
41. Gómez-Plaza E, Mestre-Ortuño L, Ruiz-García Y, Fernández-Fernández JI,
López-Roca JM. Effect of benzothiadiazole and methyl jasmonate on the
volatile compound composition of monastrell grapes and wines. Am J Enol
Vitic. 2012;63(3):394–401.
42. Reeves PH, Ellis CM, Ploense SE, Wu M-F, Yadav V, Tholl D, et al. A regulatory
network for coordinated flower maturation. PLoS Genet. 2012;8:e1002506.
43. Carbonell-Bejerano P, Diago M-P, Martínez-Abaigar J, Martínez-Zapater JM,
Tardáguila J, Núñez-Olivera E. Solar ultraviolet radiation is necessary to
enhance grapevine fruit ripening transcriptional and phenolic responses.
BMC Plant Biol. 2014;14:183.
44. Gil M, Pontin M, Berli F, Bottini R, Piccoli P. Metabolism of terpenes in the
response of grape (Vitis vinifera L.) leaf tissues to UV-B radiation.
Phytochemistry. 2012;77:89–98.
Page 17 of 17
45. Reynolds AG, Wardle DA. Impact of various canopy manipulation
techniques on growth, yield, fruit composition, and wine quality of
Gewürztraminer. Am J Enol Vitic. 1989;40:121–9.
46. Castellarin SD, Pfeiffer A, Sivilotti P, Degan M, Peterlunger E, Di Gaspero G.
Transcriptional regulation of anthocyanin biosynthesis in ripening fruits of
grapevine under seasonal water deficit. Plant Cell Environ. 2007;30:1381–99.
47. Santos TP, Lopes CM, Rodrigues ML, de Souza CR, Ricardo-da-Silva JM,
Maroco JP, et al. Effects of partial root-zone drying irrigation on cluster
microclimate and fruit composition of field-grown Castelão grapevines.
VITIS - J Grapevine Res. 2005;44:117.
48. Gerdes SM, Winterhalter P, Ebeler SE. Effect of sunlight exposure on
norisoprenoid formation in white Riesling grapes. In Carotenoid-Deriv.
Aroma Compounds. P Winterhalter and R. Rouseff (eds) 262–272. ACS
Symp. Series 802. 2002.
49. Lee S-H, Seo M-J, Riu M, Cotta JP, Block DE, Dokoozlian NK, et al. Vine
Microclimate and norisoprenoid concentration in Cabernet sauvignon
grapes and wines. Am J Enol Vitic. 2007;58:291–301.
50. Skinkis PA, Bordelon BP, Butz EM. Effects of sunlight exposure on berry and
wine monoterpenes and sensory characteristics of Traminette. Am J Enol
Vitic. 2010;61:147–56.
51. Shinozaki K, Yamaguchi-Shinozaki K. Gene networks involved in drought
stress response and tolerance. J Exp Bot. 2007;58:221–7.
52. Herrera JC, Bucchetti B, Sabbatini P, Comuzzo P, Zulini L, Vecchione A, et al.
Effect of water deficit and severe shoot trimming on the composition of Vitis
vinifera L. Merlot grapes and wines. Aust J Grape Wine Res. 2015;21:254–65.
53. Vrhovsek U, Masuero D, Gasperotti M, Franceschi P, Caputi L, Viola R, et al.
A versatile targeted metabolomics method for the rapid quantification of
multiple classes of phenolics in fruits and beverages. J Agric Food Chem.
2012;60:8831–40.
54. Wehrens R, Carvalho E, Masuero D, De Juan A, Martens S. High-throughput
carotenoid profiling using multivariate curve resolution. Anal Bioanal Chem.
2013;405:5075–86.
55. Fedrizzi B, Carlin S, Franceschi P, Vrhovsek U, Wehrens R, Viola R, et al.
D-optimal design of an untargeted HS-SPME-GC-TOF metabolite profiling
method. The Analyst. 2012;137:3725.
56. Del Fabbro C, Scalabrin S, Morgante M, Giorgi FM. Evaluation of read
trimming effects on Illumina NGS data analysis. PLoS One. 2013;8:e85024.
57. Trapnell C, Roberts A, Goff L, Pertea G, Kim D, Kelley DR, et al. Differential
gene and transcript expression analysis of RNA-seq experiments with
TopHat and Cufflinks. Nat Protoc. 2012;7:562–78.
58. Anders S, Pyl PT, Huber W. HTSeq—a Python framework to work with highthroughput sequencing data. Bioinformatics. 2015;31:166–9.
59. Love MI, Huber W, Anders S. Moderated estimation of fold change and
dispersion for RNA-seq data with DESeq2. Genome Biol. 2014;15:550.
60. Grimplet J, Hemert JV, Carbonell-Bejerano P, Díaz-Riquelme J, Dickerson J,
Fennell A, et al. Comparative analysis of grapevine whole-genome gene
predictions, functional annotation, categorization and integration of the
predicted gene sequences. BMC Res Notes. 2012;5:213.
61. Naithani S, Raja R, Waddell EN, Elser J, Gouthu S, Deluc LG, et al. VitisCyc: a
metabolic pathway knowledgebase for grapevine (Vitis vinifera). Front Plant
Sci. 2014;5:1–11.
62. Maere S, Heymans K, Kuiper M. BiNGO: A Cytoscape plugin to assess
overrepresentation of Gene Ontology categories in Biological Networks.
Bioinformatics. 2005;21:3448–9.
63. Falginella L, Di Gaspero G, Castellarin SD. Expression of flavonoid genes in
the red grape berry of “Alicante Bouschet” varies with the histological
distribution of anthocyanins and their chemical composition. Planta. 2012;
236:1037–51.
64. Shannon P, Markiel A, Ozier O, Baliga NS, Wang JT, Ramage D, et al.
Cytoscape: a software environment for integrated models of biomolecular
interaction networks. Genome Res. 2003;13:2498–504.
65. Ma C, Wang X. Application of the gini correlation coefficient to infer
regulatory relationships in transcriptome analysis. Plant Physiol. 2012;160:
192–203.
66. Ma S, Shah S, Bohnert HJ, Snyder M, Dinesh-Kumar SP. Incorporating motif
analysis into gene co-expression networks reveals novel modular expression
pattern and new signaling pathways. PLoS Genet. 2013;9:e1003840.
67. Higo K, Ugawa Y, Iwamoto M, Korenaga T. Plant cis-acting regulatory DNA
elements (PLACE) database: 1999. Nucleic Acids Res. 1999;27(1):297–300.