Insights into the adaptive response of Arabidopsis thaliana to prolonged thermal stress by ribosomal profiling and RNA-Seq
Bạn đang xem bản rút gọn của tài liệu. Xem và tải ngay bản đầy đủ của tài liệu tại đây (1.75 MB, 13 trang )
Lukoszek et al. BMC Plant Biology (2016) 16:221
DOI 10.1186/s12870-016-0915-0
RESEARCH ARTICLE
Open Access
Insights into the adaptive response of
Arabidopsis thaliana to prolonged thermal
stress by ribosomal profiling and RNA-Seq
Radoslaw Lukoszek1,3, Peter Feist1 and Zoya Ignatova1,2*
Abstract
Background: Environmental stress puts organisms at risk and requires specific stress-tailored responses to maximize
survival. Long-term exposure to stress necessitates a global reprogramming of the cellular activities at different
levels of gene expression.
Results: Here, we use ribosome profiling and RNA sequencing to globally profile the adaptive response of
Arabidopsis thaliana to prolonged heat stress. To adapt to long heat exposure, the expression of many genes is
modulated in a coordinated manner at a transcriptional and translational level. However, a significant group of
genes opposes this trend and shows mainly translational regulation. Different secondary structure elements are
likely candidates to play a role in regulating translation of those genes.
Conclusions: Our data also uncover on how the subunit stoichiometry of multimeric protein complexes in plastids
is maintained upon heat exposure.
Keywords: Translation, Ribosome profiling, Transcription, RNA-Seq, Secondary structure, G-quadruplexes, Heat stress
response
Background
Environmental stress or suboptimal growth conditions
reduce cell viability and require an immediate but specific response in order to maximize the survival of the
whole organism. Particularly, plants are constantly exposed to changing environmental conditions and are
under threat of severe adverse conditions. On the subcellular level, heat exposure changes membrane fluidity
[1, 2] and protein stability [3, 4] which consequently
alter photosynthesis [5] and central metabolic activities
[6]. Plants are highly sensitive to temperature stress and
respond over different time scales [7–10]. One of the
most potent steps to regulate heat stress response has
been suggested to occur at the level of transcription
[11]. Long heat exposure triggers epigenetic changes,
some of which are conserved between yeast and plants
* Correspondence:
1
Biochemistry, Institute of Biochemistry and Biology, University of Potsdam,
Potsdam, Germany
2
Biochemistry and Molecular Biology, Department of Chemistry, University of
Hamburg, Hamburg, Germany
Full list of author information is available at the end of the article
indicating that these stress response mechanisms are
evolutionarily conserved among organisms [8]. Ultimately, proteins mediate stress response and their levels
have to be rapidly adjusted to ensure cell adaptability
and survival particularly under prolonged stress.
Gene expression is subject to extensive regulation, including transcription, mRNA degradation, translation
and protein degradation, each of which operates on a
different temporal regime [12–14]. Translation is a
downstream process of transcription and provides the
opportunity to rapidly adjust protein concentration in
response to external stimuli [15]. Although transcriptional reprogramming upon heat exposure has been addressed in plants, little is known for the role of
translation. Does translation complement transcription
in shaping the heat stress response?
Advances in massively parallel sequencing platforms
and approaches to capture ribosomal position with nucleotide resolution, i.e. ribosome profiling [16], precisely
capture gene expression at the level of translation. Combined with RNA-Seq to measure changes in mRNA
population [17], the transcriptional and translational
© 2016 The Author(s). Open Access This article is distributed under the terms of the Creative Commons Attribution 4.0
International License ( which permits unrestricted use, distribution, and
reproduction in any medium, provided you give appropriate credit to the original author(s) and the source, provide a link to
the Creative Commons license, and indicate if changes were made. The Creative Commons Public Domain Dedication waiver
( applies to the data made available in this article, unless otherwise stated.
Lukoszek et al. BMC Plant Biology (2016) 16:221
Page 2 of 13
responses can be deconvoluted. Ribosome profiling has
been successfully applied in mammalian systems, for example to study the effect of heat [18], oxidative [19] and
proteotoxic stress [20] on translation in mammalian systems. The depth of those approaches revealed unprecedented aspects in the stress response programs which
were not detected with a single sequencing method. The
applicability of ribosome profiling technology in plants
has been recently demonstrated by two studies assessing
the global expression reprogramming in A. thaliana during dark to light transition [21] and the response to hypoxia [22]. We used the combined approach of ribosome
profiling (Ribo-Seq) and RNA-Seq to assess the response
of A. thaliana to prolonged heat stress. Our study reveals
a complex picture of adaptive response in plants and provides a rich resource for future hypothesis testing.
Results
A subset of genes shapes the plant adaptation to thermal
stress
To monitor the adaptive reaction we exposed wild-type
A. thaliana plants (Columbia-0) to a prolonged heat of
3 h at 37 °C. To provide a high-resolution view of the
cellular programs that counteracts thermal stress at both
translational and transcriptional level, we isolated
ribosome-protected fragments (RPF) and total RNA
from leaves, and subjected both to deep sequencing. The
sequencing of the RPFs (Ribo-Seq) is informative on the
translational activities of the cell [16, 23] while the total
RNA sequencing (RNA-Seq) [17] reports on transcriptional activities. These were compared to untreated
plants growing at permissive ambient temperature
(Fig. 1a). RPFs were generated by nuclease digestion of
polysomes into monosomes with high reproducibility
between biological replicates (Additional file 1a, b). The
unambiguously mapped mRNA and RPF reads were
normalized by the total number of mapped reads (rpm)
or reads per kilobase per million of the total mapped
reads (rpkm). We spiked each RNA-Seq experiment with
external RNA-standards (Ambion) whose sequence did
not align anywhere in the plant genome; the spike-ins
were used to determine the detection limit (i.e. the
minimal rpkm) in each experiment. In both biological
replicates the detection limit in RNA-Seq and Ribo-Seq
was 2 rpkm. In general, the RPF density correlated well
with the mRNA reads density (Additional file 1c)
suggesting a coordination of transcriptional and translational programs at control temperature growth. Following heat stress, RPF and mRNA reads were still wellcorrelated overall, albeit slightly reduced compared to
the control growth conditions, and suggested that a
significant translation activity was presented by the heatexposed plants (Additional file 1d). The polysome
fraction, which comprises actively translating ribosomes,
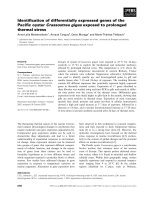
Fig. 1 The expression of a sizeable fraction of genes changes at
either transcriptional or translational level. a Scheme of the
experimental set-up. Each set (control and heat stress-treated plants)
comprises 15 plants. b Differential expression analysis using DESeq
with FDR of 0.1. Genes with changes in mRNA expression only are
designated in blue, those with RPF changes only (mRNA reads unchanged) in red and genes with simultaneous changes in both,
mRNA and RPF, are highlighted in green. The number of genes up(up) or down-regulated (down) in each group upon exposure to heat
are included. GO analysis (DAVID) of these gene groups is summarized in Additional file 4
is similar to that of the control plants and only marginally reduced in the fractions of heavy (>5) polysomes
(Additional file 1e, f ). Only a small increase of the
monosome peak was detected (Additional file 1e); an
increase of the monosome peak is usually observed
under acute stress [24]. Note that we could not resolve
the single ribosomal subunits (40S and 60S); 60S
appeared as a shoulder of the 80S or monosome, and
Lukoszek et al. BMC Plant Biology (2016) 16:221
thus we could not estimate the ribosomal drop-off (Additional file 1e). Also, the total RNA used in the polysomal profiles varied as it was normalized by the mass of
the used plant material and thus reflects the different
RNA content of the plants grown at various ambient
temperature.
Overall, for the majority of genes that are translationally
active under heat (i.e., for which RPFs were detected), we
found a positive linear log-log correlation with changes in
their mRNA reads (Additional file 1d) suggesting that the
adaptive response is shaped in a coordinated manner
between transcription and translation.
However, a sizeable fraction of genes differed in their
expression (i.e. exhibited disproportionate ratios of the
mRNA to RPF reads) (Additional file 2a, b). Those gene
groups may provide candidates whose expression is controlled either transcriptionally or translationally. Hence,
we used differential expression analysis (DESeq) to compare the mRNA and RPF counts of each gene expressed in
control plants grown under ambient temperature to that
in the plants exposed for 3 h to 37 °C (Fig. 1b). The
confidence intervals for the fold-change analysis were set
based on the reproducibility of the biological replicates for
the control plants (Additional file 1a, b). DESeq analysis
considers as expression level the sum of all RNA or RPF
reads over a transcript but is insensitive to the distribution
of reads along a transcript. If translation of a gene is
enhanced, we expect increased RPF reads along the entire
open-reading frame (ORF) length. We reasoned that if a
gene is uniformly translated with no detectable heatinduced stalling over certain position(s) within the CDS,
the counts of the RPF reads between the two halves of a
gene should be equal. Notably, RPFs were nearly symmetrically distributed between the two halves of a coding
sequence (CDS) of genes expressed under heat exposure
and resembled the uniform distribution between the two
halves of the mRNA (Additional file 2c, d), suggesting that
higher total RPF reads truly report on enhanced
expression of those genes under heat stress.
The DESeq analysis revealed co-directional changes in
the mRNA and RPF counts for 579 out of 14,246 genes
(525 upregulated and 54 downregulated; green designated, Fig. 1b). A sizeable fraction of genes showed only
changes in the mRNA (723 genes, blue designated,
Fig. 1b) or in RPF (1150 genes, red designated, Fig. 1b).
For each of the groups with altered RNA expression or
translatability (i.e., altered RPF reads), we performed
enrichment analysis using DAVID (Additional file 3).
The most prominent groups among those upregulated at
transcriptional and/or translational level (i.e. significantly
higher mRNA and/or RPF read counts) were genes
involved in the heat stress response and protein folding
(e.g. chaperones and heat-shock proteins). Interestingly,
although the plants were exposed to heat for 3 h, which
Page 3 of 13
should elicit the adaptive response to heat stress, the
mRNA of key heat shock proteins was very high
(Additional file 4a, b). In contrast, groups comprising
genes related to the chromatin structure, cytoskeleton
organization, cell wall synthesis, cell cycle, and anabolic
process were mostly down-regulated at transcriptional
and/or translational levels (Additional file 3). Together,
prolonged exposure to heat stress resulted in large
changes in gene expression and reprogramming of both
transcriptional and translational activities of the plants
that are likely to shape their survival under sub-optimal
growth conditions.
Genes with lower secondary structure propensity in 5′
start vicinity are translated under thermal stress
Next, we addressed whether the gene set that is preferentially translated under heat stress (red marked gene
groups, Fig. 1b) bears some common secondary structure
features to facilitate their translation. We calculated the
folding energy in the mRNA sequences flanking the translation initiation start of two groups of genes, e.g. with increased (translationally upregulated) and decreased
(translationally downregulated) ribosome density. Typically, the folding profiles of all mRNAs (Fig. 2a, black line)
exhibited reduced folding stability and fewer paired nucleotides in the 5′ UTRs compared to the coding sequence
(observed as a lower folding energy in the profile). For
translationally upregulated genes under heat, the folding
energy upstream of the start codon (up to 100 basepairs
(bp)) was significantly higher (Fig. 2a, red line) than that
of the remaining genes in the genome (Fig. 2a, black line)
and that of the translationally downregulated ones (Fig. 2a,
blue line). Further downstream of the start codon, along
the CDS, the folding energy relaxes to the mean folding
profile of all genes (Fig. 2a). The folding energy profile of
genes translationally downregulated under heat did not
differ from that of the remaining genes in the genome
(Fig. 2a, b). This implies that the response to heat stress in
plants at translational level is shaped, at least in part, by a
selection of a subset of genes with lower propensity to
form secondary structure upstream of the translation start.
Our attempt to verify the predicted folding patterns with
experimentally derived RNA secondary structure data [25,
26] was not successful. Both studies [25, 26] were conducted under normal growth conditions in which the heat
shock responsive genes show very low expression level,
hence the read coverage was insufficient to obtain reliable
secondary structure scores for those genes.
To address the question as to whether RNA-binding
proteins contribute to translational regulation through
binding the 5′ and 3′ UTRs, we performed a motif
search in the UTR sequences of the genes which were
translationally upregulated (i.e. changed RPF reads, but
unchanged mRNA reads) upon the heat stress. In total,
Lukoszek et al. BMC Plant Biology (2016) 16:221
Page 4 of 13
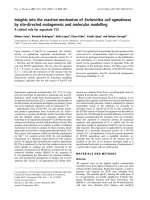
Fig. 2 Genes translationally upregulated under heat stress have much lower propensity to form secondary structure in the vicinity of the start
codon. a Average folding energy of translationally upregulated (red line) and downregulated (blue line) genes under heat stress compared to all
expressed protein-coding genes. Only in the marked area (inset) the curves shows significant difference (p = 2.2*10−16 (median averaged from a
two-sample Mann-Whitney test)). The thin lines in the same color denote the standard deviation for each position. Position 0 is the first nucleotide
of the start codon of each genes. b Box plot of the distribution of the folding energy of the genes translationally up- or down-regulated under
heat stress compared to all expressed genes. The region −100 nt upstream of the start till the start codon (position 0) is considered. c Sequence
motif analysis of 5′UTRs (left logo) and 3′ UTRs (right logo) of genes translationally upregulated under heat stress
55 genes (out of 895 heat upregulated) exhibited an
increased number of RPF in their 5′UTR and in 23 of
them we detected a conserved A/G-rich motif (Fig. 2c).
Similarly, in 82 genes the RPFs in their 3′ UTRs
increased upon stress and in 23 of them we also
detected the A/G-rich motif (Fig. 2d).
G2-quadruplexes in the UTRs may also control gene
expression under stress
We next analyzed each gene translationally upregulated
under heat stress (red and green marked gene groups,
Fig. 1b) for putative G-quadruplex structures in the
CDS, 5′UTR or 3′ UTR. This analysis was motivated by
a bioinformatic study which has identified more than
1200 quadruplexes with a G3-repeat sequence motif
and ∼ 43,000 with a G2-repeat sequence motif in plant
transcriptomes with yet unknown function [27]. The following sequences were considered in our search for G2 -
G2N1-7G2N1-7G2N1-7G2, for G3 - G3N1-7G3N1-7G3N1-7G3
and for G4 - G4N1-7G4N1-7G4N1-7G4. We found no G4
quadruplexes and only a few G3 quadruplexes in the 5′
and 3′ UTRs. However, we identified many G3 quadruplexes in the CDS (515 in total) and G2 in the 5′UTR
(975), CDS (17,845) and 3′UTR (1479), respectively. We
reasoned that if a G-quadruplex plays a role in heat
response and controls expression of distinct mRNAs upon
stress, we would observe different translation (i.e. differences in the RPF coverage) in the vicinity of a
quadruplex structure between plants exposed to heat
compared to the control plants. We compared the
read coverage 200-bp upstream and 250-bp downstream of the first base of each quadruplex. While we
observed no difference in the RPF coverage around
quadruplexes in the CDS (Additional file 5), the RPF
coverage around G2 quadruplexes in both 5′ and 3′
UTRs was clearly higher in the heat stress group
Lukoszek et al. BMC Plant Biology (2016) 16:221
(Fig. 3a, c). Intriguingly, in the genes upregulated
under heat stress (both up, green, and RPF up, red,
in Fig. 1b) the higher RPF coverage along the predicted G2 quadruplexes in the 5′UTR correlated with
their higher expression under heat than in the control
plants (Fig. 3a, b, d). This suggests that a direct
Fig. 3 (See legend on next page.)
Page 5 of 13
relationship might exist between the G2-quadruplexes
and translatability of the downstream CDS under heat
stress.
The effect of the G2 quadruplexes in the 3′UTRs of
genes upregulated under heat exposure is unclear; they
did not contribute to the stability of the mRNA under
Lukoszek et al. BMC Plant Biology (2016) 16:221
Page 6 of 13
(See figure on previous page.)
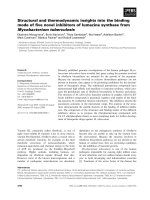
Fig. 3 The presence of G2 quadruplexes in the UTRs correlates with the expression of genes under heat stress. a, c Higher cumulative values of
the normalized RPF reads to the mRNA reads at each position under heat stress-exposed plants (red) compared to the control plants (blue) over
the positions of the putative G2 quadruplexes in the annotated 5′ UTRs (a) and 3′ UTRs (c). RPF coverage (rpm) was normalized to the mRNA
reads at each position and each gene in the set is equally weighted. The first nucleotide of the G2 quadruplexes is at position 200. p-values (on
the top of the plots) were calculated with the Wilcoxon signed rank test. b RPF fold change analysis of genes with G2 quadruplexes in their 5′
UTRs. Genes upregulated under thermal exposure (RPF up) were compared to genes with G2 quadruplexes but unchanged or downregulated
under stress (RPF 0/down). Only reads in the CDSs were considered in this analysis. n denotes the gene number in each group. d RPF coverage
profile of gene At3g56090 under heat stress exposure compared to its profile in the control plants. The position of the G2 quadruplex in the 5′
UTR is shadowed in gray. In the gene scheme over the profiles: black, CDS; gray, 5′ or 3′ UTRs; gray dashed line, introns. e Comparison of the reads
in the first vs. second halves of genes with G2 quadruplexes in their 3′ UTRs
heat stress, i.e. the mRNA reads for the two halves of a
gene remained unchanged under stress (Fig. 3e).
Detection of an alternative transcript and ORF upon
stress exposure
In our analysis of the RPF distributions between the first
and a second half of a gene we noticed an outlier,
At1g76880, with largely asymmetric distribution of the
reads in the second half upon exposure to heat. A closer
look in the read distributions revealed that in the control
plants, At1g76880, which encodes a double-helix repeat
protein, showed a relatively uniform mRNA coverage
over the main CDS, while RPFs accumulated starting at
nucleotide (nt) position 2195 (Fig. 4a, b). Upon induction of heat stress, the expression of this short 3′-terminal fragment starting at 2195 nt increased at both
transcriptional (i.e. increased mRNA reads) and translational level (i.e. increased RPF reads). In the vicinity of
the 2200 nt we detected an in-frame ATG which may
serve as a new translation start (dashed vertical line,
Fig. 4b). Although an alternative translation start of the
same mRNA transcript may plausibly explain the RPF
enhancement, it cannot explain the increase of the
mRNA reads. qRT-PCR analysis using primers targeting
the main and alternative transcript corroborated the
RNA-seq data and indicated specific upregulation of the
alternative transcript under heat stress (Fig. 4b). Moreover, only one splicing variant of At1g76880 is annotated
in the TAIR 10 data base. Furthermore, additional inframe AUG codons in the CDS (Fig. 4a) did not correlate with any increase of RPF reads at those corresponding positions (Fig. 4b).
Within the region 1 kb upstream of this alternative
ORF and of the heat shock responsive genes we performed a sequence motif search to extract putative
sequences that may serve as putative transcription
factors binding sites. Interestingly, we identified motifs
which share conserved features with motifs found in the
promoter regions of the known heat-stress responsive
genes (Fig. 4c) which were transcriptionally induced
upon heat stress in our data set. The presence of motif 2
bears significant resemblance to the heat shock promoter element AGAAnnTTCT recognized by heat
shock factors in Arabidopsis [28] supports the idea of
this alternative transcript being heat-responsive. This
alternative transcript with a start at 2195 nt encodes an
88 amino-acid long peptide/protein with high overrepresentation of positively charged amino acids; proteins
with overrepresented charged amino acids may play a
protective role under stress, e.g. scavenging reactive
oxygen species. Although it remains to be determined
whether the expression of this alternative transcript
generates a viable protein or peptide, our results underline the potential of Ribo-Seq in determining alternative
ORF or proteins resulting from alternative, independent
translation initiation which differ from the start of the
main transcript.
Stoichiometry of protein complexes in chloroplasts under
heat exposure
In the ribosome profiling experiment we did not select
only for cytoplasmic ribosomes, but extracted the total
fraction of the all ribosome-bound mRNAs, including
those of the chloroplasts. In each sequencing data set,
35–45 % of the total uniquely mapped RPFs were
mapped to the chloroplast genome. As the chloroplast
genome is relatively small −117 total genes including 87
protein-coding genes – the coverage in the ribosome
profiling is very good. The majority of the plastidencoded genes encode single subunits in large protein
complexes. Some of them are encoded in operons within
one polycistronic mRNA in a fashion similar to bacterial
operons [29] and are suggested to coordinate the expression of functionally related proteins. However, a large
fraction of genes encoding subunits of protein complexes do not reside within the same operon, raising the
question as to whether their translation maintains the
stoichiometry needed for the protein complexes. Thus,
we next analyzed the stoichiometry of protein complexes
using the total RPF reads per gene per unit length
(rpkm) as defined in [30]. The underlying assumption of
this analysis is that each ribosome (or here RPF) is producing a protein and the total protein production is determined as the average ribosome density over the CDS.
Although this measure is not perfect as it provides an
upper bound for protein levels [30] as it does not
Lukoszek et al. BMC Plant Biology (2016) 16:221
Page 7 of 13
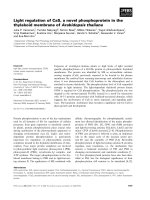
Fig. 4 Alternative transcript from the At1g76880 gene is highly expressed under heat stress. a Schematic of the putative ORFs of the At1g76880
gene. Black, CDS; gray, 5′ or 3′ UTRs; gray dashed line, intron, and arrow heads above the gene model: locations of the qRT-PCR primers. b In
addition to the main transcript, a transcript encoding 88-amino acids long peptide is detected in both ribosome profiling and RNA-Seq data sets
(plots on the left) as highly expressed at both transcriptional (mRNA reads, gray) and translational level (RPF reads, red) under heat stress. The
dashed vertical line denotes the start of this additional ORF. Note the different scale of the coverage profile in the heat vs. control condition.
qRT-PCR verification of the expression of the alternative transcript under stress (right panel) using primer pairs spanning the main and
alternative transcript designated in panel a (arrow heads). c Three distinct recurring motifs are present within 1 kb-region upstream of the
initiation of the alternative ORF (upstream 2100 nt) and multiple heat shock responsive genes as revealed by MEME motif analysis
Lukoszek et al. BMC Plant Biology (2016) 16:221
consider protein degradation and ribosomal drop-off
during synthesis, our measures of protein production
using this approach (Fig. 5a) agreed well with published
data on protein abundance in chloroplasts [31].
We next used this measure to evaluate the production
of stable multiprotein complexes with known stoichiometry (Fig. 5b and Additional file 6a). Remarkably, for the
ATP synthetase complex, which has the most complex
stoichiometry, the protein production of each subunit
quantitatively reflected its stoichiometry within the complex (Fig. 5b). The ribosome density of each ORF was
different despite comprising the same polycistronic
mRNA (atpA/E/I/H and atpB/F are the two operons,
Fig. 5c). The mRNA levels of these two operons were
similar as confirmed by RNA-Seq analysis, further validating that differences in the stoichiometry might be controlled at the level of translation. For some complexes,
which are encoded mostly on different polycistronic
mRNAs, the ratio of protein production of some subunits differed from their stoichiometry (Additional file 6)
and suggests an additional regulation mechanism at the
level of degradation.
The expression of protein-coding genes in chloroplasts
changed under heat exposure and for the majority of the
ORFs changes in mRNA levels were co-directional with
changes in transcription (i.e. mRNA reads) and translation (i.e. RPF reads) (Fig. 5d). Strikingly, the production
of the subunits within one protein complex changed disproportionately, even for those upregulated under heat
stress (Fig. 5e and Additional file 6b) which could suggests that the different susceptibility to degradation of
various subunits may additionally change the abundance
of the subunits under stress.
Discussion
Here we analyze the adaptive response of A. thaliana to
prolonged heat exposure (3 h at 37 °C) at both transcriptional and translational level using RNA-Seq and deep
sequencing of RPFs of nuclear- and chloroplast-encoded
genes. The plant habitat suggests that a typical heat exposure is long, for example for several hours in a summer midday. The expression changes of the majority of
nuclear-encoded genes are modulated in a coordinated
manner at the transcriptional and translational levels.
While at early time points of heat exposure, i.e. between
15 and 45 min, translation is globally downregulated and
stress response is counteracted mainly by transcriptional
programs [32–34], our results show that prolonged
exposure to stress (3 h) activates translational programs
which shape the adaptive response. At prolonged exposure to heat stress the majority of the genes are transcribed and translated in a coordinated fashion, but a
sizeable set of genes opposes this trend and instead
shows only changes at the level of translation. Among
Page 8 of 13
those translationally regulated transcripts we detected
several shared features which are likely candidates to
regulate their expression. The A/G-rich motifs in the 5′
or 3′ UTRs of the translationally upregulated genes resemble sequences identified as RNA-protein binding
motifs [26]. The presence of relatively conserved A/Grich motifs to which most likely the same RNA-binding
protein binds would allow coregulation of the expression
of those transcripts [26]. Another common feature
among the genes translationally upregulated under heat
stress is their lower propensity to form secondary structure, likely to facilitate ribosome binding and enhances
translation [35, 36]. Furthermore, some of the transcripts
preferentially translated under heat contain a putative
G2 quadruplex in their 5′UTR. The increased RPF reads
over the quadruplex structures correlate with the
enhanced expression in the downstream CDS, suggesting
a role in activating translation of the downstream ORF
with a yet unclear mechanism. This is in line with an
earlier observation that transcripts with highly structured 5′UTRs are enriched upon heat exposure [37].
Although the type of the secondary structure in the 5′
UTR is not specified [37], the authors suggest a mechanism to sense heat in a similar fashion to the riboswitches
in bacteria [38].
The duration of heat stress has different effects on
transcriptional and translational programs. The sequence
of response seems to follow a conserved pattern in microorganisms and mammalian systems. An initial reaction upon acute heat stress comprises global
translational downregulation [18, 20] and a quick transcriptional activation of heat-shock proteins [39]. This
first transcriptional burst is followed by an adaptive
response which includes reprogramming of many cellular activities with a prominent activation of the heatstress response, relating to protein folding and degradation, at both translational and transcriptional levels
[39]. Previous studies in A. thaliana addressing short
term (10–45 min) heat exposure provide evidence that
translation is greatly inhibited [33, 34, 40]. By contrast,
our data show that under prolonged heat exposure (3 h)
translation is fully active (the polysomal fraction is only
marginally changed, Additional file 1e), suggesting a
common pattern of stress response between A. thaliana,
mammalian cells and microorganisms. Despite the global
translational repression under short term heat stress,
some transcripts are selectively translated, which includes genes involved in transcriptional regulation, chromatin structure rearrangements, mRNA degradation,
salicylic acid-mediated signaling and protein phosphorylation are activated under short term heat exposure [9, 33, 34, 40]. In contrast, extended heat
stress (3 h) activates genes involved in heat-stress
response and protein folding and deactivates genes
Lukoszek et al. BMC Plant Biology (2016) 16:221
Page 9 of 13
Fig. 5 Impact of heat exposure on the expression of protein complexes in chloroplasts. a Correlation between protein production (RPF reads)
and protein abundance determined by mass spectrometry [31]. Spearman coefficient ρ = 0.746. b The protein production of ATP synthetase
subunits correlates with the assembled subunit stoichiometry. The genes belonging to each of the two operons are color-coded in blue and red.
c Coverage plots for each of the subunits of the ATP synthetase complex under control growth. Note that the y-axes are in uniform scale.
Schematic of the gene organization in the two operons is included over the plots. d Fold changes of RPF and mRNA of all chloroplast
ORFs. Each dot represents a single protein or protein subunit. e Heat exposure disproportionately reduces the production of ATP
synthetase subunits (compare with panel b)
Lukoszek et al. BMC Plant Biology (2016) 16:221
related to the chromatin structure, cytoskeleton
organization, cell wall synthesis, cell cycle, and anabolic processes. Strikingly, the most prominent gene
groups translated in both short term [34] and extended heat stress (Additional file 3) as also observed
for mammalian systems [39] suggesting a common
features in maintaining heat stress among organisms.
Translation in chloroplasts shares many features with
bacteria, including Shine-Dalgarno-driven initiation and
polycistronic mRNAs. The prevalence of genes encoded
in polycistronic transcripts in prokaryotes has been
suggested as a mechanism to couple translation and
control the stoichiometry of the single subunits in multisubunit complexes or to control the level of proteins
with related functions in metabolic pathways [29].
Although the premise might be true for some examples,
it does not explain how a higher number of subunit copies can be achieved downstream in the operon (the example with ATP synthetase, Fig. 5c). Furthermore, in
bacteria translation rates among genes within the same
operon are only weakly correlated [41] and the architecture of several metabolic pathways is robust against
variations in the single proteins, suggesting that a precise
translational coupling may not be crucial for their
performance [42, 43]. In plastids of A. thaliana, we
detected a clearly decoupled translation of single genes
within an operon; each single ORF within one polycistronic message is initiated in an independent manner
with distinct yield (the example with ATP synthetase,
Fig. 5c). Similar observation has been made in plastids of
maize [44] and in bacteria [30]. Rather than coupling of
their translation, the differential synthesis rates within
one message [45, 46] and/or degradation rates of the
subunits [30] determine the precision to achieve the balanced stoichiometry of subunits. Under thermal stress,
we observed variations in the translation rates of single
subunits (Fig. 5e and Additional file 6) which lead to
alterations in the production of the single subunits that
deviated from the expected stoichiometry. Translation
rates may change disproportionately because of
temperature-dependent variations in the diffusion properties of the different translation components [47]. Precise control of the stoichiometry of protein complexes at
elevated temperatures could also be established by
differential degradation of the subunits at elevated
growth temperatures [48–51].
Conclusions
In summary, our data unravel new aspects in the adaptive response of A. thaliana to heat stress at the level of
translation. The adaptation to heat exposure is finetuned by a sizeable set of genes whose translation is
most likely regulated by different secondary structure
elements. Furthermore, the Ribo-Seq and RNA-Seq data
Page 10 of 13
provide a vast resource of the Arabidopsis transcriptome
and translatome at permissive temperature (i.e. control
growth conditions) and under heat stress that can inform future experiments focused on understanding transcriptional and translational regulation of nuclear and
plastid-encoded genes.
Methods
Plant growth and heat treatment
Wild-type Col-0 plants (The European Arabidopsis stock
center NASC, ID N1092) were grown on soil in a greenhouse in a long-day condition (16 h/8 h, lamps Philips
Master HPI-T Plus, 400 Watt Philips SON-T Agro, 400
Watt, light intensity ~140 μmol.m−2.s−1, humidity 60 %).
The leaves from 15 pre-bolting, 3-week-old plants (stage
3.50 according to [52]) were exposed for 3 h at 37 °C
with constant humidity of 60 % (heat stress; [7]), or at
22 °C and served as control. The choice of the duration
of the thermal stress was also driven by the availability
of data from a previous study addressing transcriptional
changes using microarray technology [7]. Plants were
pooled, leaves harvested and immediately frozen in liquid nitrogen and stored for further treatment. The total
RNA was extracted using TRIzol reagent (Invitrogen),
cDNA was synthesized with random hexamers and
RevertAid™ H Minus First-Strand cDNA Synthesis Kit (Fermentas) and analyzed with qRT-PCR using Power SYBR
Green Master Mix (Life Technologies) and with the following primer pairs: for HSP70 (At3g12580) 5′CCGTCTTCGATGCTAAGCGTCT-3′ and 5′-AACCACAATCATAGGCTTCTCACC-3′; HSP101 (At1g74310)
5′-ATGACCCGGTGTATGGTGCTAG-3′ and 5′-CGCC
TGCATCTATGTAAACAGTG-3′; HSFA2 (At2g26150)
5′-TCGTCAGCTCAATACTTATGGATTC-3′ and 5′-CA
CATGACATCCCAGATCCTTGC-3′; UBQ10: 5′-AAAGAGATAACAGGAACGGAAACATAGT-3′ and 5′-GG
CCTTGTATAATCCCTGATGAATAAG-3′;
At1g76880
main transcript 5′-ACGATGATGCAACTGGGTGGTG3′ and 5′-AGCAGTTGTGACGGTTGTAGCC-3′; At1g7
6880 alternative transcript 5′-TCGGAGCAGAACTTTGATGATGA-3′ and 5′-GCTCGAACTCACCTCCTTC
CTC-3′.
Polysome profiling
Polysomes were isolated according to [53] with some
modifications. Briefly, 10 g of leaf material was thawed
in polysome extraction buffer (0.2 M Tris pH 7.4, 0.2 M
KCl, 0.025 M EGTA, 0.035 M MgCl2, 1 % Brij-35, 1 %
Triton X-100, 1 % Igepal CA 630, 1 % Tween 20, 1 %
DOC, 1 % PTE, 5 mM DTT, 1 mM AEBSF, 100 μg/mL
cyclohexamide, 100 μg/mL chloramphenicol), homogenized using a glass homogenizer, filtered through four
layers of sterile cheese cloth and two layers of sterile
Miracloth (Calbiochem) and incubated on ice for
Lukoszek et al. BMC Plant Biology (2016) 16:221
Page 11 of 13
10 min. The supernatant after centrifugation (4 °C,
16,000xg for 15 min) was additionally filtered through
Miracloth and transferred onto a sucrose cushion solution (0.4 M Tris pH 7.4, 0.2 M KCl, 0.005 M EGTA,
0.035 M MgCl2, 1.75 M sucrose, 5 mM DTT, 100 μg/mL
cyclohexamide, 100 μg/mL chloramphenicol) and centrifuged at 4 °C, 170,000xg for 3 h. The ribosomecontaining pellet was gently resuspended in ice-cold
resuspension buffer (0.2 M Tris pH 7.4, 0.2 M KCl,
0.025 M EGTA, 0.035 M MgCl2, 5 mM DTT, 100 μg/mL
cyclohexamide, 100 μg/mL chloramphenicol) and applied
onto 15 – 60 % sucrose gradient (0.04 M Tris pH 7.4,
0.02 M KCl, 0.01 M MgCl2, 100 μg/mL cyclohexemide,
100 μg/mL chloramphenicol) and centrifuged at 4 °C,
237,000xg for 1.5 h.
Mapping of the sequences and reads distribution analysis
Preparation of RPF and total mRNA libraries
Differential expression and enrichment analysis
Purified polysomes were digested with RNAse I (1.5U/
1OD/1 μl) at 22 °C for 10 min, loaded directly onto 15–
60 % sucrose gradient and centrifuged at 4 °C, 237,000xg
for 1.5 h. The amount of loaded sample was normalized
according to the input material, hence the variations in
the samples mirror the different RNA content of each
sample. The monosome fraction was concentrated with
an Amicon-Ultra4 Centrifugal Unit (MWL 100 kDa) and
RPFs were released by adding the release buffer (20 mM
HEPES-KOH pH 7.4, 100 mM KCl, 1 mM EDTA, 2 mM
DTT, 2 μl/ml Ribolock) and incubated for 10 min on ice
and centrifuged at 4 °C, 1900xg for 30 min. RNA was
extracted using the hot acid phenol method and depleted
of rRNA using RiboMinus Plant Kit (Ambion). Samples
were normalized on the input material.
Total RNA was extracted using TRIzol reagent and
spiked with ERCC RNA Spike-In Mix (Ambion). rRNA
was depleted using RiboMinus Plant Kit (Ambion), and
randomly fragmented by alkaline lysis in alkaline fragmentation solution (2 mM EDTA, 12 mM Na2CO3,
87 mM NaHCO3) at 95 °C for 40 min. The randomly
fragmented RNA was recovered by precipitation in the
presence of glycogen.
The sequencing libraries were prepared according to
[16]. Briefly, both randomly fragmented total RNA and
RPF were loaded onto a 15 % TBE-polyacrylamide gel
(containing 8 M urea). RNA fragments with a size of
25–35 nucleotides, which size corresponds to a nucleotide sequence covered by the ribosomes [16], were cut
out of the gel and isolated by centrifugation at 17,000xg
for 5 min to crush the gel, eluted by incubating with
3 M Na acetate buffer (pH 5.5) containing glycogen and
RiboLock (Thermo Fischer Scientific) for 4 h at 4 °C and
purified by precipitation with isopropanol. To those
fragments 5′ and 3′ adaptors were ligated and subjected
to deep sequencing on the Illumina Hiseq2000 platform.
Mapped read counts were applied to protein coding
transcripts using the longest annotated transcript for
each AGI identifier. The detection limit (2 rpkm) in each
experiment was determined from the linear range of detection of the Spike-In Mix and the selected reliably
expressed transcripts were subjected to differential
expression analysis by means of DESeq (version 1.16.0;
[54]) using a false discovery rate of 0.1. Enrichment analyses were performed using DAVID [55, 56].
The sequencing data was mapped against the TAIR 10
annotated A. thaliana genome (downloaded from
ENSEMBL, version 21) using Bowtie 1.0.0. Perfectly
mapped reads (i.e., without any mismatch) to an rRNA
reference were discarded after the first mapping round.
The remaining reads were the mapped to the genome,
the parameters were adjusted according to the properties
of very short reads (-v 2 -m 1 –strata –best -y) and only
uniquely mapped reads were kept for further analysis.
The number of raw reads unambiguously aligned to ORFs
in both RNA-Seq and ribosome profiling data sets from
two biological replicates were used to generate gene read
counts, which were normalized as reads per million of the
total mapped reads (rpm) or reads per kilobase per million
of the total mapped reads (rpkm) [17].
Secondary structure analysis, motif search and analysis
for putative G-quadruplex structures
Secondary structure of the 5′ UTRs and coding mRNAs
was computed with RNAfold program (2.1.7; default
parameters) from the ViennaRNA Package 2.0 [57] using
a sliding window of 39 nt and assigning the minimal free
energy to the middle nucleotide [35]. Average profiles
for different gene groups were generated by taking the
mean of their per-base folding energy contributions.
To identify conserved motifs in the sequences, we
used MEME version 4.10.0_4 (available online at http://
meme-suite.org/tools/meme). The parameters were set
as motif minimal width of 6, motif maximal width of 20,
maximal numbers of motifs 10 and ‘zero or one per
sequence’.
The position of potential G-quadruplexes were predicted using custom R-scripts which analyzed the sequences for presence of G2-, G3- and G4-quadruplexes
sequences matching the pattern G2N1-7G2N1-7G2N1-7G2,
G3N1-7G3N1-7G3N1-7G3 and G4N1-7G4N1-7G4N1-7G4,
respectively.
Analysis of the protein production in chloroplasts
Protein production was determined using only the
normalized RPF reads in the CDS normalized to the
mRNA reads as described by Li et al. [30]. The protein
Lukoszek et al. BMC Plant Biology (2016) 16:221
abundance data we obtained were compared with the
protein production in chloroplasts determined with mass
spectrometry by Baginsky and colleagues [31]. The data
from the two measurements [31] were averaged and only
proteins present in both were used.
Additional files
Additional file 1: Correlation of the sequencing data. (a, b) Correlation
of the mRNA (a) and RPF (b) read counts. Only genes over the detection
limit, determined by the spike-ins, in both Ribo-Seq and RNA-Seq are included. r, Pearson correlation coefficients. (c, d) Correlation of the normalized RPF and randomly fragmented mRNA counts for each gene from
control plants (c) or plants subjected to heat stress (d). r, Pearson correlation coefficients. (e) Polysomal profiles of plants grown at permissive
ambient temperature (blue) and upon exposure to heat stress for 3 h
(red). Total RNA loaded on the gradients was normalized according to
the mass of the material used for polysome purification. The profiles
changed marginally for stress-exposed plants: the polysome fraction
slightly decreased under stress with no increase of the monosomes suggesting fully functional translation. r, Person correlation coefficient. (f) Different groups of RNAs were detected in the samples. As expected, in the
RPF samples around 90 % of the reads were mapped to protein-coding
genes. Protein-coding genes were also feature to which the most RNA
reads from the Ribo-Seq were mapped. In both types of samples, tRNA
was the second most abundant group, reaching roughly 10 % in the RPF
samples and 40 % in the RNA samples. (PDF 1414 kb)
Additional file 2: Comparison of transcriptional and translational
features of all protein-coding genes between control plants and those exposed to thermal stress. (a, b) Correlation of the normalized RPF (a) and
randomly fragmented mRNA reads (b) for each gene from control plants
or plants subjected to heat stress. (c, d) Symmetric distribution of the
mRNA (black) and RPF (red) reads between the first and second halves of
the CDS of each transcript for control (c) and heat stress (d). r, Pearson
correlation coefficients. (PDF 1414 kb)
Additional file 3: GO term analysis of the genes translationally and
transcriptionally altered upon heat exposure for the genes groups for
which changes with DESeq were detected (Fig. 1b). Cluster enrichment
score represents the overall enrichment for a group in the input lists of
terms and thus is informative of the most frequent GO terms. The
horizontal lines mark the clusters. (PDF 1414 kb)
Additional file 4: The mRNA levels of marker stress-related genes are upregulated under thermal stress. (a) Quantification of mRNA expression of
marker genes upregulated by heat by means of qRT-PCR (white bars; mean
± SEM, n = 3). For comparison the mRNA expression in our RNA-Seq data
set (gray bars) and microarray data (dark gray bars; [7]) is given. In all three
representations, the mRNA expression values are presented as a fold change
(log2) compared to the control plants. In qRT-PCR data the mRNA
expression values were normalized to the expression of housekeeping gene
UBQ10. (b) mRNA (gray) and RPF (red) coverage profiles of the stress marker
genes under control and thermal stress conditions. The schematic of each
gene is included; exons are designated in black. (PDF 1414 kb)
Additional file 5: The expression level of genes with G2 and G3
quadruplexes in the CDS do not change upon stress exposure. (a, b) The
expression level in the vicinity of the putative G2 (a) or G3 (b)
quadruplexes in the CDS is not changed between heat stress-exposed
(red) and the control plants (blue). RPF coverage (rpm) was normalized to
the mRNA reads at each position and each gene in the set is equally
weighted. The first nucleotide of the G2 quadruplexes is at position 200.
p-values on the top of the plots were calculated with Wilcoxon signed
rank sum test. (PDF 1414 kb)
Additional file 6: Heat stress-induced changes in the production of protein
subunits of the plastid protein complexes. (a, b) Expression level and
stoichiometry of the subunits in various chloroplast-encoded protein
complexes in control plants (a) and in plants exposed to heat stress (b). Genes
encoded within one operon are shown in the same color. (PDF 1414 kb)
Page 12 of 13
Abbreviations
bp: Basepairs; CDS: Coding sequence; nt: Nucleotide; ORF: Open-reading
frame; RPF: Ribosome-protected fragments
Acknowledgements
We thank A. Bartholomäus for the help with some of the statistical analysis.
Funding
This work was supported by the grants of the Deutsche
Forschungsgemeinschaft (to ZI).
Availability of data and materials
The data sets supporting the findings in this article are included within the
article and its additional files. The sequencing data are deposited in the
Gene Express Omnibus (GEO: GSE69802) database.
Authors’ contributions
RL and ZI conceived and designed the experiments. RL performed
experiments. RL, PF and ZI analysed and interpreted the data. RL and ZI
wrote the manuscript. All authors read and approved the manuscript.
Competing interests
The authors declare that they have no competing interests.
Consent for publication
Not applicable.
Ethics approval and consent to participate
Not applicable.
Author details
1
Biochemistry, Institute of Biochemistry and Biology, University of Potsdam,
Potsdam, Germany. 2Biochemistry and Molecular Biology, Department of
Chemistry, University of Hamburg, Hamburg, Germany. 3Present Address:
Division of Plant Sciences/Centre for Gene Regulation and Expression, School
of Life Sciences, University of Dundee, Dow Street, Dundee DD1 5EH, UK.
Received: 17 May 2016 Accepted: 5 October 2016
References
1. Konigshofer H, Tromballa HW, Loppert HG. Early events in signalling hightemperature stress in tobacco BY2 cells involve alterations in membrane
fluidity and enhanced hydrogen peroxide production. Plant Cell Environ.
2008;31:1771–80.
2. Saidi Y, Domini M, Choy F, Zryd JP, Schwitzguebel JP, Goloubinoff P.
Activation of the heat shock response in plants by chlorophenols:
transgenic Physcomitrella patens as a sensitive biosensor for organic
pollutants. Plant Cell Environ. 2007;30:753–63.
3. Moreno AA, Orellana A. The physiological role of the unfolded protein
response in plants. Biol Res. 2011;44:75–80.
4. Pastore A, Martin SR, Politou A, Kondapalli KC, Stemmler T, Temussi PA.
Unbiased cold denaturation: low- and high-temperature unfolding of yeast
frataxin under physiological conditions. J Am Chem Soc. 2007;129:5374–5.
5. Wise RR, Olson AJ, Schrader SM, Sharkey TD. Electron transport is the
functional limitation in the photosynthesis of field-grown Pima cotton
plants at high temperature. Plant Cell Environ. 2004;27:717–24.
6. Ruelland E, Zachowski A. How plants sense temperature. Environ Exp Bot.
2010;69:225–32.
7. Kilian J, Whitehead D, Horak J, Wanke D, Weinl S, Batistic O, D’Angelo C,
Bornberg-Bauer E, Kudla J, Harter K. The AtGenExpress global stress
expression data set: protocols, evaluation and model data analysis of UV-B
light, drought and cold stress responses. Plant J. 2007;50:347–63.
8. Kumar SV, Wigge PA. H2A.Z-containing nucleosomes mediate the
thermosensory response in Arabidopsis. Cell. 2010;140:136–47.
9. Pecinka A, Dinh HQ, Baubec T, Rosa M, Lettner N, Mittelsten Scheid O.
Epigenetic regulation of repetitive elements is attenuated by prolonged
heat stress in Arabidopsis. Plant Cell. 2010;22:3118–29.
10. Swindell WR, Huebner M, Weber AP. Transcriptional profiling of Arabidopsis
heat shock proteins and transcription factors reveals extensive overlap
Lukoszek et al. BMC Plant Biology (2016) 16:221
11.
12.
13.
14.
15.
16.
17.
18.
19.
20.
21.
22.
23.
24.
25.
26.
27.
28.
29.
30.
31.
32.
33.
between heat and non-heat stress response pathways. BMC Genomics.
2007;8:125.
Wang Z, Gerstein M, Snyder M. RNA-Seq: a revolutionary tool for
transcriptomics. Nat Rev Genet. 2009;10:57–63.
Belasco JG. All things must pass: contrasts and commonalities in eukaryotic
and bacterial mRNA decay. Nat Rev Mol Cell Biol. 2010;11:467–78.
Komili S, Silver PA. Coupling and coordination in gene expression processes:
a systems biology view. Nat Rev Genet. 2008;9:38–48.
Vogel C, Marcotte EM. Insights into the regulation of protein abundance from
proteomic and transcriptomic analyses. Nat Rev Genet. 2012;13:227–32.
de Nadal E, Ammerer G, Posas F. Controlling gene expression in response
to stress. Nat Rev Genet. 2011;12:833–45.
Ingolia NT, Ghaemmaghami S, Newman JR, Weissman JS. Genome-wide
analysis in vivo of translation with nucleotide resolution using ribosome
profiling. Science. 2009;324:218–23.
Mortazavi A, Williams BA, McCue K, Schaeffer L, Wold B. Mapping and
quantifying mammalian transcriptomes by RNA-Seq. Nat Methods. 2008;5:
621–8.
Shalgi R, Hurt JA, Krykbaeva I, Taipale M, Lindquist S, Burge CB. Widespread
regulation of translation by elongation pausing in heat shock. Mol Cell.
2013;49:439–52.
Gerashchenko MV, Lobanov AV, Gladyshev VN. Genome-wide ribosome
profiling reveals complex translational regulation in response to oxidative
stress. Proc Natl Acad Sci U S A. 2012;109:17394–9.
Liu B, Han Y, Qian SB. Cotranslational response to proteotoxic stress by
elongation pausing of ribosomes. Mol Cell. 2013;49:453–63.
Liu MJ, Wu SH, Wu JF, Lin WD, Wu YC, Tsai TY, Tsai HL, Wu SH. Translational
landscape of photomorphogenic Arabidopsis. Plant Cell. 2013;25:3699–710.
Juntawong P, Girke T, Bazin J, Bailey-Serres J. Translational dynamics
revealed by genome-wide profiling of ribosome footprints in Arabidopsis.
Proc Natl Acad Sci U S A. 2014;111:E203–12.
Guo H, Ingolia NT, Weissman JS, Bartel DP. Mammalian microRNAs
predominantly act to decrease target mRNA levels. Nature. 2010;466:835–40.
Zhang G, Fedyunin I, Miekley O, Valleriani A, Moura A, Ignatova Z. Global
and local depletion of ternary complex limits translational elongation.
Nucleic Acids Res. 2010;38:4778–87.
Ding Y, Tang Y, Kwok CK, Zhang Y, Bevilacqua PC, Assmann SM. In vivo
genome-wide profiling of RNA secondary structure reveals novel regulatory
features. Nature. 2014;505:696–700.
Gosai SJ, Foley SW, Wang D, Silverman IM, Selamoglu N, Nelson AD,
Beilstein MA, Daldal F, Deal RB, Gregory BD. Global analysis of the RNAprotein interaction and RNA secondary structure landscapes of the
Arabidopsis nucleus. Mol Cell. 2015;57:376–88.
Mullen MA, Olson KJ, Dallaire P, Major F, Assmann SM, Bevilacqua PC. RNA
G-Quadruplexes in the model plant species Arabidopsis thaliana: prevalence
and possible functional roles. Nucleic Acids Res. 2010;38:8149–63.
Schramm F, Ganguli A, Kiehlmann E, Englich G, Walch D, von Koskull-Doring
P. The heat stress transcription factor HsfA2 serves as a regulatory amplifier
of a subset of genes in the heat stress response in Arabidopsis. Plant Mol
Biol. 2006;60:759–72.
Jackson RJ, Kaminski A, Pöyry TAA. Coupled termination-reinitiation events
in mRNA translation. In: Matthews MB, Sonenberg N, Hurshey JWB, editors.
Translational control in biology and medicine. New York: Cold Spring
Harbor Laboratory Press; 2007. p. 197–223.
Li GW, Burkhardt D, Gross C, Weissman JS. Quantifying absolute protein
synthesis rates reveals principles underlying allocation of cellular resources.
Cell. 2014;157:624–35.
Bischof S, Baerenfaller K, Wildhaber T, Troesch R, Vidi PA, Roschitzki B,
Hirsch-Hoffmann M, Hennig L, Kessler F, Gruissem W, et al. Plastid proteome
assembly without Toc159: photosynthetic protein import and accumulation
of N-acetylated plastid precursor proteins. Plant Cell. 2011;23:3911–28.
Merret R, Descombin J, Juan YT, Favory JJ, Carpentier MC, Chaparro C,
Charng YY, Deragon JM, Bousquet-Antonelli C. XRN4 and LARP1 are
required for a heat-triggered mRNA decay pathway involved in plant
acclimation and survival during thermal stress. Cell Rep. 2013;5:1279–93.
Merret R, Nagarajan VK, Carpentier MC, Park S, Favory JJ, Descombin J, Picart
C, Charng YY, Green PJ, Deragon JM, et al. Heat-induced ribosome pausing
triggers mRNA co-translational decay in Arabidopsis thaliana. Nucleic Acids
Res. 2015;43:4121–32.
Page 13 of 13
34. Yanguez E, Castro-Sanz AB, Fernandez-Bautista N, Oliveros JC, Castellano
MM. Analysis of genome-wide changes in the translatome of Arabidopsis
seedlings subjected to heat stress. PLoS One. 2013;8:e71425.
35. Bentele K, Saffert P, Rauscher R, Ignatova Z, Bluthgen N. Efficient translation
initiation dictates codon usage at gene start. Mol Syst Biol. 2013;9:675.
36. Goodman DB, Church GM, Kosuri S. Causes and effects of N-terminal codon
bias in bacterial genes. Science. 2013;342:475–9.
37. Vandivier L, Li F, Zheng Q, Willmann M, Chen Y, Gregory B. Arabidopsis
mRNA secondary structure correlates with protein function and domains.
Plant Signal Behav. 2013;8:e24301.
38. Lai EC. RNA sensors and riboswitches: self-regulating messages. Curr Biol.
2003;13:R285–91.
39. Richter K, Haslbeck M, Buchner J. The heat shock response: life on the verge
of death. Mol Cell. 2010;40:253–66.
40. Matsuura H, Ishibashi Y, Shinmyo A, Kanaya S, Kato K. Genome-wide
analyses of early translational responses to elevated temperature and high
salinity in Arabidopsis thaliana. Plant Cell Physiol. 2010;51:448–62.
41. Oh E, Becker AH, Sandikci A, Huber D, Chaba R, Gloge F, Nichols RJ, Typas A,
Gross CA, Kramer G, et al. Selective ribosome profiling reveals the
cotranslational chaperone action of trigger factor in vivo. Cell. 2011;147:
1295–308.
42. Barkai N, Shilo BZ. Variability and robustness in biomolecular systems. Mol
Cell. 2007;28:755–60.
43. Shinar G, Milo R, Martinez MR, Alon U. Input output robustness in simple
bacterial signaling systems. Proc Natl Acad Sci U S A. 2007;104:19931–5.
44. Zoschke R, Watkins KP, Barkan A. A rapid ribosome profiling method
elucidates chloroplast ribosome behavior in vivo. Plant Cell. 2013;25:2265–
75.
45. Brusilow WS, Klionsky DJ, Simoni RD. Differential polypeptide synthesis of
the proton-translocating ATPase of Escherichia coli. J Bacteriol. 1982;151:
1363–71.
46. Quax TE, Wolf YI, Koehorst JJ, Wurtzel O, van der Oost R, Ran W, Blombach
F, Makarova KS, Brouns SJ, Forster AC, et al. Differential translation tunes
uneven production of operon-encoded proteins. Cell Rep. 2013;4:938–44.
47. Zhang G, Lukoszek R, Mueller-Roeber B, Ignatova Z. Different sequence
signatures in the upstream regions of plant and animal tRNA genes shape
distinct modes of regulation. Nucleic Acids Res. 2011;39:3331–9.
48. Blikstad I, Nelson WJ, Moon RT, Lazarides E. Synthesis and assembly of
spectrin during avian erythropoiesis: stoichiometric assembly but unequal
synthesis of alpha and beta spectrin. Cell. 1983;32:1081–91.
49. Lehnert ME, Lodish HF. Unequal synthesis and differential degradation of
alpha and beta spectrin during murine erythroid differentiation. J Cell Biol.
1988;107:413–26.
50. Herendeen SL, VanBogelen RA, Neidhardt FC. Levels of major proteins of
Escherichia coli during growth at different temperatures. J Bacteriol. 1979;
139:185–94.
51. Hough R, Rechsteiner M. Effects of temperature on the degradation of
proteins in rabbit reticulocyte lysates and after injection into HeLa cells.
Proc Natl Acad Sci U S A. 1984;81:90–4.
52. Boyes DC, Zayed AM, Ascenzi R, McCaskill AJ, Hoffman NE, Davis KR, Gorlach
J. Growth stage-based phenotypic analysis of Arabidopsis: a model for high
throughput functional genomics in plants. Plant Cell. 2001;13:1499–510.
53. Mustroph A, Zanetti ME, Jang CJ, Holtan HE, Repetti PP, Galbraith DW, Girke
T, Bailey-Serres J. Profiling translatomes of discrete cell populations resolves
altered cellular priorities during hypoxia in Arabidopsis. Proc Natl Acad Sci U
S A. 2009;106:18843–8.
54. Anders S, Huber W. Differential expression analysis for sequence count data.
Genome Biol. 2010;11:R106.
55. da Huang W, Sherman BT, Lempicki RA. Systematic and integrative analysis
of large gene lists using DAVID bioinformatics resources. Nat Protoc. 2009;4:
44–57.
56. da Huang W, Sherman BT, Lempicki RA. Bioinformatics enrichment tools:
paths toward the comprehensive functional analysis of large gene lists.
Nucleic Acids Res. 2009;37:1–13.
57. Lorenz R, Bernhart SH, Siederdissen CHZ, Tafer H, Flamm C, Stadler PF,
Hofacker IL. ViennaRNA package 2.0. Algorithm Mol Biol. 2011;6:26.