Construction of a dense genetic linkage map and mapping quantitative trait loci for economic traits of a doubled haploid population of Pyropia haitanensis (Bangiales, Rhodophyta)
Bạn đang xem bản rút gọn của tài liệu. Xem và tải ngay bản đầy đủ của tài liệu tại đây (2.88 MB, 11 trang )
Xu et al. BMC Plant Biology (2015) 15:228
DOI 10.1186/s12870-015-0604-4
RESEARCH ARTICLE
Open Access
Construction of a dense genetic linkage
map and mapping quantitative trait loci for
economic traits of a doubled haploid
population of Pyropia haitanensis
(Bangiales, Rhodophyta)
Yan Xu1, Long Huang2, Dehua Ji1, Changsheng Chen1, Hongkun Zheng2* and Chaotian Xie1*
Abstract
Background: Pyropia haitanensis is one of the most economically important mariculture crops in China. A high-density
genetic map has not been published yet and quantitative trait locus (QTL) mapping has not been undertaken for
P. haitanensis because of a lack of sufficient molecular markers. Specific length amplified fragment sequencing
(SLAF-seq) was developed recently for large-scale, high resolution de novo marker discovery and genotyping.
In this study, SLAF-seq was used to obtain mass length polymorphic markers to construct a high-density
genetic map for P. haitanensis.
Results: In total, 120.33 Gb of data containing 75.21 M pair-end reads was obtained after sequencing. The average
coverage for each SLAF marker was 75.50-fold in the male parent, 74.02-fold in the female parent, and 6.14-fold
average in each double haploid individual. In total, 188,982 SLAFs were detected, of which 6731 were length
polymorphic SLAFs that could be used to construct a genetic map. The final map included 4550 length polymorphic
markers that were combined into 740 bins on five linkage groups, with a length of 874.33 cM and an average distance
of 1.18 cM between adjacent bins. This map was used for QTL mapping to identify chromosomal regions associated
with six economically important traits: frond length, width, thickness, fresh weight, growth rates of frond length and
growth rates of fresh weight. Fifteen QTLs were identified for these traits. The value of phenotypic variance explained
by an individual QTL ranged from 9.59 to 16.61 %, and the confidence interval of each QTL ranged from 0.97 cM to
16.51 cM.
Conclusions: The first high-density genetic linkage map for P. haitanensis was constructed, and fifteen QTLs associated
with six economically important traits were identified. The results of this study not only provide a platform for gene and
QTL fine mapping, map-based gene isolation, and molecular breeding for P. haitanensis, but will also serve as a reference
for positioning sequence scaffolds on a physical map and will assist in the process of assembling the P. haitanensis
genome sequence. This will have a positive impact on breeding programs that aim to increase the production and
quality of P. haitanensis in the future.
* Correspondence: ;
2
Biomarker Technologies Corporation, Beijing 101300, PR China
1
College of Fisheries, Jimei University, Xiamen 361021, PR China
© 2015 Xu et al. Open Access This article is distributed under the terms of the Creative Commons Attribution 4.0
International License ( which permits unrestricted use, distribution, and
reproduction in any medium, provided you give appropriate credit to the original author(s) and the source, provide a link to
the Creative Commons license, and indicate if changes were made. The Creative Commons Public Domain Dedication waiver
( applies to the data made available in this article, unless otherwise stated.
Xu et al. BMC Plant Biology (2015) 15:228
Background
Pyropia/Porphyra is one of the most important marine
macroalgae in terms of both its global distribution and
economic importance. According to Yoshida et al. [1]
and Sutherland et al. [2], over 130 species of Pyropia/
Porphyra have been described worldwide. Farming and
processing of Pyropia have generated the largest seaweed
industries in East Asian countries, such as China, Japan,
and South Korea [3, 4]. In China, two major cultivars,
Pyropia yezoensis Ueda and Pyropia haitanensis Chang
et Zheng, are distributed in North China and South
China, respectively. P. haitanensis, as a typical warm,
temperate zone species originally found in the south of
China, has been extensively cultured in Fujian, Zhejiang
and Guangdong Provinces of China for more than
50 years. Its output accounts for about 75 % of the total
production of cultivated Pyropia in China [4, 5].
Through years of genetic study and breeding, some improved varieties of P. haitanensis have been obtained and
cultivated widely [6–8]. To some degree, this enhanced
the cultivation of Pyropia and promoted the industrial development of this economic seaweed. However, P. haitanensis cultivation still faces many problems. First, to date,
the cultivation of P. haitanensis in some areas still relies
on natural populations, with very limited germplasm development and genetic improvement. Second, the genetic
basis for most of the traits related to commercial production is still undetermined, and we lack varieties of P. haitanensis with high yield or high quality [9]. Thus, it is
highly desirable to carry out breeding studies and to cultivate elite species to raise the industrial economic efficiency and expand the scale of P. haitanensis cultivation.
Plant breeding is a dynamic area of applied science. It
relies on genetic variation and uses selection to improve
plant characteristics that are of interest to the grower and
consumers; however, this is a time-consuming and laborintensive field evaluation process. The development of
high yield or high quality varieties is a major goal in Pyropia breeding; however, traits related to production or quality of P. haitanensis, such as frond length (FL), frond width
(FW), frond thickness (FT), fresh weight (W), and growth
rates, are quantitative characteristics [9–11]. It is believed
that these complex traits are controlled by multiple genes
and are susceptible to environmental changes [9, 12].
Methods to analyze such complex traits, particularly to uncover their potential genetic bases, are of prime importance
for breeding purposes. In recent years, with the availability
of molecular markers to develop well-saturated genetic
maps and statistical methodology to dissect complex traits,
mapping of quantitative trait loci (QTLs) has proved to be
an effective approach to study the genetic architecture of
quantitative traits. QTL analysis is a powerful strategy to
identify underlying genes and elements when combined
with map-based cloning, because it allows the estimation
Page 2 of 11
of the QTL number, their genomic position, and their genetic effects [13]. This method has been applied successfully
to most farm animal species, crops and some aquaculture
species [13–15]. However, among economically important
seaweeds, the method has only been used to analyze the
genetic bases of two quantitative traits (FL and FW) of
Laminaria japonica and located their genetic loci on a
high-density map [16].
The efficiency of QTL mapping largely depends on the
marker density of the genetic map. For a given trait in a
particular population, increasing the marker density can
increase the resolution of the genetic map, thus enhancing the precision of QTL mapping [17]. Traditionally,
the development of markers such as simple sequence repeats (SSRs), restriction fragment length polymorphisms
(RFLPs) and amplified fragment length polymorphisms
(AFLPs) was a costly, low-throughput and iterative process
that involved time-consuming cloning and primer design
steps that could not easily be parallelized. Scoring of
marker panels across target populations was also expensive and laborious. The development of next generation
sequencing technology has make it possible to discover
huge numbers of markers rapidly throughout the genome
to construct high-density genetic maps and make genotyping easier. Recently, several cost effective methods of
markers discovery and high-throughput genotyping were
developed, such as RAD-seq (restriction site-associated
sequencing), double digest RAD-seq, GBS (two-enzyme
genotyping-by-sequencing), and SLAF-seq (specific length
amplified fragment sequencing) [17, 18]. Among them,
SLAF is measured by sequencing the paired-ends of
sequence-specific restriction fragment lengths. SLAF involves fragment length selection but not random interruption; therefore, its repeatability and accuracy are better
than RAD and GBS [18, 19]. SLAF has been used successfully to create genetic maps for common carp [18], sesame
[20], kiwifruit [21] and soybean [19].
In previous works, the first genetic linkage map of P.
haitanensis was constructed [22], and some quantitative
traits were analyzed [9]; however, a high-density genetic
map has not been published yet and QTL mapping has
still not been undertaken for P. haitanensis because of a
lack of sufficient molecular markers. Therefore, in this
study, we constructed a higher density genetic map for
P. haitanensis based on the recently developed SLAFseq approach and then mapped QTLs controlling certain
economic traits of P. haitanensis.
Results
Genotyping of a double haploid (DH) population based
on SLAF-seq
The DH population was genotyped using SLAF-seq technology. According to the results of a pilot experiment,
Hae III and Hpy166II were chosen to construct the SLAF
Xu et al. BMC Plant Biology (2015) 15:228
library. The library comprised SLAF fragments that were
264–464 bp in size. After high-throughput sequencing,
120.33 Gb of data containing 75.21 M pair-end reads was
obtained, with each read being 80 bp in length. The Q30
(representing a quality score of 30, indicating a 0.1 %
chance of an error, and thus 99.9 % confidence) ratio was
78.52 % and guanine-cytosine (GC) content was 53.19 %.
Among these high quality data, approximately 1.6 Gb were
from the male parent (10,021,701 reads) and approximately
1.4 Gb were from the female parent (9,291,420 reads); the
average read numbers of the 100 individuals in the DH
population was 542,720.
The numbers of SLAFs in the male and female parents
were 96,652 and 106,272, respectively. The read numbers for the SLAFs were 7,296,857 and 7,865,906 in the
male and female parents, respectively. The average
coverage for each marker was 75.50-fold in the male
parent and 74.02-fold in the female parent. In the DH
population, the numbers of SLAF markers in each individual ranged from 17,751 to 87,038 (average of 61,136).
The read numbers for SLAFs ranged from 54,860 to
802,063 (average of 384,760), and the coverage ranged
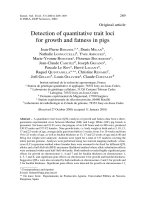
from 3.09-fold to 9.35-fold (average of 6.14-fold) (Fig. 1).
Among the 188,982 detected high-quality SLAFs, 8553
were polymorphic, giving a polymorphism rate of only
4.53 % (Table 1). Of the 8553 polymorphic SLAFs, 2372
Page 3 of 11
were classified into eight segregation patterns (Table 2).
The genotype of the DH line is aa or bb; therefore, only the
aa × bb segregation pattern in the DH population was used
to construct the genetic map, and 1748 markers fell into
this class. Among these 1748 markers, after filtering out
the markers with average sequence depths less than 10-fold
in the parents, an integrity < 30 % and those showing segregation distortion, only two markers could be used for genetic map construction. Thus, these polymorphic SLAF
markers were not suitable for genetic map construction.
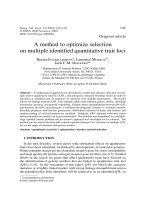
Exploiting the variation in restriction sites, enzyme digestion can produce fragments of different lengths in the
two parents, and using SLAF-seq through gel extraction
screening for fragments of a certain length, the same
locus in the sequencing data will detect only one genotype, as shown in Fig. 2. As a result, during data analysis
in the project, a large number of fragments of different
lengths and one genotype only are detected, and these
length polymorphic (LP) fragments were regarded as nonpolymorphic SLAFs in the conventional analysis. Thus,
the 180,394 non-polymorphic SLAFs in this project could
be used as LP markers to construct a genetic map.
For the 180,394 non-polymorphic SLAFs, the SLAFs
that were present only in the female parent or the male
parent were first screened. The map population is DH;
therefore, the SLAFs which were only present in the
Fig. 1 Coverage and number of markers for each double haploid (DH) individual and their parents. The x-axes in (a and b) indicate the
plant accession, including the female parent and the male parent, followed by each of the DH individuals; the y-axes indicate coverage
in (a) and number of markers in (b)
Xu et al. BMC Plant Biology (2015) 15:228
Page 4 of 11
Table 1 SLAF markers mining results
Type
Polymorphic
SLAF
Non-Polymorphic
SLAF
Repetitive
SLAF
Total
SLAF
Number
8553
180,394
35
188,982
95.46 %
0.02 %
100 %
Percentage 4.53 %
female parent were typed as aa, and the genotypes of offspring in which the SLAFs could be detected were also
typed as aa. The genotypes of the male parent and offspring in which the SLAFs could not be detected were
typed as bb. The SLAFs only present in the male parent
were typed as bb, and the genotypes of offspring in which
the SLAFs could be detected were also typed as bb; however, the genotypes of male parent and offspring in which
the SLAFs could not be detected were typed as aa. Consequently, 86,190 LP markers were obtained. To ensure the
quality of the genetic map, the 86,190 LP markers were
further screened based on three criteria: i) the sequencing
depth in the female parent or in the male parent must be
larger than 10×; ii) the average sequencing depth in the
offspring must larger than 3×; and iii) no significant segregation distortion must be present (P < 0.05). Ultimately,
6731 LP markers satisfied the criteria and were used to
construct the genetic map.
Basic characteristics of the genetic map
After linkage analysis, 4550 (Additional file 1: Table S1)
of the 6731 (Additional file 2: Table S2) LP markers
were mapped onto the genetic map, while the other
2181 markers failed to be linked to any group. The 4550
markers were distributed on the five linkage groups
(Additional file 3: Table S3). For the obtained linkage
groups that contained many redundant markers that provided no new information, the bin-markers approach was
used to combine them into bins that showed a unique segregation pattern and were separated from adjacent bins by
Table 2 Number of polymorphic SLAF markers for the eight
segregation patterns
Type
Polymorphic SLAF
No_P_M
6181
ab × cd
8
ef × eg
6
hk × hk
273
lm × ll
219
nn × np
124
aa × bb
1748
aa × cc
19
cc × ab
10
a single recombination event into one bin (Additional file 4:
Table S4). Through this step, the final genetic map included
740 bins and was 874.33 cM in length, with an average distance of 1.18 cM between adjacent bins (Fig. 3, Table 3). As
shown in Table 3, the largest linkage group (LG) was LG1
with 198 bins, a length of 208.78 cM, and an average distance of only 1.05 cM between adjacent bins. The smallest
LG was LG5, with 102 bins, a length of 140.02 cM, and an
average distance of 1.37 cM between adjacent bins. The degree of linkage between bins was reflected by “Gap <
2”, which ranged between 94.06 % and 100 %, with an
average value of 97.87 %. The largest gap on this map was
7.83 cM in LG5.
Visualization and evaluation of the genetic map
Haplotype maps and a heat map were used to evaluate
the quality of the genetic map. A haplotype map reflects
the proportion of double crossovers, which suggested
genotyping errors. Haplotype maps (Additional file 5)
were generated for each of the 100 lines of the DH
population and for the parental controls, using the 4550
LP markers, as described by West et al. [23]. The haplotype maps intuitively displayed the recombination events
of each line (Additional file 5). Most of the recombination blocks were clearly defined. Less than 0.1 % had
heterozygous fragments, and less than 0.6 % were missing. Although high frequency recombination events did
occur in the DHs, all linkage groups were distributed
uniformly, only a few sites showing heterozygosity were
present. Therefore, the DH population was well purified
and suitable for genetic analysis.
The heat map reflects the relationship of recombination
between markers from one linkage group, which can be
used to find ordering errors. Heat maps were created to
evaluate the genetic map quality using pair-wise recombination values for the 4550 LP markers (Additional file 6).
Visualization of the heat map showed that, in general, the
LGs performed well.
Phenotypic traits
Six economically important traits, FL, frond length; FW,
frond width; FT, frond thickness; W, fresh weight; LGR,
frond length growth rate; WGR, fresh weight growth
rate, of the parents and the 100 DH lines were measured
(Additional file 7: Table S5). The phenotypic values of
the traits measured in the DH population were continuously distributed. The coefficient of variation for the six
traits was between 20.43 % and 50.35 % (Table 4). The
asymptotic significance of a one-sample KolmogorovSmirnov test showed that the frequency of the six traits
in the DH population was in accordance with a normal
distribution (Pks > 0.05) (Table 4), indicating that all the
measured traits were quantitatively inherited.
Xu et al. BMC Plant Biology (2015) 15:228
Page 5 of 11
Fig. 2 Schematic diagram of the production of length polymorphic (LP) markers
QTL analysis
Based on the high-density genetic map, QTLs underlying
the six economically important traits, FL, FW, FT, W, LGR
and WGR were identified. The threshold of the logarithm
of odds (LOD) scores to evaluate the statistical significance
of the QTL effects was determined using 1000 permutations. As a result, intervals with a LOD value above 2.5
were detected as effective QTLs, using the winQTLCart
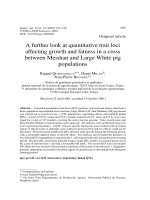
software. According to the threshold, 15 QTLs associated
with the six traits investigated were identified on LG1 and
LG2; no QTLs were found on the other LGs (Fig. 3,
Table 5). Among the 15 QTLs, one was associated with FT,
three each were associated with FW and FT, two each were
associated with W and WGR, and four were associated
with LGR. The minimum and maximum LOD scores were
recorded as 2.64 and 4.54, respectively. The value of phenotypic variance explained (PVE) by each individual QTL
ranged from 9.59 to 16.61 %. The minimum and maximum
confidence intervals of the QTLs were 0.97 cM and
16.51 cM, respectively (Table 5).
Discussion
Features of the high-density map of P. haitanensis
Linkage maps, especially high-density ones, play an important role in the study of genetics and genomics. In
this study, we employed the recently developed SLAF-seq
approach to achieve the first, rapid mass discovery of LP
markers for P. haitanensis. Using these newly developed LP
markers, a high-density genetic map of P. haitanensis was
constructed and its characteristics were investigated for a
DH population. In this map, the LG number was equal to
the haploid chromosome number of P. haitanensis [24];
however, in the absence of cytological markers, we cannot
judge if each linkage group corresponded to each chromosome. The map spans 874.33 cM, with an average number
of 148 bins per LG and an average distance of 1.18 cM between adjacent bins (Table 3). The total map length is similar to that of a previously reported P. haitanensis genetic
map, which spanned 830.6 cM; however, the average distance in the present map is much less than the 10.13 cM
previously reported [22]. The markers were distributed
evenly on the map, with 97.87 % of the gaps being less than
2 cM and the largest gap being 7.83 cM (Table 3).
Visual evaluation of the genetic map was performed
using haplotype maps and heat maps, which demonstrated
that all linkage groups were distributed uniformly, with only
a few sites showing heterozygosity. Thus, we believe that it
is a high quality genetic map. Compared with PCR-based
methods in the same DH population [22], the sequencingbased high-throughput method produced a more than 8fold denser genetic map and took only 3 weeks to genotype
100 DHs. Thus, this powerful technique is considerably
more efficient, cost-effective and less laborious.
To the best of our knowledge, the genetic map presented
in this paper is the first high-density genetic linkage map
for P. haitanensis, though it is still not saturated. Compared
with published genetic linkage maps in other macroalgae,
such as L. japonica ([25]: average density of 8.0 cM; [26]:
average density of 9.4 cM; [27]: average density of 7.91 cM),
this P. haitanensis map is the densest. The results of this
study not only provide mass markers for P. haitanensis, but
also provide useful data for gene and QTL fine mapping,
map-based gene isolation and molecular breeding. The
whole genome sequencing of P. haitanensis is underway
(personal communication), and because our high-density
map was constructed based on molecular markers developed at the whole genome level, they will also serve as a
reference for positioning sequence scaffolds on the physical
map to assist in the assembly process of the P. haitanensis
genome sequence.
High-density genetic maps of populations with high linkage disequilibrium contain many redundant markers that
provide no new information, but do increase the computational requirements of mapping [28]. To address this issue,
a bin marker approach was applied to the construction of
the high-density genetic map of P. haitanensis, one “bin”
means a group of markers with a unique segregation pattern that is separated from adjacent bins by one recombination event. The bin-map strategy was efficient for
generating ultra-high-density genetic maps and identifying QTLs at high resolution in several crops [28–31].
Compared with conventional molecular markers, such as
RFLPs, SSRs or single nucleotide polymorphism markers,
bin markers are the most informative and parsimonious set
for a given population [28]. In this study, 4550 LP markers
were grouped into 740 bins. Although the LP markers in
Xu et al. BMC Plant Biology (2015) 15:228
Page 6 of 11
Fig. 3 High-density linkage map for P. haitanensis and QTL locations in the map for six economically important traits. FL, frond length; FW, frond
width; FT, frond thickness; W, fresh weight; LGR, frond length growth rate; WGR, fresh weight growth rate
one bin appeared at the same position on this genetic
map, their actual physical positions were not at the same
location. These markers could be used for different populations, in which they may show different diversities.
QTLs of economically important traits of P. haitanensis
QTLs are chromosomal regions determining a quantitative character that can identify genes affecting economic
traits [32]. Hence, through QTL studies, the numbers
Xu et al. BMC Plant Biology (2015) 15:228
Page 7 of 11
Table 3 Summary of the five genetic linkages groups for P. haitanensis
Linkage group ID
Total marker
Total bin
Total distance (cM)
Average distance (cM)
Max gap (cM)
Gaps < 2
LG1
1,154
198
208.78
1.05
1.94
100 %
LG2
1,013
142
155.37
1.09
1.94
100 %
LG3
1,025
149
167.19
1.12
3.89
99.32
LG4
683
149
202.98
1.36
4.87
95.95
LG5
675
102
140.02
1.37
7.83
94.06
Total
4,550
740
874.33
1.18
7.83
97.87
“Gap < 2” indicates the percentages of gaps in which the distance between adjacent bin markers was less than 2 cM
and effects of genes that determine one quantitative trait
can be determined and could be used in selective breeding to accelerate the genetic improvement of this trait.
In recent decades, there has been a remarkable increase
in the use of QTL mapping as a tool to uncover the genetic control of economic traits in aquaculture species,
and such studies have been carried out in more than 20
aquaculture species [15]. The economically important
traits of P. haitanensis, FL, FW, FT, W, LGR and WGR,
are under selection during a breeding program and are
controlled by QTLs [9]. This study presents the first example of QTL detection for economic traits in a DH
population of P. haitanensis using a high-density linkage
map and phenotypic data, although these phenotypic
data were obtained under only one environment. Fifteen
QTLs associated with FL, FW, FT, W, LGR and WGR
were identified (Table 5). These results will enable further fine mapping of these QTLs in P. haitanensis, eventually identifying the individual genes responsible for
these economic traits. The information from these molecular makers could be used in selective breeding programs to increase the production and quality of P.
haitanensis in the future.
Compared with the low-density map constructed previously, the present high-density genetic map proved to
be more powerful for identifying precise QTLs controlling important agronomic traits. Previously, using the
low-density map, only seven QTLs were identified and
only three showed a PVE as large as 10 % [33]. By contrast, in this study, 15 QTLs were identified and only
two showed a PVE of less than 10 % (Table 5). In a
previous study, Collard et al. reported that a major QTL
is defined as one contributing 10 % or more phenotypic
variation [34]. Therefore, thirteen of the QTLs presented
in this study may be regarded as major QTLs in P. haitanensis breeding programs.
Previous studies in fine mapping and map-based cloning have found that QTLs and genes can exhibit pleiotropic effects on multiple traits, and phenotypically
correlated traits are often mapped together [30]. In this
study, the co-localizations of QTLs for several traits investigated were clearly observed in some chromosomal
intervals; for example, the interval of confidence (IC) of
qFL includes the IC of qW-1 and qLGR-3, and the IC of
qW-2 includes the IC of qLGR-4. These observations
were not surprising, because in the correlation analysis
of the quantitative traits of P. haitanensis, the traits of
FL, W and LGR showed significant positive correlations
[9]. One important goal of genomic and genetic studies
of plants is to identify important loci and genes that
could be used to improve agronomic traits and, thereby,
agricultural productivity [12]. Our results provide useful
information on target chromosomal intervals for candidate gene analysis and marker-assisted selection breeding, because these intervals could be regarded as hotspots
with agronomical importance, although additional studies
are needed to confirm these findings. Taking such hotspots based on QTL results as prior chromosomal regions,
a strategy has been suggested for candidate gene isolation
[35]. The relationship between the genetic bin map and
the physical position of LP markers is consistent; therefore, it is easy to anchor the physical interval and find the
Table 4 Performance of characters in the DH population and its parents
Character
Male parent
Female parent
DH population
FL (cm)
23.19 ± 3.70**
34.08 ± 3.90**
25.37 ± 11.55
45.57 %
0.159
6.82 ± 1.12**
2.20 ± 0.25**
5.86 ± 2.00
34.03 %
0.277
FW (mm)
Coefficient of variation
Asymptotic significance of one-sample
Kolmogorov-Smirnov test (Pks)
W (mg)
78.43 ± 16.66**
39.99 ± 7.22**
75.40 ± 43.24
57.35 %
0.398
FT (μm)
33.38 ± 1.96**
26.25 ± 1.77**
32.78 ± 6.89
20.43 %
0.758
LGR (%)
17.06 ± 1.06**
20.17 ± 0.94**
16.64 ± 4.84
29.07 %
0.944
WGR (%)
34.86 ± 2.74**
24.20 ± 2.00**
30.31 ± 7.02
23.16 %
0.057
Data are the mean ± SD (n = 30); t tests were used to analyze differences between parents; **highly significant (P ≤ 0.01)
Xu et al. BMC Plant Biology (2015) 15:228
Page 8 of 11
Table 5 Detail of QTLs related to economic traits
Trait
QTL
LODa
Linkage group ID
IC (cM)b
Marker numberc
PVEd
ADDe
FL
qFL
4.54
1
158.29–170.94
11
16.61 %
126.87
FW
FT
W
LGR
WGR
qFW-1
2.64
1
177.71–178.68
1
9.67 %
23.84
qFW-2
3.89
2
69.93–73.81
4
12.2 %
88.40
qFW-3
4.21
2
130.16–133.05
3
16.7 %
74.85
qFT-1
2.92
1
31.08–34
2
12.11 %
51.38
qFT-2
4.04
1
35.94–45.65
9
13.84 %
163.09
qFT-3
2.67
1
48.56–49.53
1
11.59 %
24.53
qW-1
3.39
1
166.06–168.97
3
11.61 %
54.23
qW-2
2.96
2
90.35–92.26
2
14.52 %
38.35
qLGR-1
2.93
1
79.64–80.61
1
10.79 %
25.28
qLGR-2
3.75
1
82.55–94.2
12
12.51 %
193.06
qLGR-3
3.61
1
166.06–168
2
12.14 %
43.44
qLGR-4
2.65
2
91.29–92.26
1
9.59 %
23.82
qWGR-1
3.51
1
56.33–63.13
5
12.8 %
117.14
qWGR-2
4.38
2
31.08–47.59
14
13.35 %
275.31
a
LOD indicates the logarithm of odds score
IC indicates the interval of confidence in centimorgans
c
Marker number indicates the number of bin markers in the confidence interval
d
PVE indicates the phenotypic variance explained by individual QTL
e
ADD indicates the additive effect value
b
putative genes in this region. Moreover, the transfer of
large chromosomal intervals from a donor parent into a
recurrent parent has been proposed [30].
Conclusions
In this study, the SLAF-seq approach was used for largescale marker discovery and genotyping to develop a
high-density genetic linkage map of P. haitanensis from
a DH population of 100 lines. Our results suggested that
this high-density genetic map is accurate and of high
quality. The map was used for QTL mapping to identify
chromosomal regions associated with six economically
important traits: FL, FW, FT, W, LGR and WGR. Fifteen
QTLs (including 13 major QTLs) were identified (one
for FT, three for FW and FT, two for W and WGR, and
four for LGR). The present study increases our knowledge
of the genetic control of these economically important
traits of P. haitanensis. These data, together with the molecular resources generated herein (e.g., the high-density
map and the mass of LP markers), will have a positive impact on future breeding programs that aim to increase the
production and quality of P. haitanensis.
Methods
Construction of map population
A DH population of 100 lines was used to construct the
genetic linkage map of P. haitanensis. The parental lines
used in the hybridization experiment were a wild-type
line (♂), YSIII, and a red-type artificial pigmentation
mutant line (♀), RTPM. The free-living conchocelis of
the wild-type line were established in 1999 from a gametophytic blade collected on the coast of Dongshan Island,
Fujian Province, China, and has been maintained in the laboratory. The stock culture was maintained at 21 ± 1 °C
under 50-60 μmol · photons m-2 s-1 (12Light (L):12Dark
(D)) provided by cool white fluorescent lamps, by renewing the culture medium (MES) [36] once every month.
Free-living conchocelis of the red type artificial pigmentation mutant line of P. haitanensis were obtained by treatment of the gametophytic blades of another wild-type
with 60Co-γ rays [6].
To prepare the DH population, the mature free-living
conchocelis of each parent were induced to release conchospores. The conchospores were collected in a 300-mL
flask containing 200-mL culture medium and cultured
with aeration in an incubator at 25 ± 1 °C under 80 μmol ·
photons m-2 s-1 (10 L: 14D) to develop into gametophytic
blades, with culture medium renewed every 3 days. After
approximately 2 months in culture, healthy gametophytic
blades were selected as parents for crossing experiments,
and a male and a female blade were co-cultured in a flask
until carposporangia appeared. About 2 weeks later, the
fertilized female blade was transferred into a new flask
and cultured under the same conditions until carpospores
were released. The carpospores were collected and grown
individually to conchocelis colonies in a test tube. When
the conchocelis colonies grew to a certain size, they were
fragmented by a homogenizer and continued in culture
Xu et al. BMC Plant Biology (2015) 15:228
Page 9 of 11
until the conchospores were released. Culture conditions
and methods were the same as described above. Once
conchospores were released from the heterozygous conchocelis filaments, they were collected and passed gently
through a 50-μm nylon mesh filter, and cultured in Petri
dishes containing the culture medium at 25 ± 1 °C under
40 μmol · photons m-2 s-1 (10 L:14D) to obtain F1 gametophytic blades. After 40 days in culture, the F1 gametophytic blades were picked out and transferred onto a slide
glass to examine the types of F1 blades under a light
microscope (Nikon SMZ800). Each partial color phenotype F1 blade was obtained by a puncher and digested into
a single vegetative cell by 2 % snail enzymes dissolved in
2-mol/L glucose liquor. The vegetative cells were then induced to develop into conchocelis (with double the normal amount of chromosomes) by single somatic cell clone
cultivation [37], producing the DH population. During
processing, 166 color-sectors were gained from 50 F1
blades, and only 100 color-sectors were developed into
conchocelis.
PCR reaction was performed using diluted restrictionligation samples, dNTP, Q5® High-Fidelity DNA polymerase and PCR primers: AATGATACGGCGACCACCGA
and CAAGCAGAAGACGGCATACG (PAGE purified,
Life Technologies). The PCR products were purified using
Agencourt AMPure XP beads (Beckman Coulter, High
Wycombe, UK) and pooled. The pooled sample was separated by electrophoresis through a 2 % agarose gel. Fragments of 264–464 bp (with indexes and adaptors) were
excised, purified using QIAquick Gel Extraction Kit (QIAGEN) and diluted for pair-end sequencing on an Illumina
Highseq™ 2500 sequencing platform (Illumina, Inc; San
Diego, CA, USA) at Biomarker Technologies Corporation
in Beijing ( Real-time monitoring was performed for each cycle during sequencing.
The ratio of high quality reads with quality scores greater
than Q30 (representing a quality score of 20, indicating a
1 % chance of an error, and thus 99 % confidence) in the
raw reads and the guanine-cytosine (GC) content were calculated for quality control.
DNA extraction
SLAF-seq data grouping and genotype definition
DNA was isolated from free-living conchocelis of each
parental line and 100 DH lines. The collected freeliving conchocelis were ground into a powder using a
high-speed homogenizer, and the DNA was extracted
and purified by the Cetyltrimethyl Ammonium Bromide (CTAB) method [38]. The DNA concentration and
quality were determined using a DU-600 spectrophotometer (Beckman Coulter, Fullerton, CA, USA) and by electrophoresis through 0.8 % agarose gels with a lambda
DNA standard.
All SLAF pair-end reads with clear index information
were clustered based on sequence similarity, as detected by
BLAT (−tileSize = 10 –stepSize = 5) [39]. Sequences with
over 90 % identity were grouped in one SLAF locus, as described by Sun et al. [18]. Alleles were defined in each
SLAF using the minor allele frequency (MAF) evaluation.
The mapping population is DH; therefore, one locus contains at most two SLAF tags, so groups containing more
than two tags were filtered out as repetitive SLAFs. In this
study, SLAFs with a sequence depth of less than 100 were
defined as low-depth SLAFs and were filtered out. SLAFs
with two tags were identified as polymorphic SLAFs and
considered as potential markers. Polymorphic markers
were classified into eight segregation patterns (ab × cd, ef ×
eg, hk × hk, lm × ll, nn × np, aa × bb, ab × cc and cc × ab).
Given that the map population is DH, the study only used
those SLAF markers whose segregation patterns were aa ×
bb for genetic map construction.
SLAF library construction and high-throughput
sequencing
SLAF-seq was used to genotype 100 individuals, and the
two parents, as previously described [18], with small modifications. First, a pilot SLAF experiment was performed to
establish the conditions to optimize SLAF yield. The enzymes and sizes of restriction fragments were evaluated
using training data. Three criteria were considered: i) The
number of SLAFs must be suitable for the specific needs
of the research project; ii) the SLAFs must be evenly distributed through the sequences to be examined; and iii)
repeated SLAFs must be avoided. Next, based on the result of the pilot experiment, the SLAF library was constructed as follows. Genomic DNA was first incubated at
37 °C with Hae III and Hpy166II [New England Biolabs
(NEB), Ipswich, MA, USA] for complete digestion, a
single-nucleotide A overhang was added to the digested
fragments using the Klenow Fragment (3′ → 5′ exonuclease) (NEB) and dATP at 37 °C. Duplex Tag-labeled Sequencing adapters (PAGE purified, Life Technologies) were then
ligated to the A-tailed DNA using T4 DNA ligase. The
Segregation analysis and bin-map construction
Marker segregation ratios were calculated using the chisquare test, and markers showing significant segregation
distortion (P < 0.05) were excluded from the map construction. The recombination rates between markers
were calculated using JoinMap 4.0 software [40] and the
genetic map was constructed using a modified logarithm
of odds (mLOD) threshold ≥ 7.0 ( />index.php/mc.JoinMap/sc.FAQ) and a maximum recombination fraction of 0.4. All high quality and nondistorted SLAFs markers were allocated into five LGs
based on their locations on chromosomes. Considering
that next generation sequencing data may cause many
Xu et al. BMC Plant Biology (2015) 15:228
genotyping errors and deletions, which could greatly reduce the quality of high-density linkage maps, the HighMap Strategy was used to order SLAF markers and
correct genotyping errors within the LGs [41]. The
MSTmap algorithm was used to order the SLAFs
markers [42] and the SMOOTH algorithm [43] was used
to correct genotyping errors following marker ordering.
All linkage groups underwent these procedures: primary
marker orders were first obtained by their location on
chromosomes, according to the relationship between ordered markers, and genotyping errors or deletion were
corrected by SMOOTH algorithm; after that MSTmap
was used to order the map and again SMOOTH was
taken to correct the new ordered genotypes. After four
or more cycles, five high-quality maps were obtained.
Map distances were estimated using the Kosambi mapping function [44].
The obtained genetic maps contained many redundant
markers that provided no new information, but increased the computational requirements of mapping. To
address these issues, the bin-markers approach developed by Huang et al. (2009) was used to combine all the
markers in the same locus into one bin [28]. A “bin”
means a group of markers with a unique segregation
pattern that is separated from adjacent bins by a single
recombination event. Using this method, five highquality bin-maps of P. haitanensis were obtained.
Phenotypic data analysis
The DH population and parents were evaluated in randomized complete block design with three biological
replicates, each composed by 10 gametophytic blades
per flask. Each biological replicate was evaluated in an
identical but independent experiment performed on a
seven-day interval. First, the conchocelis of 102 lines (include100 DH lines and their 2 parental lines) were induced to release conchospores, respectively. Second, the
conchospores of each line were collected in separate
300-mL flask containing 200-mL culture medium, and
cultured with aeration in an incubator at 21 ± 1 °C under
50-60 μmol•photons m-2 s-1 (12 L: 12D) to develop into
gametophytic blades, with the culture medium renewed
every 3 days. Third, after the lengths of gametophyte blades
were 4.0 ± 0.2 cm, 10 healthy and integrated gametophytic
blades derived from each line were randomly selected and
place into 1000-mL flasks containing 700-mL culture
medium. Culture conditions were the same as described above, but the culture medium was renewed
every 2 days. The frond length (FL), width (FW), thickness (FT) and fresh weight (W) of the gametophytic
blades were measured after 10 days in culture. The growth
rates of frond length and fresh weight were calculated
using the formulas:
Page 10 of 11
Frond length growth rate ðLGRÞ
¼ ðlnLn ‐ lnL0 Þ=n  100 %
Fresh weight growth rate ðWGRÞ
¼ ðlnWn ‐ lnW0 Þ=n  100 %
where Ln is the frond length of gametophytic blades that
have been cultured for n days (cm), L0 is the initial
length of the gametophytic blades, Wn is the fresh weight
of gametophytic blades that have been cultured for n days
(mg), and W0 is the initial fresh weight of gametophytic
blades. All 10 gametophytic blades of each line were measured, and the mean value was calculated by the Microsoft
Excel 2010 and was designated as the phenotypic value of
each line.
Quantitative trait locus (QTL) analyses
The mean phenotypic data of three replicates in different
trials from all 102 lines (include100 DH lines and their 2
parental lines) were analyzed for frequency distributions,
standard errors, coefficient of variation and ANOVA
using SPSS 10.0. The winQTLCart program ( was used for QTL
analysis, and the composite interval mapping (CIM)
method [45] was employed to detect any significant associations between each trait and marker loci. Significant
LOD thresholds for every trait were calculated by the permutation test of α < 0.05 and n = 1000 for significant linkages. Based on these permutations, a LOD score of 2.5
was used as a minimum to declare the presence of a QTL
in a particular genomic region.
Additional files
Additional file 1: Table S1. The genotypes of 4550 LP markers that
were mapped onto the genetic map. (XLSX 1645 kb)
Additional file 2: Table S2. The genotypes of 6731 LP markers.
(XLSX 2652 kb)
Additional file 3: Table S3. The markers located on the five linkage
groups and their genetic distances. (XLSX 87 kb)
Additional file 4: Table S4. The bin markers located on the five linkage
groups and their genetic distances. (XLSX 25 kb)
Additional file 5: Haplotype maps of the five linkage groups.
(RAR 143 kb)
Additional file 6: Heatmap of the five linkage groups. (RAR 151 kb)
Additional file 7: Table S5. Phenotypic traits of the 100 DH lines and
their parents. (XLSX 17 kb)
Competing interests
The authors declare that they have no competing interests.
Authors’ contributions
CX, YX and HZ designed and organized the entire project. YX, DJ and
LH performed the experiments. CX, YX, LH and CC analyzed the data.
CX and YX drafted the manuscript. All authors read and approved the
final manuscript.
Xu et al. BMC Plant Biology (2015) 15:228
Acknowledgements
This research was supported in part by the 863 Project of China (Grant No:
2012AA10A411), the National Natural Science Foundation of China (Grant
Nos: 41176151, 41276177), and the National Natural Science Foundation of
Fujian, China (Grant No: 2014 J07006).
Received: 17 April 2015 Accepted: 4 September 2015
References
1. Yoshida T, Notoya M, Kikuchi N, Miyata M. Catalogue of species of Porphyra
in the world, with special reference to the type locality and bibliography.
Nat Hist Res (Special Issue). 1997;3:5–18.
2. Sutherland J, Lindstrom S, Nelson W, Brodie J, Lynch M, Hwang M,
et al. A new look at an ancient order: generic revision of the
Bangiales. J Phycol. 2011;47:1131–51.
3. Sahoo D, Tang XR, Yarish C. Porphyra-the economic seaweed as a new
experimental system. Curr Sci. 2002;83:1313–6.
4. Blouin NA, Brodie JA, Grossma AC, Xu P, Brawley SH. Porphyra: a marine
crop shaped by stress. Trends Plant Sci. 2010;16:29–37.
5. Zhang XC, Qin S, Ma JH, Xu P. The genetics of marine algae. 1st ed. Beijing:
China agriculture press; 2005.
6. Chen CS, Xu Y, Xie CT, Ji DH, Liu PJ, Liang Y, et al. Preliminary study on mutation
breeding of Porphyra haitanensis lines. J Fisheries China. 2008;32:327–34
(in Chinese with English abstract).
7. Chen CS, Ji DH, Xie CT, Xu Y, Liang Y, Zhen YJ, et al. Preliminary study on
selecting the high temperature resistance strains and economic traits of
Porphyra haitanensis. Acta Oceanol Sin. 2008;30:100–6 (in Chinese with
English abstract).
8. Yan XH, Lv F, Liu CJ, Zheng YF. Selection and characterization of a hightemperature tolerant strain of Porphyra haitanensis Chang et Zheng
(Bangiales, Rhodophyta). J Appl Phycol. 2010;22:511–6.
9. Xu Y, Xie CT, Chen CS, Ji DH, Gao YH. Genetic analyses of six quantitative
traits of a doubled haploid population of Porphyra haitanensis Chang et
Zheng (Bangiales, Rhodophyta). J Appl Phycol. 2012;24:89–96.
10. Miura A. Genetic studies of cultivated Porphyra (Nori) improvement. Mar Sci.
1976;8:15–21.
11. Wu CY, Lin GH. Progress in the genetics and breeding of economic seaweeds
in China Hydrobiologia. 1987;151/152: 57-61.
12. James BH. Genetic architecture of complex traits in plants. Curr Opin Plant
Biol. 2007;10:156–61.
13. Narain P. Quantitative genetics: past and present. Mol Breeding. 2010;26:135–43.
14. Korol A, Shirak A, Cnaani A, Hallerman EM. Detection and analysis of quantitative
trait loci (QTL) for economic traits in aquatic species. In: Liu Z, editor.
Aquaculture genome technologies. Oxford: Blackwell; 2007. p. 169–97.
15. Yue GH. Recent advances of genome mapping and marker assisted selection
in aquaculture. Fish Fisheries. 2014;15:376–96.
16. Liu FL, Shao ZR, Zhang HN, Liu JD, Wang XL, Duan DL. QTL Mapping for
Frond Length and Width in Laminaria japonica Aresch (Laminariales,
Phaeophyta) Using AFLP and SSR Markers. Mar Biotechnol. 2010;12:386–94.
17. Davey JW, Hohenlohe PA, Etter PD, Boone JQ, Catchen JM, Blaxter ML.
Genome-wide genetic marker discovery and genotyping using nextgeneration sequencing. Nat Rev. 2011;12:499–510.
18. Sun X, Liu D, Zhang X, Li W, Liu H, Hong W, et al. SLAF-seq: an efficient
method of large-scale de novo SNP discovery and genotyping using
highthroughput sequencing. PLoS One. 2013;8:e58700.
19. Qi Z, Huang L, Zhu R, Xin D, Liu C, Han X, et al. A High-Density Genetic Map
for Soybean Based on Specific Length Amplified Fragment Sequencing.
PLoS One. 2014;9:e104871.
20. Zhang Y, Wang L, Xin H, Li D, Ma C, Ding X, et al. Construction of a highdensity
genetic map for sesame based on large scale marker development by specific
length amplified fragment (SLAF) sequencing. BMC Plant Biol. 2013;13:141.
21. Huang S, Ding J, Deng D, Tang W, Sun H, Liu D. Draft genome of the
kiwifruit Actinidia chinensis. Nat Commun. 2013;4:2640.
22. Xie CT, Chen CS, Xu Y, Ji DH. Construction of a genetic linkage map for
Porphyra haitanensis (Bangiales, Rhodophyta) Based on sequence-related
amplified polymorphism and simple sequence repeat markers. J Phycol.
2010;46:780–7.
23. West MA, Van Leeuwen H, Kozik A, Kliebenstein DJ, Doerge RW, St Clair DA,
et al. High-density haplotyping with microarray-based expression and single
feature polymorphism markers in Arabidopsis. Genome Res. 2006;16:787–95.
Page 11 of 11
24. Tseng CK, Sun A. Studies on the alternation of the nuclear phases and
chromosome numbers in the life history of some species of Porphyra from
China. Bot Marina. 1989;32:1–8.
25. Li YH, Yang YX, Liu JD, Wang XL, Gao TX, Duan DL. Genetic mapping of
Laminaria japonica and L. longissima using amplified fragment length
polymorphism markers in a “two-way pseudo-testcross” strategy. J Integr
Plant Biol. 2007;49:392–400.
26. Liu FL, Wang XL, Liu JD, Fu WD, Duan DL, Yang YX. Genetic mapping of the
Laminaria Japonica (Laminariales, Phaeophyta) using amplified fragment
length polymorphism markers. J Phycol. 2009;45:1228–33.
27. Yang GP, Sun Y, Shi YY, Zhang LN, Guo SS, Li BJ, et al. Construction and
characterization of a tentative amplified fragment length polymorphismsimple sequence repeat linkage map of Laminaria (Laminariales,
Phaeophyta). J Phycol. 2009;45:873–8.
28. Huang X, Feng Q, Qian Q, Zhao Q, Wang L, Wang A, et al. High-throughput
genotyping by whole-genome resequencing. Genome Res. 2009;19:1068–76.
29. Yu H, Xie W, Wang J, Xing Y, Xu C, Li X, et al. Gains in QTL detection using
an ultra-high density SNP map based on population sequencing relative to
traditional RFLP/SSR markers. PLoS One. 2011;6:e17595.
30. Zou G, Zhai G, Feng Q, Yan S, Wang A, Zhao Q, et al. Identification of QTLs
for eight agronomically important traits using an ultra-high-density map
based on SNPs generated from high-throughput sequencing in sorghum
under contrasting photoperiods. J Exp Bot. 2012;63:5451–62.
31. Chen ZL, Wang BB, Dong XM, Liu H, Ren LH, Chen J, et al. An ultra-high
density bin-map for rapid QTL mapping for tassel and ear architecture in a
large F2 maize population. BMC Genomics. 2014;15:433.
32. Würschum T. Mapping QTL, for agronomic traits in breeding populations.
Theor Appl Genet. 2012;125:201–10.
33. Xu Y. Construction of a genetic linkage map and QTL analysis of important
traits in Porphyra haitanensis [D]. Xiamen: Xiamen University of China; 2010.
34. Collard BCY, Jahufer MZZ, Brouwer JB, Pang ECK. An introduction to
markers, quantitative trait loci (QTL) mapping and marker-assisted selection
for crop improvement: the basic concepts. Euphytica. 2005;142:169–96.
35. Pflieger S, Lefebvre V, Causse M. The candidate gene approach in plant
genetics: a review. Mol Breed. 2001;7:275–91.
36. Wang SJ, Zhang XP, Xu ZD, Sun YL. Studies on the cultivation of the
vegetative cells and protoplasts of Porphyra haitanensis Chang et Zheng.
Ocean Limnol Sin. 1986;17:217–21 (in Chinese with English abstract).
37. Zeng GQ, Liu BQ, Yang R, Luo QJ, Wang YJ. Morphogeny of conchocelis
thalli from single somatic cell clone cultivation of Porphyra haitanensis.
J Fishery Sci China. 2004;11:549–53 (in Chinese with English abstract).
38. Joseph S, David WR. Molecular Cloning: A laboratory manual. 3rd ed. New
York: Cold Spring Harbor Laboratory Press; 2001.
39. Kent WJ. BLAT–the BLAST-like alignment tool. Genome Res. 2002;12:656–64.
40. Stam P. Construction of integrated genetic linkage maps by means of a
new computer package, Joinmap. Plant J. 1993;3:739–44.
41. Liu DY, Ma CX, Hong WG, Huang L, Liu M, Liu H, et al. Construction and
analysis of high-density linkage map using high-throughput sequencing
data. PLoS One. 2014;9:e98855.
42. Wu Y, Bhat PR, Close TJ, Lonardi S. Efficient and accurate construction of
genetic linkage maps from the minimum spanning tree of a graph. PLoS
Genet. 2008;4:e1000212.
43. Van OSH, Stam P, Visser RG, van Eck HJ. SMOOTH: A statistical method for
successful removal of genotyping errors from high-density genetic linkage
data. Theor Appl Genet. 2005;112:187–94.
44. Kosambi DD. The estimation of map distance from recombination values.
Ann Eugen. 1944;12:172–5.
45. Zeng ZB. Precision mapping of quantitative trait loci. Genetics. 1994;136:1457–68.