Nitrogen-driven stem elongation in poplar is linked with wood modification and gene clusters for stress, photosynthesis and cell wall formation
Bạn đang xem bản rút gọn của tài liệu. Xem và tải ngay bản đầy đủ của tài liệu tại đây (1.68 MB, 13 trang )
Euring et al. BMC Plant Biology (2014) 14:391
DOI 10.1186/s12870-014-0391-3
RESEARCH ARTICLE
Open Access
Nitrogen-driven stem elongation in poplar is
linked with wood modification and gene clusters
for stress, photosynthesis and cell wall formation
Dejuan Euring, Hua Bai, Dennis Janz and Andrea Polle*
Abstract
Background: Nitrogen is an important nutrient, often limiting plant productivity and yield. In poplars, woody crops
used as feedstock for renewable resources and bioenergy, nitrogen fertilization accelerates growth of the young,
expanding stem internodes. The underlying molecular mechanisms of nitrogen use for extension growth in poplars
are not well understood. The aim of this study was to dissect the nitrogen-responsive transcriptional network in the
elongation zone of Populus trichocarpa in relation to extension growth and cell wall properties.
Results: Transcriptome analyses in the first two internodes of P. trichocarpa stems grown without or with nitrogen
fertilization (5 mM NH4NO3) revealed 1037 more than 2-fold differentially expressed genes (DEGs). Co-expression analysis
extracted a network containing about one-third of the DEGs with three main complexes of strongly clustered genes.
These complexes represented three main processes that were responsive to N-driven growth: Complex 1 integrated
growth processes and stress suggesting that genes with established functions in abiotic and biotic stress are also
recruited to coordinate growth. Complex 2 was enriched in genes with decreased transcript abundance and
functionally annotated as photosynthetic hub. Complex 3 was a hub for secondary cell wall formation connecting
well-known transcription factors that control secondary cell walls with genes for the formation of cellulose,
hemicelluloses, and lignin. Anatomical and biochemical analysis supported that N-driven growth resulted in
early secondary cell wall formation in the elongation zone with thicker cell walls and increased lignin. These alterations
contrasted the N influence on the secondary xylem, where thinner cell walls with lower lignin contents than in unfertilized
trees were formed.
Conclusion: This study uncovered that nitrogen-responsive elongation growth of poplar internodes is linked with abiotic
stress, suppression of photosynthetic genes and stimulation of genes for cell wall formation. Anatomical and biochemical
analysis supported increased accumulation of cell walls and secondary metabolites in the elongation zone. The finding of
a nitrogen-responsive cell wall hub may have wider implications for the improvement of tree nitrogen use efficiency and
opens new perspectives on the enhancement of wood composition as a feedstock for biofuels.
Keywords: Development, Metaxylem, Nitrogen use, Populus trichocarpa, Stress, Transcriptome, Wood, Xylem
Background
Woody biomass is a valuable resource for the generation
of renewable energy and an important feedstock for fiber,
pulp and cellulose production [1-3]. It is formed during
the process of secondary growth. The molecular regulation of secondary growth is intensively being studied in
poplar and in the model plant Arabidopsis thaliana [4-9].
* Correspondence:
Forest Botany and Tree Physiology, Georg-August Universität Göttingen,
Büsgenweg 2, 37077 Göttingen, Germany
For example, cell differentiation in the vascular cambium
is determined by auxin, auxin transporters, and auxinresponsive transcription factors [7,10]. Furthermore, transcriptional regulation involves members of the AUXIN
RESPONSE FACTOR (ARF), MYB, NAC, and WRKY gene
families [11-14] whose interplay eventually determines the
amounts of cellulose, hemicellulose, and lignin produced
during secondary cell wall formation [7].
The prerequisite for secondary growth is primary growth
and shoot elongation. The molecular regulation of cell division and differentiation have mainly been addressed in
© 2014 Euring et al.; licensee BioMed Central. This is an Open Access article distributed under the terms of the Creative
Commons Attribution License ( which permits unrestricted use, distribution, and
reproduction in any medium, provided the original work is properly credited. The Creative Commons Public Domain
Dedication waiver ( applies to the data made available in this article,
unless otherwise stated.
Euring et al. BMC Plant Biology (2014) 14:391
Arabidopsis [15,16]. In the shoot apical meristem the transcription factors WUSCHEL (WUS) [17], CLAVATA (CLV),
SHOOT MERISTEMLESS (STM) [18], and KNOX [19]
have been identified as key actors in the control of the size
of stem cell population and production of new cell files.
They are regulated by hormones, like cytokinins, gibberellin
and auxin [20]. Gradients of auxin and signaling peptides
are important during the early steps of vascular development [7]. During primary growth, proto- and metaxylem
elements are formed. Their differentiation is controlled by
transcription factors of the VND (VASCULAR-RELATED
NAC DOMAIN) family, VND7 and VND6 [21]. VNDs regulate down-stream transcription factors, especially MYB46
which plays a major role for the orchestration of biosynthetic genes for secondary cell wall formation [22-26].
Although primary growth that drives the elongation of
the newly formed internodes is as important for wood
production as secondary growth, very little is known
about the molecular regulation underlying these developmental processes in poplars.
With regard to yield improvement, molecular links between primary growth and nitrogen (N) are of particular
interest. Low N frequently limits productivity and consequently, fertilization can enhance yield [27]. Increased
N availability results in enhanced leaf area production,
increased photosynthesis and higher stem biomass production in poplars [28,29]. However, the wood of fertilized
poplars is often characterized by thinner cell walls, less
lignification, and increased amounts of tension wood
[30-35]. In the developing xylem, key transcription factors
for wood formation such as WKRY and NAC domain factors were decreased in hybrid poplars exposed to high
(7.5 mM NH4NO3) compared with those grown with adequate N supply (0.75 mM NH4NO3, [36]). Furthermore,
the expression levels of several genes involved in hemicellulose and lignin biosynthesis were also reduced, while
cellulose synthase increased under high compared with
adequate N [36]. The observed transcriptional changes
matched alterations in cell wall properties, for example
the shift to lower lignin and higher cellulose concentrations in the wood of fertilized compared with nonfertilized poplars [36]. In contrast to radial growth, the
influence of N on gene regulation during stem elongation has not been investigated. It is unknown whether
high N mainly accelerates primary growth processes
such as extension or whether it also impacts on cell
wall properties. Understanding the molecular mechanisms of plant N usage for increased wood production
and the consequences for wood properties is urgently
needed.
In this study, we analyzed the genome-wide transcriptional responses to N fertilization in the elongation zone
(EZ) of P. trichocarpa. We conducted co-expression analysis to establish networks of signaling, regulatory and
Page 2 of 13
functional genes underlying N-responsive stem growth.
We dissected three main regulatory complexes that represent phytohormone-related development, regulation
of photosynthesis and cell wall formation as the main
processes underlying N-driven elongation growth. Because the transcriptional analysis predicted stimulation
of the secondary metabolism in the EZ of N fertilized
compared to unfertilized poplars, lignin and phenolic
concentrations were also determined.
Methods
Plant material, growth conditions and treatment
Twenty-four Populus trichocarpa, cultivar Weser 6
(Kompetenzzentrum HessenRohstoffe, Germany) cuttings
were planted in 5 L pots with 20% compost soil and 80%
sand at the end of April, 2009. The cuttings were cultivated
in a greenhouse for 2 months under long-day conditions
(16 hours light from 6:00 a.m. to 10:00 p.m) with a photosynthetically active radiation (PAR) of 150 μmol · m−2 · s−1
(fluorescent lamps L58W/25 and 58 W/840, Osram,
Munich, Germany, and TLD 58 W/840 Philips, Amsterdam,
Netherlands). Afterwards, the plants were divided into two
groups, of similar average height. One group was fertilized
with 120 ml 5 mM NH4NO3 (HN); the other group received
the same amount of tap water (LN). Both groups were irrigated twice a week for 1.5 months. At the harvest, the height
and basal stem diameter were measured with a folding ruler
and a caliper (Tchibo GmbH, Hamburg, Germany). The
total fresh weight of leaves, stems and roots were weighed.
Two to three centimeter-long basal stem segments were
stored in FAE (2% (v/v) formaldehyde, 5% (v/v) acetic acid,
63% (v/v) ethanol). Preliminary analyses of growth showed
that elongation was confined to the first 5 to 7 internodes.
Here, the first two internodes from the top including shoot
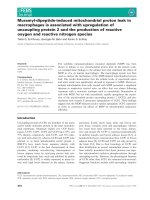
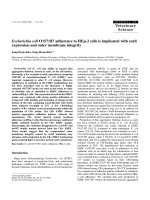
apex were harvested and called elongation zone (EZ). Developing xylem was harvested from a 10 cm long stem segment at the bottom (Figure 1). The surface of debarked
wood was scraped with a razor blade as described previously
[37,38]. The samples, which consisted of a soft mush of
tissue, were shock-frozen in liquid nitrogen and stored
at −80°C. Aliquots of fresh leaves, stems and roots were
weighed, oven dried at 60°C for 2 weeks and weighed
again. Total dry biomass of leaves, stems and roots were
calculated as: dry mass of aliquot × whole plant tissue
fresh mass/fresh mass of the aliquot.
Anatomical analyses
The second internodes counted from the top and bottom stem segments were fixed in FAE for one week, and
transferred into plastic bottles with 70% ethanol for several days. Cross-sections (50 μm) were obtained with a
sliding microtome (Reichert-Jung, Heidelberg, Germany).
The sections were stained with Wiesner reagent (5.25 g
phloroglucinol, 350 ml 95% ethanol, 175 ml 25% HCl) for
Euring et al. BMC Plant Biology (2014) 14:391
Page 3 of 13
Figure 1 Performance of poplars (P. trichocarpa) after 6 week of growth without or with addition of 5 mM NH4NO3. Stem positions used
for sample collection are indicated.
3 min [39] and mounted in 50% glycerol for microscopy.
Sections were immediately viewed under a light microscope (Axioplan, Zeiss, Oberkochen, Germany) and
photographed with 400-fold magnification using a digital
camera (AxioCamMR3, Zeiss, Oberkochen, Germany).
The image analysis software Image J (.
gov/ij/; NIH, Bethesda, Maryland, USA) was used to
measure the thickness of the double fiber walls and vessel lumen areas.
Cross sections of 10-μm thickness from the second internode counted from the top and bottom stem segments
(liquid nitrogen shock frozen samples) were obtained
with a cryo-microtome (Reichert-Jung, Model 2800 Frigocut
N, Leica Instruments GmbH, Nussloch, Germany). The
sections were immediately mounted in 50% glycerol for
microscopy. Sections were immediately viewed under UV
light (filters: BP 546, FT580, LP590) with a light microscope (Axioplan, Zeiss, Oberkochen, Germany) and
photographed with 400-fold magnification using a digital
camera (AxioCamMR3, Zeiss, Oberkochen, Germany).
Phenolic compounds showed blue and chloroplasts red
fluorescence. Defined areas of 1000 μm2 were selected
to count chloroplasts.
Lignin, phenolics and nitrogen analyses
To measure phenolics, frozen plant tissues were ground
in a ball mill (Retsch, Haan, Germany). Fine powder
(60 mg per sample) was extracted with 2 ml of 50%
methanol in an ultrasonic bath (60 min, 40°C; Sonorex
Super RK 510 H, Bandelin electronics, Berlin, Germany).
The extract was centrifuged, the pellet was extracted
once again in the dark in 2 ml of 50% methanol at room
temperature for 60 min and the supernatants were combined for photometrical analysis of soluble phenolics with
the Folin Ciocalteus method [31]. Catechin (Sigma-Aldrich,
Deisenhofen, Germany) was measured to create a calibration curve and the phenolic concentrations were expressed
as catechin equivalents.
Dry plant tissues were milled to a fine powder (MM2
Retsch, Haan, Germany) for the determination of lignin
and nitrogen concentrations. To determine lignin, one to
four mg dry powder materials were mixed with 25% acetyl
bromide in acetic acid. The reaction tubes were incubated
at 70°C for 30 min with shaking at 10 min intervals. After
digestion, 250 μl sodium hydroxide (2 M) was added. After
mixing, the reaction tubes were centrifuged with 15000 ×
g for 5 min at 4°C. The supernatant (138 μl) was added to
new reaction tubes with 2.8 μl hydroxylamine (0.5 M) and
1.25 ml acetic acid (96%). A concentration series of coniferyl alcohol, analyzed with the same procedure as the
analytical samples, was done to create a standard curve.
The absorbance of the resulting solutions was measured at
280 nm after [40].
To determine nitrogen concentrations, aliquots of
0.7 - 0.9 mg dry milled powder were weighed (Sartorius
Supermicro S4, Göttingen, Germany) into tin capsules
(Hekatech, Wegberg, Germany) and analyzed in an
Elemental Analyzer EA1108 (Carlo Erba Strumentazione,
Rodano, Italy). Acetanilide (71.09% C, 10.36% N; Carlo
Erba Strumentazione) was the standard.
Independent two-sample t-tests were carried out in
Microsoft Excel to test whether means were significantly
different at P < 0.05.
RNA extraction and cDNA preparation
Shock frozen tissue of the EZ was ground in a pre-cooled
ball mill (Retsch, Hann, Germany). Total RNA was extracted
from 1 g tissue powder using hexadecyltrimethylammonium
Euring et al. BMC Plant Biology (2014) 14:391
bromide extraction protocol [41]. The quantity and quality
of total RNA were determined with a spectrophotometer
(BioPhotometer, Eppendorf, Hamburg, Germany) by determining the ratio of absorbance of the sample at 260 nm
to that of 280 nm. To remove DNA, 10 μg preparations
was treated with DNase (Turbo DNA-free kit, Ambion,
Austin, TX) at 37°C for 30 min according to the manufacturer’s instructions of Turbo DNA-free kit. DNase-treated
total RNA (5 μg) was used as starting material for
double-stranded cDNA synthesis using Oligo(dT)18
primer and RevertAid™ First Strand cDNA Synthesis Kit
(MBI Fermentas, St. Leon-Rot, Germany) according to the
manual.
Page 4 of 13
GSE13109, GSE13990, GSE15242, GSE15595, GSE16420,
GSE16459, GSE16495, GSE16786, GSE16888, GSE17223,
GSE17225, GSE17226, GSE17230, GSE17804, GSE19279,
GSE19467, GSE20061, GSE21061, GSE21171, GSE9673)
which are studies using poplar and analyzing wood formation, growth, development, and the responses to nitrogen limitation and drought ( />Gene co-expression relationships were visualized in Cytoscape 3.1.1 [44]. Sub-clusters (= complexes) in networks
were identified with Cytocluster applying the NonOverlapping algorithm and complex size threshold 3 (http://apps.
cytoscape.org/apps/cytocluster).
Results
Microarrays and data analysis
Two biological samples of EZ were pooled. Three independent samples (representing 6 plants) of total RNA
were prepared for whole-genome Affymetrix GeneChip
microarray analysis. The quality of RNA was examined by
MFTServices (Tübingen, Germany). WT-Ovation Pico
RNA Amplification System (NuGen, San Carlos, CA)
was used to amplify 50 ng total RNA to produce labeled cDNA. Six cDNA sets were hybridized to Poplar
Genome Arrays (three arrays for LN and 3 arrays for
HN plants) according to the manufacturer’s protocol
(Affymetrix, Santa Clara, CA, USA). The microarray
data set supporting the results of this article is available under the ArrayExpress accession number E-MTAB1483, />E-MTAB-1483/. Gene expression analysis was performed
with R Project software package, version 2.10.1 (http://www.
R-project.org). cDNA Microarray data were normalized
across the six arrays using Bioconductor - Robust Multiarray
Averaging (RMA). Transcription levels of HN plants
were compared to LN plants. Genes with var < 0.5 was
removed. Significance Analysis of Microarrays (SAM)
was performed to calculate p-values. Differentially expressed
genes (DEGs) with fold change ≥ 2 and p-value ≤ 0.05
after Benjamini-Hochberg correction were annotated
using Poparray ( for JGI
poplar gene models and predicted Arabidopsis homologs.
The differentially presented Gene Ontology (GO) categories were identified in Popgenie v3.0 ( />using the Analysis Tool GO enrichment. Enrichment analysis of MapMan categories [42] was conducted with
Superviewer ( />classification_superviewer.cgi) calculating the mean and
SD for 100 bootstraps of the input set (duplicates allowed)
and the p of the hypergeometric distribution [43]. Gene
coexpression relationships were calculated for the DEGs
with the Analysis Tool PopNet in Popgenie v3.0 (http://
popgenie.org/) with a display threshold of 7 and an expand threshold of 3. The coexpression analysis was based
on microarray data from 21 experiments (GSE12152,
Nitrogen accelerates stem elongation and biomass
production
P. trichocarpa plants were grown either without additional N (LN) or supplied with 5 mM NH4NO3 (HN).
The fertilized poplars showed 1.4 times faster stem elongation rates than non-fertilized plants (Table 1) resulting in
taller plants after 6 weeks of N treatment (Figure 1).
N-induced growth stimulation also resulted in about
20% thicker stem diameter and almost doubled stem
biomass compared to non-fertilized plants (Table 1).
All stem tissues of HN poplars contained higher N
concentrations than those of LN plants (Table 1).
N-responsive stem elongation growth at the
transcriptional level
To investigate the molecular basis of the N-accelerated
elongation growth, transcriptome analyses were conducted
in the EZ of HN and LN poplars. N fertilization resulted in
1037 differentially expressed genes (DEGs based on Populus v3Best Gene Models corresponding to 1208 Affymetrix
Table 1 Growth, biomass and nitrogen concentrations of
Populus trichocarpa
Parameter
LN
HN
P
Height increment (cm d−1 )
0.83 ± 0.02
1.16 ± 0.03
<0.001
Stem diameter (mm)
5.35 ± 0.15
6.40 ± 0.14
<0.001
Biomass of stem (g plant−1)
2.31 ± 0.09
4.06 ± 0.17
<0.001
Biomass of leaves (g plant−1)
4.43 ± 0.24
7.17 ± 0.35
<0.001
Biomass of roots (g plant−1)
1.45 ± 0.13
1.67 ± 0.24
0.215
−1
Total biomass (g plant )
8.49 ± 0.43
13.26 ± 0.64
<0.001
N in EZ (%)
2.03 ± 0.08
3.70 ± 0.15
<0.001
N in developing xylem (%)
0.55 ± 0.03
1.59 ± 0.08
<0.001
N in wood (%)
0.18 ± 0.02
0.42 ± 0.10
0.033
N in bark (%)
0.38 ± 0.06
1.03 ± 0.16
0.004
Populus trichocarpa were grown under low (LN) and high (HN) nitrogen
conditions. Data are means ± SE of 12 biological replicates. Independent twosample t-tests were used to test the differences between the means of HN
and LN plants. Height increment was determined during the period of N
fertilization. Stem diameter and dry biomass were determined at plant harvest.
Euring et al. BMC Plant Biology (2014) 14:391
IDs) with more than 2-fold significantly changed transcript
levels in the EZ (Additional file 1: Table S1). GO term enrichment analysis revealed 24 significant Plant GO Slim categories for the N-responsive DEGs in the EZ (Table 2).
From this list we deduced that processes related to cell wall
formation were particularly prominent because we found
GO terms related to “cell death” and “carbohydrate metabolism” in the category of biological processes and terms
indicative for the extracellular compartment such as “cell
wall”, “external encapsulating structure” and “proteinaceous
extracellular matrix” in the category “cellular component”.
In the category molecular function, the terms “kinase activity”, “signal transducer activity”, “RNA binding” and “receptor activity” pointed to signaling and transcriptional
regulation as major activities in the EZ (Table 2).
An N-responsive gene network in the elongation zone
To find key pathways for the N regulation of elongation
growth, the 1037 N-responsive DEGs in the EZ of the
poplar stem were investigated with the PopNet tool in
Page 5 of 13
Popgenie v3.0. This analysis resulted in an N-responsive
network with 392 nodes (= genes) connected by 1863
edges (= significant co-expression relationships) (Additional
file 2: Table S2, Additional file 3: Figure S1). When the network was dissected into its subclusters, fourteen complexes
(subclusters) were obtained. While most of these complexes were small consisting only of 3 to 12 nodes that were
connected by 2 to 23 edges, three main complexes
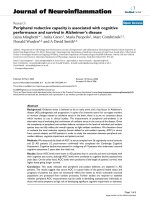
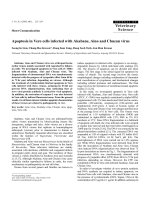
were retrieved: complex 1 (92 nodes, 364 edges), complex 2 (57 nodes, 740 edges) and complex 3 (54 nodes,
547 edges) (Figure 2). These complexes were also clearly
apparent in the original network, in which complex 2 and
complex 3 were connected through complex 1 (Additional
file 3: Figure S1).
The clustering coefficients of complex 2 (0.73) and
complex 3 (0.82) were higher than that of complex 3
(0.51) (Table 3). Average connectivity of a node in the
complex 2 and complex 3 were more than 20 neighbours, while about 8 neighbours were present for a node
in complex 1 (Table 3). A histogram of the edges per
Table 2 Significantly enriched gene ontology (GO) terms in the elongation zone of Populus trichocarpa
P value (FDR)
GO identity
Category
Description
ClusterFreq
TotalFreq
GO:0019538
P
protein metabolic process
GO:0009987
P
cellular process
<0.001
73/494
3727/14903
<0.001
227/494
8214/14903
GO:0006412
P
Translation
GO:0006464
P
cellular protein modification process
0.002
5/494
567/14903
0.003
47/494
2227/14903
GO:0008219
P
GO:0016265
P
cell death
0.013
8/494
605/14903
Death
0.013
8/494
605/14903
GO:0005975
P
carbohydrate metabolic process
0.018
50/494
998/14903
GO:0003824
F
catalytic activity
<0.001
401/618
10616/19350
GO:0005515
F
protein binding
<0.001
92/618
4123/19350
GO:0005198
F
structural molecule activity
<0.001
3/618
548/19350
GO:0005488
F
Binding
0.004
352/618
12290/19350
GO:0016301
F
kinase activity
0.011
46/618
2150/19350
GO:0003676
F
nucleic acid binding
0.017
72/618
3014/19350
GO:0000166
F
nucleotide binding
0.019
112/618
4388/19350
GO:0004871
F
signal transducer activity
0.023
5/618
448/19350
GO:0003723
F
RNA binding
0.035
6/618
461/19350
GO:0004872
F
receptor activity
0.060
3/618
298/19350
GO:0005840
C
Ribosome
0.004
2/162
469/6012
GO:0016020
C
Membrane
0.012
59/162
1584/6012
GO:0030312
C
external encapsulating structure
0.014
10/162
142/6012
GO:0005618
C
cell wall
0.014
10/162
142/6012
GO:0005576
C
extracellular region
0.025
5/162
52/6012
GO:0005622
C
Intracellular
0.026
17/162
1144/6012
GO:0005578
C
proteinaceous extracellular matrix
0.035
3/162
22/6012
Plant GOSlim terms were analyzed in Popgenie v3.0 ( using the Analysis Tool GO enrichment (P value < 0.05, FDR adjusted). The input was
the list of genes with significantly changed transcript levels in response to fertilization with 5 mM NH4NO3 for 1.5 month compared with non-fertilized plants. GO
terms are indicated for biological processes (P), molecular functions (F) and cellular components (C). ClusterFreq and TotalFreq indicate the number of genes for a
GO term found in the sample set and in the total genome, respectively.
Euring et al. BMC Plant Biology (2014) 14:391
Page 6 of 13
Figure 2 Three main complexes of an N-responsive network in the elongation zone of P. trichocarpa. Gene-gene relationships were obtained
in Popgenie v3.0 ( using the PopNet tool. The network was visualized in Cytoscape.
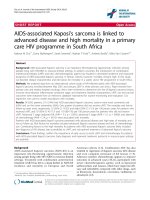
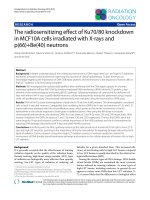
node revealed the maximum numbers of genes in the
class of 21 to 30 for complex 2 and 31 to 40 edges for
complex 3 underpinning the strong connectivity of these
complexes (Figure 3). In complex 1 the highest node
connectivity was 21 to 30 edges per node, but the maximum number of nodes was in the category with the
lowest connectivity (1 to 5 edges per node) (Figure 3).
The genes with the highest connectivity included a
homolog to PAD4, a lipase involved in plant immune
response and fitness [45] in complex 1 (26 edges), a
scarcely defined nucleotide binding protein with functions
in chloroplast metabolism [46] in complex 2 (48 edges)
and a cellulose synthase [47] in complex 3 (37 edges)
(Additional file 4: Table S3).
To investigate whether the three complexes represent
functional units we conducted Mapman analyses for the
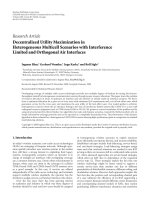
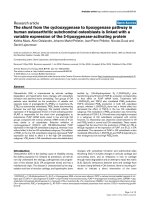
genes in each complex. A total of 14 significant categories for the DEGs in complex 1, complex 2 and complex
3 of the N-responsive network were identified (Figure 4).
Complex 1 was enriched in the categories “hormone
metabolism”, mainly because of several auxin-related
genes, and further genes related to other plant growth
hormones (gibberellin-, jasmonate- brassinosteroide- and
ethylene-related genes), “development” (NAC factors
ANAC047 and ANAC061, Late embryogenesis abundant hydroxyproline-rich glycoprotein family), “RNA”
with transcription factors related to stress and development (WRKY18, WRKY26, WRKY33, WRKY40, HB07),
“stress”, mainly with drought stress-related genes such as
DREB, OSMOTIN, DnaJ, PAD4, ZAT10)” and “transport”
(nucleotide-sugar transporter, ABC type transporters
and amino acid transporters) (Figure 4, Additional file 2:
Table S2).
Both complex 1 and complex 3 were enriched in the category “cell wall”, but with genes indicating divergent functions in the two complexes. In complex 1, genes encoding
proteins for hemicellulose and pectin metabolism were
enriched (e.g. arabinogalactan protein 26, SNF1-related
protein kinase, β-xylosidase 1, xyloglucan endotransglucosylase/hydrolase 15, xyloglucan endotransglycosylase 6,
Euring et al. BMC Plant Biology (2014) 14:391
Page 7 of 13
Table 3 Network characteristics of three identified main
complexes
Parameter
Complex
1
Complex
2
Complex
3
Clustering coefficient
0.51
0.73
0.82
Net diameter
7
3
4
Net radius
4
2
2
Net centrality
0.20
0.41
0.41
Shortest path
8372
3192
2862
Characteristic path length
2.85
1.56
1.80
Mean number of neighbors
7.9
26.0
20.3
Nodes
92
57
54
Net density
0.09
0.46
0.38
Net heterogeneity
0.74
0.46
0.63
Edges
364
740
547
Number of Arabidopsis matches in
the nodes
90
57
52
Networks were generated in Popgenie v3.0 ( with the
significantly regulated genes in the elongation zone of P. trichocarpa. Network
parameters were calculated with Cytoscape.
expansin). In complex 3, “cell wall” and “secondary
metabolism” genes typically involved in the formation
of cellulose (cellulose synthases IRX1, IRX 3, IRX5) and
phenolic compounds including lignin (peroxidases, laccases, pinoresinol reductase) such as, IRX 6, IRX 8, IRX 9,
IRX 12, IRX 15, and related transcription factors MYB46
and MYB56 were overrepresented (Figure 4, Additional
file 2: Table S2).
complex 1
complex 2
complex 3
Number of genes
40
30
20
Complex 2 showed a compositional pattern that differed
strongly from complex 1 and 3 with significant enrichments
in the categories “photosynthesis” (some nuclear encoded
genes for light reaction and Calvin cycle)”, “co-factor
and vitamin metabolism” (thiazole and thiamin production) and “fermentation” (aldehyde dehydrogenase)
(Figure 4). It was furthermore notable that most of the
DEGs in complex 2 were suppressed, whereas those in
the complexes 1 and 3 showed in increased transcript
abundance. Counting of chloroplasts in selected areas
of the cross sections suggested that the suppression of
photosynthetic genes was not linked with a reduction
in the number of chloroplasts (35 ± 13 chloroplasts per
1000 μm2 and 27 ± 12 chloroplasts per 1000 μm2 , P =
0.220) in HN compared with LN poplars.
N fertilization increases the concentrations of lignin and
phenolic compounds in the poplar elongation zone
Because genes related to secondary metabolism were
overrepresented in complex 3, we tested whether the
concentrations of lignin or soluble phenolic concentrations differed between the EZ from HN and LN poplars.
The EZ of HN poplars contained higher concentrations
of lignin and phenolics than that of LN poplars (Table 4).
Cross sections that were stained for lignin supported an
increased production of primary xylem with strong incorporation of lignin and secondary compounds in HN
grown poplars compared with LN poplars (Figure 5).
This finding was surprising because previous studies
reported decreased lignin concentrations in wood of
poplars grown with high N supply [34-36]. Therefore,
we also determined lignin and soluble phenolics in lower
stem parts. In concordance with earlier studies, we found
decreased concentrations of lignin and phenolics in the developing xylem (Table 4). In wood from the lower stem
segment, the differences were not significant, but those tissues had mainly been formed before the N treatment
started. The autofluorescence of phenolics and lignin staining of the cross sections in the area of secondary wood formation supported the biochemical analyses and indicated
reduced or delayed incorporation of secondary metabolites
into the cell walls of the HN poplars (Figure 6).
The linkage of N metabolism genes and N-responsive
network
10
0
1-5
6-10
11-20
21-30
31-40
41-50
Connection times
Figure 3 Histogram of the number of neighbors for the genes
in the main complexes of an N-responsive gene network in the
elongation zone of P. trichocarpa. The histogram classifies the
number of edges in the three complexes and revealed differences
for the distribution of genes in complex 1 compared with complex
2 or complex 3.
High N supply increased the N concentrations in all stem
tissues including the EZ (Table 1). Still, “N metabolism”
was not identified as a significant Mapman or GO term,
but the term “amino acid metabolism” was significantly
enriched on the basis of all DEGs (Additional file 2:
Table S2). The list of N-related DEGs also contained
nitrate reductase PtNIA2.2 (Potri.005G172400), nitrite
reductase PtNIR1.1 (Potri.004G140800), various transporters for N-containing cargo [high affinity nitrate
Euring et al. BMC Plant Biology (2014) 14:391
Page 8 of 13
80
Normarlized to frequency
60
Complex 1
Complex 2
Complex 3
40
20
4
2
0
-2
-4
-6
m ein
all
ed DNA misc port RNA ress ent lism PS lism tion
o
olis prot ell w sign
ta
st lopm abo
ns
c
tab en
tab
t
tra
as
e
e
t
me ferm
m
o
ev y me
n
d
e
e
n
ar
on
mi
nd
rm
co
vita
ho
se
nd
a
r
cto
-f a
Co
Figure 4 Significantly enriched and depleted MapMan categories in the main complexes of an N-responsive gene network in the
elongation zone of P. trichocarpa. Genes identified in main complexes of the N-responsive network of the poplar elongation zone were
assigned to the best Arabidopsis matches (AGI numbers) using Poparray ( and categorized with Superviewer.
Data are means ± SD for 100 bootstraps of the initial data set. Stars indicate: *p < 0.05, **p < 0.01, ***p < 0.001.
transporter PtNRT2.7 (Potri.001G348300), ammonium
transporter PtAMT1-6 (Potri.009G045200), three amino acid
transporters (Potri.010G226000, PtAAT1.1 (Potri.012G131300),
PtLHT1.2 (Potri.001G335300), amino acid permease
(Potri.003G103600)]. Among these genes, four were present
in complex 1, of which two amino acid transporters
(PtAAT1.1, PtLHT1.2) and a biosynthetic gene encoding a
lysine-ketoglutarate reductase/saccharopine dehydrogenase
(Potri.006G134200) were up-regulated, while a putative
chorismate/shikimate dehydrogenase (Potri.014G135500)
was down-regulated. Overall, the transcript abundances of
the majority of the N-related genes (15/22) were decreased
Table 4 Chemical and anatomical characteristics of stem tissues of P. trichocarpa grown without (LN) or with nitrogen
fertilization (HN) for 1.5 months
Tissue
Parameter
LN
HN
p
EZ
Lignin (%)
17.61 ± 1.50
21.28 ± 0.78
0.037
Soluble phenolics (μg mg−1)
5.96 ± 0.52
7.89 ± 0.54
0.022
2
Developing Xylem
Wood
Lumen per vessel (μm )
189.0 ± 13.0
478.1 ± 32.9
<0.001
Cell wall thickness of vessels (μm)
1.80 ± 0.15
2.20 ± 0.13
0.021
FW/DW
5.10 ± 0.18
5.51 ± 0.06
0.035
Lignin (%)
11.43 ± 1.02
8.45 ± 1.33
0.063
Soluble phenolics (μg mg−1)
0.86 ± 0.13
0.55 ± 0.08
0.045
Lumen per vessel (μm2)
221.0 ± 32.5
600.6 ± 51.2
0.008
Cell wall thickness of vessels (μm)
1.89 ± 0.12
1.74 ± 0.14
0.212
FW/DW
3.15 ± 0.42
5.17 ± 0.24
0.003
Lignin (%)
24.55 ± 1.67
21.89 ± 1.39
0.134
FW/DW
2.23 ± 0.09
2.45 ± 0.12
0.100
Vessel lumen area (μm )
940.7 ± 53.0
1459.6 ± 81.1
<0.001
Fiber double wall thickness (μm)
4.36 ± 1.32
3.44 ± 1.38
<0.001
2
Data are mean ± SE of 5 biological replicates. Independent two-sample t-tests were used to test the differences between the means for HN and LN plants.
FW/DW = dry to fresh mass ratio.
Euring et al. BMC Plant Biology (2014) 14:391
Page 9 of 13
Figure 5 Cross sections of the elongation zone of P. trichocarpa in response to low nitrogen (A, C) and high nitrogen (B, D) supply.
Lignin staining (A, B) of cross sections (50 μm thickness); autofluorescence of phenolics (C, D) in cross sections (10 μm thickness). The cross
sections were taken in the second internode counted from the stem apex. The scale bars correspond to 50 μm.
Figure 6 Cross sections of in zone of secondary wood formation in stems of P. trichocarpa in response to low nitrogen (A, C) and high
nitrogen (B, D) supply. Lignin staining (A, B) of cross sections (50 μm thickness); autofluorescence of phenolics (C, D) in cross sections (10 μm
thickness). The cross sections were taken in the second internode counted from the stem bottom. The scale bars correspond to 50 μm.
Euring et al. BMC Plant Biology (2014) 14:391
under HN compared with LN conditions (Additional file 2:
Table S2).
Discussion
N-responsive cell wall formation in the poplar elongation
zone
N plays a role as a signal to regulate plant gene expression for growth and development [48,49]. Changes in N
availability are sensed by plants rapidly in time scales of
minutes to days [50,51]. Therefore, the differences reported in the current study reflect alterations in the
physiological status of long-term HN and LN acclimated
plants. In agreement with previous studies [30-32,35,36]
P. trichocarpa showed faster elongation of the upper
stem internodes as well as increased radial growth at the
stem base under HN compared with LN conditions. Furthermore, the anatomical alterations in response to high
N in the wood were similar to those observed in previous
studies, such as thinner cell walls, wider vessel lumina and
decreased lignin staining intensity [30-33,35,36] corresponding to the negative correlation of growth and lignin
[52]. An unexpected finding of our study was that the EZ
of HN poplars contained increased concentrations of
soluble phenolics and lignin as well as thicker cell
walls compared with LN poplars. Apparently, during
primary elongation growth the influence of high N on
xylary elements is reversed compared to that during
secondary growth. This notable result was supported
by the identification of an underlying gene network.
The network contained a tightly co-regulated subnet
(complex 3) that was enriched in genes known to be
involved in secondary cell wall formation. In addition
to master regulators of secondary cell wall formation
such as MYB46 and MYB103 [7], it integrated genes
for cellulose synthase, for hemicellulose formation as
well as laccases and peroxidases required for lignification. Moreover, complex 3 encompassed about onethird of the genes denominated as “core xylem gene
set” in Arabidopsis [53] and contained various genes
found to be preferentially expressed during secondary
wall formation in wood of P. tomentosa [54]. In contrast
to the remarkable overlap with the genes for secondary
cell wall formation, we found only one common gene between complex 3 and the N-regulated genes earlier identified in the developing xylem of Populus trichocarpa ×
deltoides ([36], Additional file 5: Table S4). This observation further supports divergent regulation of cell formation in the EZ and the developing xylem that might have
led to the striking differences in cell wall anatomy and
biochemistry.
Although the overlap with complex 3 was low, we
found that about 13% of the genes identified in the developing xylem of HN poplars by Plavcová et al. [36]
(Additional file 5: Table S4) were also present in our
Page 10 of 13
total DEG list, including for example the aquaporin
TIP1;3 and genes for amino acid metabolism. Plavcová
et al. [36] speculated that enhanced aquaporin expression may be required for increased water uptake as a
precondition to drive the strong expansion of the vessel
lumina under high N. In concordance with this suggestion we found that the EZ of HN poplars contained
higher water content and strongly enlarged vessel lumina compared with LN poplars.
In our study, the identified cell wall-related complex
3 may be considered as a “hub” because of its high
connectivity. Hubs may constitute regulatory units [55].
Therefore, we inspected potential regulatory genes in
complex 3 with connectivity to cell wall-related genes. In
this context, PtARAC2.1, a poplar homolog to AtRAC2/
ROP7 was most notable. In Arabidopsis, the expression of
AtRAC2/ROP7 is developmentally limited to the late
stages of xylem differentiation and coincides with the formation of secondary cell walls [56]. The AtRAC2/ROP7
promoter directs highly xylem-specific expression in
Arabidopsis. In our subnet, PtARAC2.1 (AtRAC2/ROP7,
AT5G45970) had 32 edges and was highly connected
with cell wall-related genes including three fasciclinlike genes (PtFLA11.1, PtFLA14.7, PtFLA14.8); four cellulose synthases [PtCESA.2 (CESA8), Potri.002G257900
(CESA4), Potri.018G103900 (CESA7), Potri.011G069600
(CESA8)], genes for hemicellulose and xylan biosynthesis [Potri.006G131000 (IRX9), Potri.016G086400 (IRX9);
Potri.003G100200 (PRR1)], lignin formation [Potri.016G112000
(LAC4)] and regulation [Potri.008G094700 (KLCR2);
Potri.015G060100 (COBL4)]. All these genes were upregulated in the EZ of HN compared with LN plants.
PtARAC2.1 is also present in the list of the “core xylem
gene set” [53] and, thus, is a promising candidate to uncover the regulation of cell wall formation in poplar. Overall, the massive transcriptional regulation of regulatory
and biosynthetic plant cell wall genes in the EZ suggests
that high N supply initiates differences in cell wall formation at an early developmental stage.
N-driven elongation growth is under stress
Our results revealed a co-expressed gene cluster (complex 1) with functional annotations for transcription factors, development, cell walls, stress and transport in the
EZ of HN poplars. This complex apparently integrated
processes of primary steps in cell wall formation (pectin)
and phytohormone-regulated growth. For example, the
observed enhancement of auxin-related gene transcript
levels supports activation of cell division and enlargement in response to N. However, we also detected genes
required for jasmonate biosynthesis and signalling (homologs to JAR1, JAZ5, MYC2). This was unexpected
because jasmonate production is a response to wounding or herbivorous insects [57] and can induce plant
Euring et al. BMC Plant Biology (2014) 14:391
stunting [58]. Growth exerts a strain on the enlarging
tissues [59]. During extension growth the primary xylary
elements are ruptured. We speculate that these processes
may cause intrinsic lesions that could stimulate defence
responses.
It was also conspicuous that WRKY26 and WRKY33
(regulation of heat-induced ethylene-dependent response
of Arabidopsis [60]), WRKY18 (activated downstream of
a MAPK signalling pathway responding to pathogens
[61,62]) and WRKY40 (responses to abscisic acid (ABA)
and abiotic stress [63]) were up-regulated. In concert
with elevated transcript levels of a putative chitinase
(CHIV), PAD4, PR4, OSMOTIN 34 and the chaperone-like
DnaJ family gene, these findings suggest that N-induced
growth imposes stress on the tissues.
N metabolism in the stem elongation zone
Nitrate reductase (NIA2), nitrite reductase (NIR) and the
nitrate receptor/transporter NRT1.1 are considered as
sentinels of the nitrate response [64]. In poplar tissues
PtNRT1.1 has a low expression and therefore, cannot reliably be detected on microarrays [65]. Its expression is
decreased under HN in the poplar EZ [66]. The expression
of further poplar N-related genes PtNIA2.2, PtNIR1.1 and
Potri.001G348300 (AtNRT2.7) were suppressed, whereas
several putative amino acids transporter were up-regulated
in the EZ. This observation suggests that N assimilation
does not play a major role in the EZ and suggests that the
supply of the tissue is mainly achieved by the translocation
and uptake of amino acids. Amino acids, mainly glutamine, are the principle long distance transport forms of nitrogen in poplars [27]. In the EZ we found increased
expression of PtLHT1.2, a homolog to Arabidopsis LHT1
(LYSINE HISTIDINE TRANSPORTER1). AtLHT1 is a
master switch directing the partitioning of glutamine during
defence responses [67]. Here, PtLHT1.2 was co-expressed
with the WRKY18 and WRKY26 homologs, PtAAT1.1
(AAA-type ATPase), Potri.016G071600 (late embryogenesis abundant protein) and PtIFS1.42 (cytochrome
P450, a putative gene of the brassinosteroid metabolism).
This gene cluster could therefore coordinate growth processes with amino acid requirement. The molecular cross
talk between these co-expressed genes remains still enigmatic. Further studies are needed to elucidate the causal
links between N metabolites, their transport and growth
regulation.
N assimilation takes mainly place in mature leaves, because it requires reducing power and carbon skeletons
from photosynthesis as precursors for amino acid biosynthesis. It has often been reported that nitrogen and
photosynthesis are positively related [68-70]. Contrary,
N starvation generally resulted in decreased transcript
levels of photosynthesis gene expression in Arabidopsis
shoots [51]. It was, therefore, unexpected that genes for
Page 11 of 13
light reactions and the Calvin cycle were collectively
suppressed in the EZ of HN plants (complex 2).
Young stems are photosynthetically active [71,72], but
the EZ is a sink tissue. Sink tissue rely on the import
of carbohydrates and amino acids and respiration is
stronger than photosynthesis [73]. This may be a reason why the photosynthetic genes were collectively
suppressed in complex 2 of the EZ, whereas generally
positive relationships between N supply and the expression of photosynthetic genes and photosynthetic activity
exist [51].
Conclusions
In the present study, we have identified genes involved
in N-driven stem elongation growth in P. trichocarpa.
Co-expression analysis extracted a network of DEGs
with functional annotations to hormone metabolism, stress,
transport, cell wall, and photosynthesis. The network uncovered three main complexes that represented functional
units: Complex 1 integrated growth processes and stress
suggesting that genes which have well established functions
in abiotic and biotic stress are also recruited to coordinate
growth strain. Complex 2 was enriched in genes with decreased transcript abundance and functionally annotated as
photosynthetic hub. This finding underpins the complex
relationship between photosynthetic processes and nitrogen. Complex 3 was identified as a hub for secondary cell
formation because it connected well-known master regulators of secondary cell walls (e.g. MYB46) with genes related
to the formation of cellulose, hemicelluloses, lignin and
phenolics. Anatomical and biochemical analysis confirmed
that N-driven growth resulted in early secondary cell wall
formation in the elongation zone. In contrast to the EZ,
secondary xylem at the stem base formed thinner cell walls
with less lignin with high N supply. These results suggest
that the influence of high N on cell wall deposition in
xylary elements is reversed or shifted between secondary to
primary growth. This finding may have practical implications because a reduction of the cellulose-to-lignin-ratio in
the secondary xylem due to N fertilization affects the usability and economic value of wood as feedstock for biofuel
production [3]. An important goal of future studies will be
to elucidate the nitrogen-related regulation of the cell wall
hub. This knowledge may open new perspectives on
sustainable fertilization without negative consequences
for wood composition.
Availability of supporting data
The data sets supporting the results in this article are
available in this article, in the additional files and in
the ArrayExpress repository with the accession number E-MTAB-1483 ( />experiments/E-MTAB-1483/).
Euring et al. BMC Plant Biology (2014) 14:391
Additional files
Additional file 1: Table S1. N responsive gene list for the elongation
zone.
Page 12 of 13
8.
9.
Additional file 2: Table S2. Annotated list of genes retrieved in the
co-expression network.
Additional file 3: Figure S1. A co-expression network of differentially
expressed genes in the elongation zone of Populus trichocarpa.
10.
Additional file 4: Table S3. List of the most connected hub genes.
11.
Additional file 5: Table S4. Comparison of nitrogen responsive gene
lists in the elongation zone (this study), the developing xylem [36] and
the “core xylem gene set” [53].
12.
Abbreviations
ABA: Abscisic acid; DEG: Differentially expressed genes; EZ: Elongation zone;
GO: Gene Ontology; HN: High nitrogen; JA: Jasmonic acid; JGI: The Joint
Genome Institute; LN: Low nitrogen; N: Nitrogen; RMA: Robust Multiarray
Averaging; SD: Standard deviation.
13.
14.
15.
16.
Competing interests
The authors declare that they have no competing interests.
17.
Authors’ contributions
DE conducted the molecular, biochemical and anatomical studies. DE and
HB conducted the experiment. DJ, DE and AP conducted the bio-informatic
analyses. AP and DE conceived the experiment and drafted the manuscript.
All authors read and approved the final manuscript.
18.
19.
20.
Acknowledgements
We thank Chanaka Mannapperuma from PopGenIE Team (SLU, Umea,
Sweden) for making numerical data of our analysis available that were not
automatically accessible through the POPGenie homepage. We thank
Thomas Klein (Laboratory for Radioisotopes, University of Göttingen),
Marianne Smiatacz (University of Göttingen) and Christine Kettner (University
of Göttingen) for excellent technical assistance. We are grateful to the
German Academic Exchange Service (DAAD) for funding PhD scholarships
(DE and HB) and to the BMBF (Germany) for financial support of the project
ÖL4 in the program BEST. The publication fund of the University of
Göttingen and the Deutsche Forschungsgemeinschaft supported open
access publication of this article.
21.
22.
23.
24.
Received: 22 September 2014 Accepted: 18 December 2014
25.
References
1. Sannigrahi P, Ragauskas AJ, Tuskan GA: Poplar as a feedstock for biofuels:
A review of compositional characteristics. Biofuels Bioprod Biorefining 2010,
4:209–226.
2. Mansfield SD, Kang K-Y, Chapple C: Designed for deconstruction–poplar
trees altered in cell wall lignification improve the efficacy of bioethanol
production. New Phytol 2012, 194:91–101.
3. Polle A, Janz D, Teichmann T, Lipka V: Poplar genetic engineering:
promoting desirable wood characteristics and pest resistance. Appl Microbiol
Biotechnol 2013, 97(13):5669.
4. Hertzberg M, Aspeborg H, Schrader J, Andersson A, Erlandsson R, Blomqvist K,
Bhalerao R, Uhlen M, Teeri TT, Lundeberg J, Sundberg B, Nilsson P, Sandberg G:
A transcriptional roadmap to wood formation. Proc Natl Acad Sci U S A 2001,
98:14732–14737.
5. Schrader J, Nilsson J, Mellerowicz E, Berglund A, Nilsson P, Hertzberg M,
Sandberg G: A high-resolution transcript profile across the wood-forming
meristem of poplar identifies potential regulators of cambial stem cell
identity. Plant Cell 2004, 16:2278–2292.
6. Goué N, Lesage-Descauses M-C, Mellerowicz EJ, Magel E, Label P, Sundberg B:
Microgenomic analysis reveals cell type-specific gene expression patterns
between ray and fusiform initials within the cambial meristem of Populus.
New Phytol 2008, 180:45–56.
7. Schuetz M, Smith R, Ellis B: Xylem tissue specification, patterning, and
differentiation mechanisms. J Exp Bot 2013, 64:11–31.
26.
27.
28.
29.
30.
31.
32.
Chai G, Qi G, Cao Y, Wang Z, Yu L, Tang X, Yu Y, Wang D, Kong Y, Zhou G:
Poplar PdC3H17 and PdC3H18 are direct targets of PdMYB3 and
PdMYB21, and positively regulate secondary wall formation in
Arabidopsis and poplar. New Phytol 2014, 203:520–534.
Song D, Sun J, Li L: Diverse roles of PtrDUF579 proteins in Populus and
PtrDUF579-1 function in vascular cambium proliferation during secondary
growth. Plant Mol Biol 2014, 85:601–612.
Popko J, Hänsch R, Mendel R-R, Polle A, Teichmann T: The role of abscisic acid
and auxin in the response of poplar to abiotic stress. Plant Biol 2010, 12:242–258.
Demura T, Fukuda H: Transcriptional regulation in wood formation.
Trends Plant Sci 2007, 12:64–70.
Zhong R, Ye Z-H: Regulation of cell wall biosynthesis. Curr Opin Plant Biol
2007, 10:564–572.
Zhong R, Lee C, Ye Z-H: Global analysis of direct targets of secondary wall
NAC master switches in Arabidopsis. Mol Plant 2010, 3:1087–1103.
Wang H-Z, Dixon RA: On–off switches for secondary cell wall biosynthesis.
Mol Plant 2011, 5(2):297–303.
Groß-Hardt R, Laux T: Stem cell regulation in the shoot meristem. J Cell Sci
2003, 116:1659–1666.
Furuta KM, Hellmann E, Helariutta Y: Molecular control of cell specification
and cell differentiation during procambial development. Annu Rev Plant
Biol 2014, 65:607–638.
Mayer KF, Schoof H, Haecker A, Lenhard M, Jürgens G, Laux T: Role of
WUSCHEL in regulating stem cell fate in the Arabidopsis shoot meristem.
Cell 1998, 95:805–815.
Barton MK, Poethig RS: Formation of the shoot apical meristem in
Arabidopsis thaliana: an analysis of development in the wild type and in
the shoot meristemless mutant. Development 1993, 119:823–831.
Scofield S, Murray JAH: KNOX gene function in plant stem cell niches.
Plant Mol Biol 2006, 60:929–946.
Shani E, Yanai O, Ori N: The role of hormones in shoot apical meristem
function. Curr Opin Plant Biol 2006, 9:484–489.
Yamaguchi M, Ohtani M, Mitsuda N, Kubo M, Ohme-Takagi M, Fukuda H,
Demura T: VND-INTERACTING2, a NAC domain transcription factor,
negatively regulates xylem vessel formation in Arabidopsis. Plant Cell
2010, 22:1249–1263.
Zhong R, Richardson EA, Ye Z-H: The MYB46 transcription factor is a direct
target of SND1 and regulates secondary wall biosynthesis in Arabidopsis.
Plant Cell Online 2007, 19:2776–2792.
Zhong R, Lee C, Zhou J, McCarthy RL, Ye Z-H: A battery of transcription
factors involved in the regulation of secondary cell wall biosynthesis in
Arabidopsis. Plant Cell Online 2008, 20:2763–2782.
Ko J-H, Kim W-C, Han K-H: Ectopic expression of MYB46 identifies
transcriptional regulatory genes involved in secondary wall biosynthesis in
Arabidopsis. Plant J 2009, 60:649–665.
McCarthy RL, Zhong R, Ye Z-H: MYB83 is a direct target of SND1 and acts
redundantly with MYB46 in the regulation of secondary cell wall
biosynthesis in Arabidopsis. Plant Cell Physiol 2009, 50:1950–1964.
Zhong R, Ye Z-H: MYB46 and MYB83 bind to the SMRE sites and directly
activate a suite of transcription factors and secondary wall biosynthetic
genes. Plant Cell Physiol 2012, 53:368–380.
Rennenberg H, Wildhagen H, Ehlting B: Nitrogen nutrition of poplar trees.
Plant Biol Stuttg Ger 2010, 12:275–291.
Cooke JEK, Weih M: Nitrogen storage and seasonal nitrogen cycling in
Populus: bridging molecular physiology and ecophysiology. New Phytol
2005, 167:19–30.
Coleman M, Tolsted D, Nichols T, Johnson WD, Wene EG, Houghtaling T:
Post-establishment fertilization of Minnesota hybrid poplar plantations.
Biomass Bioenergy 2006, 30:740–749.
Luo ZB, Langenfeld-Heyser R, Calfapietra C, Polle A: Influence of free air
CO2 enrichment (EUROFACE) and nitrogen fertilisation on the anatomy
of juvenile wood of three poplar species after coppicing. Trees-Struct
Funct 2005, 19:109–118.
Luo Z-B, Calfapietra C, Scarascia-Mugnozza G, Liberloo M, Polle A: Carbonbased secondary metabolites and internal nitrogen pools in Populus
nigra under Free Air CO2 Enrichment (FACE) and nitrogen fertilisation.
Plant Soil 2008, 304:45–57.
Novaes E, Osorio L, Drost DR, Miles BL, Boaventura-Novaes CRD, Benedict C,
Dervinis C, Yu Q, Sykes R, Davis M, Martin TA, Peter GF, Kirst M: Quantitative genetic
analysis of biomass and wood chemistry of Populus under different nitrogen
levels. New Phytol 2009, 182:878–890.
Euring et al. BMC Plant Biology (2014) 14:391
33. Hacke UG, Plavcová L, Almeida-Rodriguez A, King-Jones S, Zhou W, Cooke JE:
Influence of nitrogen fertilization on xylem traits and aquaporin expression
in stems of hybrid poplar. Tree Physiol 2010, 30:1016–1025.
34. Pitre FE, Lafarguette F, Boyle B, Pavy N, Caron S, Dallaire N, Poulin P-L, Ouellet M,
Morency M-J, Wiebe N, Lim EL, Urbain A, Mouille G, Cooke JEK, Mackay JJ:
High nitrogen fertilization and stem leaning have overlapping effects
on wood formation in poplar but invoke largely distinct molecular
pathways. Tree Physiol 2010, 30:1273–1289.
35. Euring D, Löfke C, Teichmann T, Polle A: Nitrogen fertilization has
differential effects on N allocation and lignin in two Populus species with
contrasting ecology. Trees 2012, 26:1933–1942.
36. Plavcová L, Hacke UG, Almeida-Rodriguez AM, Li E, Douglas CJ: Gene expression
patterns underlying changes in xylem structure and function in response to
increased nitrogen availability in hybrid poplar. Plant Cell Environ 2013,
36:186–199.
37. Janz D, Lautner S, Wildhagen H, Behnke K, Schnitzler J-P, Rennenberg H,
Fromm J, Polle A: Salt stress induces the formation of a novel type of
“pressure wood” in two Populus species. New Phytol 2012, 194:129–141.
38. Teichmann T, Bolu-Arianto WH, Olbrich A, Langenfeld-Heyser R, Göbel C,
Grzeganek P, Feussner I, Hänsch R, Polle A: GH3::GUS reflects cell-specific
developmental patterns and stress-induced changes in wood anatomy
in the poplar stem. Tree Physiol 2008, 28:1305–1315.
39. Vallet C, Chabbert B, Czaninski Y, Monties B: Histochemistry of lignin
deposition during sclerenchyma differentiation in alfalfa stems. Ann Bot
1996, 78:625–632.
40. Brinkmann K, Blaschke L, Polle A: Comparison of different methods for
lignin determination as a basis for calibration of near-infrared reflectance
spectroscopy and implications of lignoproteins. J Chem Ecol 2002,
28:2483–2501.
41. Chang S, Puryear J, Cairney J: A simple and efficient method for isolating
RNA from pine trees. Plant Mol Biol Report 1993, 11:113–116.
42. Thimm O, Bläsing O, Gibon Y, Nagel A, Meyer S, Krüger P, Selbig J, Müller LA,
Rhee SY, Stitt M: Mapman: a user-driven tool to display genomics data sets
onto diagrams of metabolic pathways and other biological processes.
Plant J 2004, 37:914–939.
43. Provart N, Zhu T: A browser-based functional classification SuperViewer
for Arabidopsis genomics. Curr Comput Mol Biol 2003, 2003:271–272.
44. Shannon P, Markiel A, Ozier O, Baliga NS, Wang JT, Ramage D, Amin N,
Schwikowski B, Ideker T: Cytoscape: A software environment for
integrated models of biomolecular interaction networks. Genome Res
2003, 13:2498–2504.
45. Wituszynska W, Slesak I, Vanderauwera S, Szechynska-Hebda M, Kornas A,
Van Der Kelen K, Mühlenbock P, Karpinska B, Mackowski S, Van Breusegem F,
Karpinski S: Lesion simulating disease1, enhanced disease susceptibility1,
and phytoalexin deficient4 conditionally regulate cellular signaling
homeostasis, photosynthesis, water use efficiency, and seed yield in
Arabidopsis. Plant Physiol 2013, 161:1795–1805.
46. Kleffmann T, Russenberger D, von Zychlinski A, Christopher W, Sjölander K,
Gruissem W, Baginsky S: The Arabidopsis chloroplast proteome reveals
pathway abundance and novel protein functions. Curr Biol 2004, 14:354–362.
47. Liu Y, Xu F, Gou J, Al-Haddad J, Telewski FW, Bae H-J, Joshi CP: Importance
of two consecutive methionines at the N-terminus of a cellulose synthase
(PtdCesA8A) for normal wood cellulose synthesis in aspen. Tree Physiol
2012, 32:1403–1412.
48. Sakakibara H: Nitrate-specific and cytokinin-mediated nitrogen signaling
pathways in plants. J Plant Res 2003, 116:253–257.
49. Ho C-H, Lin S-H, Hu H-C, Tsay Y-F: CHL1 functions as a nitrate sensor in
plants. Cell 2009, 138:1184.
50. Krouk G, Crawford NM, Coruzzi GM, Tsay Y-F: Nitrate signaling: adaptation
to fluctuating environments. Curr Opin Plant Biol 2010, 13:266–273.
51. Krapp A, Berthomé R, Orsel M, Mercey-Boutet S, Yu A, Castaings L, Elftieh S,
Major H, Renou J-P, Daniel-Vedele F: Arabidopsis roots and shoots show
distinct temporal adaptation patterns toward nitrogen starvation.
Plant Physiol 2011, 157:1255–1282.
52. Novaes E, Kirst M, Chiang V, Winter-Sederoff H, Sederoff R: Lignin and biomass:
a negative correlation for wood formation and lignin content in trees.
Plant Physiol 2010, 154:555–561.
53. Ko J-H, Beers EP, Han K-H: Global comparative transcriptome analysis
identifies gene network regulating secondary xylem development in
Arabidopsis thaliana. Mol Genet Genomics MGG 2006, 276:517–531.
Page 13 of 13
54. Yang X, Li X, Li B, Zhang D: Identification of genes differentially expressed
in shoot apical meristems and in mature xylem of Populus tomentosa.
Plant Mol Biol Report 2014, 32:452–464.
55. Zhu X, Gerstein M, Snyder M: Getting connected: analysis and principles
of biological networks. Genes Dev 2007, 21:1010–1024.
56. Brembu T, Winge P, Bones AM: The small GTPase AtRAC2/ROP7 is
specifically expressed during late stages of xylem differentiation in
Arabidopsis. J Exp Bot 2005, 56:2465–2476.
57. Herde M, Koo AJK, Howe GA: Elicitation of jasmonate-mediated defense
responses by mechanical wounding and insect herbivory. Methods in
Molecular Biology 2013, 1011:51–61.
58. Zhang YI, Turner JG: Wound-induced endogenous jasmonates stunt plant
growth by inhibiting mitosis. PLoS One 2008, 3:e3699.
59. Archer RR: Growth stresses and strains in trees. 1st ed. Heidelberg:
Springer-Verlag; 1987.
60. Li S, Fu Q, Chen L, Huang W, Yu D: Arabidopsis thaliana WRKY25, WRKY26,
and WRKY33 coordinate induction of plant thermotolerance. Planta 2011,
233:1237–1252.
61. Asai T, Tena G, Plotnikova J, Willmann MR, Chiu W-L, Gomez-Gomez L, Boller T,
Ausubel FM, Sheen J: MAP kinase signalling cascade in Arabidopsis innate
immunity. Nature 2002, 415:977–983.
62. Xu X, Chen C, Fan B, Chen Z: Physical and functional interactions
between pathogen-induced Arabidopsis WRKY18, WRKY40, and WRKY60
transcription factors. Plant Cell Online 2006, 18:1310–1326.
63. Chen H, Lai Z, Shi J, Xiao Y, Chen Z, Xu X: Roles of Arabidopsis WRKY18,
WRKY40 and WRKY60 transcription factors in plant responses to abscisic
acid and abiotic stress. BMC Plant Biol 2010, 10:281.
64. Krouk G, Mirowski P, LeCun Y, Shasha DE, Coruzzi GM: Predictive network
modeling of the high-resolution dynamic plant transcriptome in response
to nitrate. Genome Biol 2010, 11:R123.
65. Bai H, Euring D, Volmer K, Janz D, Polle A: The nitrate transporter (NRT)
gene family in poplar. PLoS One 2013, 8:e72126.
66. Bai H: Transcription patterns of NRT family genes and ecophysiological
response to nitrate fertilization and drought in poplar. Thesis, Göttingen:
Cuvillier; 2014.
67. Liu G, Ji Y, Bhuiyan NH, Pilot G, Selvaraj G, Zou J, Wei Y: Amino acid
homeostasis modulates salicylic acid-associated redox status and
defense responses in Arabidopsis. Plant Cell 2010, 22:3845–3863.
68. Nilsen ET: Partitioning growth and photosynthesis between leaves and
stems during nitrogen limitation in Spartium junceum. Am J Bot 1992,
79:1217–1223.
69. Ibrahim L, Proe MF, Cameron AD: Main effects of nitrogen supply and
drought stress upon whole-plant carbon allocation in poplar. Can J For
Res 1997, 27:1413–1419.
70. Ripullone F, Grassi G, Lauteri M, Borghetti M: Photosynthesis–nitrogen
relationships: interpretation of different patterns between Pseudotsuga
menziesii and Populus × euroamericana in a mini-stand experiment. Tree
Physiol 2003, 23:137–144.
71. Smith SD, Osmond CB: Stem photosynthesis in a desert ephemeral,
Eriogonum inflatum. Oecologia 1987, 72:533–541.
72. Pfanz H, Aschan G, Langenfeld-Heyser R, Wittmann C, Loose M: Ecology and
ecophysiology of tree stems: corticular and wood photosynthesis.
Naturwissenschaften 2002, 89:147–162.
73. Paul MJ, Foyer CH: Sink regulation of photosynthesis. J Exp Bot 2001,
52:1383–1400.
Submit your next manuscript to BioMed Central
and take full advantage of:
• Convenient online submission
• Thorough peer review
• No space constraints or color figure charges
• Immediate publication on acceptance
• Inclusion in PubMed, CAS, Scopus and Google Scholar
• Research which is freely available for redistribution
Submit your manuscript at
www.biomedcentral.com/submit