Global insights into high temperature and drought stress regulated genes by RNA-Seq in economically important oilseed crop Brassica juncea
Bạn đang xem bản rút gọn của tài liệu. Xem và tải ngay bản đầy đủ của tài liệu tại đây (1.39 MB, 15 trang )
Bhardwaj et al. BMC Plant Biology (2015) 15:9
DOI 10.1186/s12870-014-0405-1
RESEARCH ARTICLE
Open Access
Global insights into high temperature and drought
stress regulated genes by RNA-Seq in economically
important oilseed crop Brassica juncea
Ankur R Bhardwaj1, Gopal Joshi1, Bharti Kukreja1, Vidhi Malik1, Priyanka Arora1, Ritu Pandey2, Rohit N Shukla3,
Kiran G Bankar3, Surekha Katiyar-Agarwal2, Shailendra Goel1, Arun Jagannath1, Amar Kumar1 and Manu Agarwal1*
Abstract
Background: Brassica juncea var. Varuna is an economically important oilseed crop of family Brassicaceae which is
vulnerable to abiotic stresses at specific stages in its life cycle. Till date no attempts have been made to elucidate
genome-wide changes in its transcriptome against high temperature or drought stress. To gain global insights into
genes, transcription factors and kinases regulated by these stresses and to explore information on coding transcripts
that are associated with traits of agronomic importance, we utilized a combinatorial approach of next generation
sequencing and de-novo assembly to discover B. juncea transcriptome associated with high temperature and
drought stresses.
Results: We constructed and sequenced three transcriptome libraries namely Brassica control (BC), Brassica high
temperature stress (BHS) and Brassica drought stress (BDS). More than 180 million purity filtered reads were
generated which were processed through quality parameters and high quality reads were assembled de-novo using
SOAPdenovo assembler. A total of 77750 unique transcripts were identified out of which 69,245 (89%) were
annotated with high confidence. We established a subset of 19110 transcripts, which were differentially regulated
by either high temperature and/or drought stress. Furthermore, 886 and 2834 transcripts that code for transcription
factors and kinases, respectively, were also identified. Many of these were responsive to high temperature, drought
or both stresses. Maximum number of up-regulated transcription factors in high temperature and drought stress
belonged to heat shock factors (HSFs) and dehydration responsive element-binding (DREB) families, respectively.
We also identified 239 metabolic pathways, which were perturbed during high temperature and drought treatments.
Analysis of gene ontologies associated with differentially regulated genes forecasted their involvement in diverse
biological processes.
Conclusions: Our study provides first comprehensive discovery of B. juncea transcriptome under high temperature and
drought stress conditions. Transcriptome resource generated in this study will enhance our understanding on the
molecular mechanisms involved in defining the response of B. juncea against two important abiotic stresses.
Furthermore this information would benefit designing of efficient crop improvement strategies for tolerance against
conditions of high temperature regimes and water scarcity.
Keywords: Brassica juncea, Transcriptome, High temperature stress, Drought stress, Differential gene expression,
Transcription factors, Kinases, Gene ontologies and pathways
* Correspondence:
1
Department of Botany, University of Delhi Main Campus, Delhi 110007, India
Full list of author information is available at the end of the article
© 2015 Bhardwaj et al.; licensee BioMed Central. This is an Open Access article distributed under the terms of the Creative
Commons Attribution License ( which permits unrestricted use, distribution, and
reproduction in any medium, provided the original work is properly credited. The Creative Commons Public Domain
Dedication waiver ( applies to the data made available in this article,
unless otherwise stated.
Bhardwaj et al. BMC Plant Biology (2015) 15:9
Background
The cellular activities are in a continuous state of dynamism and one of the most notable activities in a cell that
exemplifies it is gene transcription. Genetic message embedded in the transcripts is translated into proteins that
execute predetermined cellular processes. Additionally,
some of the transcripts are not translated, but still have
the ability to regulate the transcriptional and post transcriptional processes [1-3]. The immediate response of a
cell on imposition of a detrimental stress is to take evasive action, which is exhibited by a substantial shutdown
of transcription. Concurrently, transcripts of genes, that
can mitigate stress injury starts accumulating, the products of which either provide instant protection or salvage the stress-damaged components. Therefore, a large
number of studies have focused on the identification of
transcripts that are regulated by stress, as they provide a
framework for biotechnological approaches to alleviate
stress injuries and thereby can be used to make stress
tolerant organisms [3-6]. Present understanding of plant
response to abiotic stresses reveals that withstanding an
adverse condition is a multigenic trait and breeding approaches based on the available germplasm variability has
led to significant success in developing environmentally
hardy plants [4,5]. In addition to the breeding approaches,
overexpression of candidate genes and upstream transcriptional regulators has been widely used to introduce
tolerance against abiotic stresses [6]. Because of the multigenic nature of the trait, it is important to collate information on all the molecular factors that orchestrate together
to constitute a cellular state of stress tolerance. Many of
these factors are co-expressed in response to a stimulus
and therefore genomic scale investigations using either
microarray or cDNA sequencing are often helpful in their
identification. One of the recent approaches used for
whole-genome identification of transcripts is RNA-Seq,
which relies on sequencing small stretches of RNAderived cDNAs at a very high coverage. The small sequences are later assembled with advanced computing
tools to reconstruct the transcript. As RNA-Seq provides
an absolute measure of the quantity, it can be used to
deduce the relative expression of a transcript in two different tissues/conditions. Additionally, because RNASeq is an open-ended approach, it has been widely used
to sequence and assemble de-novo transcriptome of
various organisms [7-9].
Brassica juncea (Czern) L. (AABB, 2n = 36) commonly
known as ‘Indian mustard’ is an important oilseed crop.
It is a natural amphidiploid species that originated from
a cross between B. rapa (AA, 2n = 20) and B. nigra (BB,
2n = 16). It is widely grown in India, Canada, Australia,
China and Russia [10-13]. Considering its economic importance, efforts has been undertaken to augment its
economically and agronomically significant traits like oil
Page 2 of 15
content, oil quality, seed size, pod shattering and pathogen resistance [14-21]. However, only a few studies have
addressed the effects of abiotic stresses in Brassicas
[22,23]. In Indian subcontinent an early sowing and harvesting of Indian mustard is preferred so that the crop
can be harvested before the onset of detrimental aphid
attack. Due to an increase in mean temperatures globally, many a times in India, farmers shift sowing of B.
juncea from October to November and render the crop
to aphid attack during it’s maturation. Cultivars of B.
juncea whose seedlings can germinate efficiently under
higher temperatures (which are sometimes encountered
during the month of October) can help in escaping the
aphid attack as these cultivars can be harvested before
the onset of such an attack. The water footprint of B.
juncea is very small as compared to most of the other
cash crops of India, nevertheless, seedling emergence
and its sustainability are severely hampered under severe
drought conditions [24,25]. Additionally, incidences of
high temperature and drought stress during pod development are known to reduce seed setting [26,27]. To fully
comprehend the response of B. juncea we sequenced and
assembled transcriptome of its seedlings that were subjected either to high temperature or drought conditions.
Till now three independent research studies have been
carried out to explore the transcriptome of B. juncea.
Sun et al. [28] performed high throughput sequencing to
identify the genes involved in stem swelling in B. juncea
var. tumida Tsen et Lee, commonly known as tumorous
stem mustard [28]. Sequencing of RNA-Seq libraries obtained from different developmental stages of stem of
two contrasting strains namely, Yong’an (having inflated
tumorous stems) and Dayejie (without inflated stems)
generated approximately 54 million reads. Nearly 0.14
million unigenes were predicted out of which around
one thousand genes were differentially expressed in the
six comparison groups. In another study, Liu et al. [29]
investigated seed coat related transcriptome in B. juncea
varieties Sichuan Yellow Seed (SY) and its brown-seeded
near-isogenic line A (NILA) [29]. They identified 69605
unigenes out of which 46 were shown to be involved in
flavonoid biosynthesis pathways. Recently, Paritosh et al.
[30] explored transcriptome of B. juncea var. Varuna
(representing the Indian gene pool) and B. juncea var.
Heera (representing the east European gene pool) to
catalogue existing single nucleotide polymorphisms
(SNPs) in the two distantly related varieties. Nearly 0.13
million SNPs were identified among which 85473 belong
to “A” genome and 50236 are present in “B” genome.
These SNPs can be utilized for fine mapping of agronomically important traits and will shed light on the diversification of Brassica species [30]. As per our understanding
abiotic stress related transcriptome investigations have not
been carried out in B. juncea. However, such studies have
Bhardwaj et al. BMC Plant Biology (2015) 15:9
been performed in closely related B. rapa and B. napus
[22,23]. Yu et al. [23] performed RNA-Seq of drought
stressed B. rapa plants to analyze changes in its transcriptome. Analysis of sequenced tags identified 1092 dehydration responsive genes, many of which were transcription
factors [23]. In another study by Zou et al. [22], genomewide gene expression changes were identified under
waterlogging stress in ZS9, a waterlogging-tolerant variety
of B. napus. High-throughput sequencing of the libraries
generated approximately 30 million reads. Data analysis of
these libraries revealed presence of 4432 differently
expressed genes between the control and waterlogged
sample [22].
In the present study we performed high throughput sequencing of the coding transcriptome in B. juncea seedlings that were challenged either with high temperature or
drought stress. More than 180 million purity filtered reads
were used for de-novo assembly resulting in identification
of approximately 97000 unique transcripts. Nearly 69,245
transcripts were annotated out of which 2834 were kinases
and 886 were transcription factors (TF). Expression analysis revealed that 19110 transcripts were differentially
regulated by either high temperature and/or drought
stress as compared to the control sample. Amongst the
differentially expressed transcripts were 92 TFs whose expression changed in response to high temperature. Similarly, drought stress resulted in a significant change in
steady state levels of 72 TFs. Moreover, 60 TFs were regulated by both high temperature and drought stress.
Among the up-regulated TFs, HSF and DREB constituted
the most responsive TF families in BHS and BDS, respectively. Significant alterations in levels of 669 protein kinases
by elevated temperature and water deprivation were also
noticed. We observed that 259 and 217 protein kinase
genes were specifically regulated by drought and high
temperature, respectively. A substantial number of kinases
(193) were regulated by both high temperature and
drought. Role of differentially regulated transcripts was
analyzed by their corresponding gene ontologies. Furthermore, we were able to map 1854 of the differentially regulated transcripts in 239 metabolic pathways. Our study
not only provides a transcriptome resource that can be
utilized for improvement of B. juncea and related crops
but also improves realm of our existing knowledge for
high temperature and drought regulated genes at a
genome-wide level.
Results
High throughput sequencing, quality filtering and
de-novo assembly
Three transcriptome libraries were constructed using Poly
A+ RNA isolated from hydroponically grown 7-day old
whole seedlings that were kept under controlled conditions (BC) or challenged with high temperature (BHS) or
Page 3 of 15
drought (BDS). High throughput sequencing of transcriptome libraries using Illumina GA IIx platform generated
an aggregate of 183.7 million purity filtered reads amounting to 15.2 Gb of data. Individually, maximum number of
reads was obtained in control (BC; ~77.9 million) followed
by high temperature stress (BHS; ~65.6 million) and
drought stress (BDS; ~40.1 million) samples. The reads
which had adapter contamination and low base quality
(≤ Q20) were removed to retain approximately 66.1
million, 51 million and 35.5 million high quality (HQ)
reads in BC, BHS and BDS samples, respectively. The
number of reads that were eliminated from data so as to
retain only the HQ reads is presented in Table 1. Subsequently, the base composition of HQ reads was examined
to rule out sequencing bias (Additional file 1: Figure S1).
To generate a comprehensive assembly, HQ reads
from all the libraries were pooled generating a population of nearly 152.7 million reads. Due to unavailability
of assembled genomic sequence in B. juncea, reads were
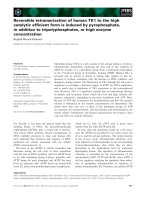
‘de-novo’ assembled using SOAPdenovo [31]. The overall
strategy of de-novo assembly by utilizing HQ reads is
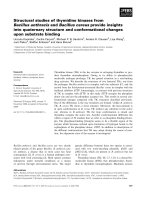
presented in Figure 1. Data was independently assembled with different K-mer lengths of 21, 27, 33, 39, 45,
51, 57 and 63 bases. The consolidated results of the assembled data obtained for each of the above K-mers are
presented in Table 2. Maximum numbers of contigs
(262233) were obtained at 33 K-mer, whereas assembly at
39 K-mer yielded the highest output of 111.6 million bp.
As expected, length of the longest assembled transcript
gradually decreased with an increasing K-mer for e.g.
length of longest transcript was 12248 bp at 27 K-mer and
was 7678 bp at 63 K-mer. Average transcript length of 724
bp at 57 K-mer was the best amongst all assemblies. We
also evaluated the N50 value and assemblies performed at
longer K-mers (39 mer onwards) had a better N50 value
than the lower K-mer assemblies. Highest N50 value of
1301 bp was obtained in 51 K-mer assembly. An aggregate
of approximately 0.8 million contigs were obtained from
all the assemblies. However, significant number of the
contigs were represented in only one of the K-mer assemblies and were discarded thereby reducing the number
from 0.8 million to 0.27 million. To further filter out the
low confidence transcripts, we discarded the contigs that
had less than one fragment per kilobase per million
(FPKM) in all the conditions (BC, BHS and BDS). In this
way, we clustered only those contigs which were present
in assemblies of at least two different K-mer and on which
at least one fragment out of one million sequenced reads
mapped per kilo base. Applying these criteria 97175 contigs with an average length of 817 bp were identified
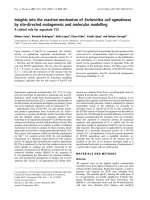
(Table 3). The aggregate length of all the assembled contigs was 79407853 bases. A large percentage (40.3%) of the
contigs was in the size range of 100–500 bp. As shown in
Figure 2A, the number of contigs decreased with an
Bhardwaj et al. BMC Plant Biology (2015) 15:9
Page 4 of 15
Table 1 Filtering of raw reads obtained through high throughput sequencing of RNA-Seq libraries
Category
BC
BHS
Number of reads
Number of reads
BDS
Number of reads
(Percentage)
(Percentage)
(Percentage)
Raw reads
77926818 (100%)
65644688 (100%)
40181314 (100%)
Adapter contaminated
155835 (0.2%)
4872907 (7.4%)
889239 (2.2%)
Low quality
11662189 (15.0%)
9706889 (14.8%)
3747523 (9.3%)
High quality paired reads
58438630 (75.0%)
41320578 (62.9%)
32342960 (80.5%)
High quality unpaired reads
7670164 (9.8%)
9744314 (14.8%)
3201592 (8.0%)
Total high quality reads
66108794 (84.8%)
51064892 (77.8%)
35544552 (88.5%)
Raw reads from control (BC), high temperature (BHS) and drought (BDS) stress libraries were subjected to various quality control parameters and reads that had
contamination of adapter sequence or of low quality were eliminated. Only high quality paired and orphan reads were pooled for assembly.
increasing size range (Figure 2A and Additional file 2:
Table S1).
Functional annotation of assembled transcripts
De-novo assembly followed by clustering resulted in approximately 97000 contigs. Any contig less than 200 bp
long was removed from the clustered data thereby
Raw reads
BC
Raw reads
BHS
reducing the number of contigs to 77750, which were subsequently used for homology-based annotation. Annotation on one hand helps in predicting the functions and on
the other hand provides confidence about assembly approach. A substantial portion of the assembled contigs
would be annotated as long as assembly approach is robust and adequate protein information of closely related
Raw reads
BDS
Quality filtering
(NGS QC Toolkit)
HQ reads
BC
HQ reads
BHS
HQ reads
BDS
Pooled HQ reads
de-novo assembly at 21, 27, 33, 39,
45, 51, 57, 63 k-mer
(SOAPdenovo)
Clustering
(CD-HIT-EST)
Back mapping of reads
(TopHat)
Removal of transcripts
with zero FPKM
(Cufflink, Cuffmerge)
FINAL ASSEMBLY
Extraction of transcripts:
a. Present in at least two
independent assemblies.
b. More than 200 nt
length.
Annotation
(FastAnnotator)
Differential expression
(cuffdiff, CummeRbund)
Pathway mapping
(KASS)
Figure 1 Schematic overview of the methodology employed for data quality control (QC), de-novo assembly and downstream analysis.
Name of tool used in each step of assembly or analysis is indicated in parenthesis.
Bhardwaj et al. BMC Plant Biology (2015) 15:9
Page 5 of 15
Table 2 Assembly statistics of high quality reads
Parameters
Number of contigs
K-mer
21
27
33
39
45
51
57
63
204991
248954
262233
220102
170941
134378
99899
68700
Assembly length (million bp)
69.8
96.1
111.1
111.6
104.4
91.9
72.4
47.0
Minimum transcript length (bp)
100
100
100
100
100
100
100
100
Maximum transcript length (bp)
10071
12248
11901
11782
11856
9105
8870
7678
Average transcript length (bp)
340
385
423
506
610
683
724
684
N50 (bp)
665
832
989
1144
1265
1301
1241
1057
Pooled high quality reads were assembled at various K-mers using SOAPdenovo. For each of the K-mer various assembly parameters (such as number of contigs,
assembly length, minimum, maximum and average transcript length and N50) were evaluated. The maximum value for each of the parameter in their respective
k-mers has been italicized.
species is available. These contigs hereafter referred as
transcripts were searched against non-redundant protein
database of EMBL (European Molecular Biology Laboratory) by using FASTAnnotater tool (http://fastannotator.
cgu.edu.tw/) with an e-value cut-off of 0.00001. Also, a
query coverage threshold of 70% identity was used to discard low coverage/ambiguous homologous protein mapping. Each transcript was annotated as per the best
homologous protein and the corresponding annotation
was assigned to it. Based on the above approach 89%
(69245) of the transcripts were annotated whereas 11%
(8506) transcripts remained unannotated (Additional
file 3: Table S2). A total of 25438 transcripts had one or
more protein domains based on information of pfam
database ( We were able to identify 3895 unique pfam domains (Additional file 3: Table
S2). BLAST (Basic Local Alignment Search Tool) score
revealed that highest number of transcripts matched to
A. thaliana (32791) and A. lyrata (25170). The number
of transcripts that matched with B. rapa or other Brassica species were less than that of A. thaliana and A.
lyrata (Figure 2B and Additional file 4: Table S3). This
observation is in accordance with the fact that protein
resource of Arabidopsis is much more comprehensive
as compared to that of Brassica species.
Transcriptome analysis in response to high temperature
and drought stress: Quantification, differential expression
and pathway mapping
We used FPKM (Fragments Per Kilobase per Million)
method to normalize the expression of identified transcripts
Table 3 Output of clustered assembly
Category
Clustered assembly
Number of contigs
97175
Assembly length (million bp)
79.4
Average transcript length (bp)
817
Assemblies from all the K-mer lengths were subjected to clustering. The number
of contigs after clustering, total length of assembly and average length of
transcripts is shown.
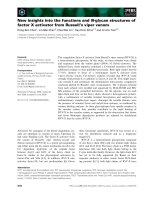
across different conditions. To visualize the range of
transcript abundance, log10 values of FPKM were used
to construct box-and-whisker plot for each of the condition. As seen in the Figure 3A, majority of the transcripts fall in the log10 FPKM range of 0–2. However,
many of the transcripts have log10 FPKM values higher
and lower than this range. These transcripts are the
outliers and are represented by black dots (each dot
representing one transcript). It was observed that median and quartile values across BC, BHS and BDS were
almost similar. Scatter plots drawn with the log10
FPKM values further corroborated the results obtained
from box-plots. As seen in Figure 3B, the FPKM values
(or in other words the transcript abundance) in both
control and stress samples are similar for most of the
transcripts. To see how many transcripts are significantly regulated, volcano plots were constructed by
plotting the fold change values against the negative log
of p-values (Figure 3C). The higher the negative log pvalues, more is the significance of the regulation. In the
center of the volcano is a line at which fold change is
zero. On one side of the line are the negative fold
change values indicating down-regulation and on the
other side are the positive fold change values thereby
indicating up-regulation. Significantly regulated genes
are represented by red dots. As has been shown by
many previous studies, our data also follows the similar
pattern that a small proportion of all genes are significantly regulated by abiotic stresses [22,23].
To find out the differentially expressed genes FPKM
values were compared in stress versus control conditions.
A criterion of ± two fold change (on log2 scale) was applied and 19110 transcripts were identified that were regulated at least 2 folds in either high temperature stress and/
or drought stress. Out of 19110 transcripts, 5271 were
regulated by both stresses whereas 6729 and 7110 were
regulated specifically by high temperature (BHS) and
drought (BDS) stress, respectively. Upon imposition of
stresses, majority of transcripts were down-regulated. Out
of 19110 significantly regulated transcripts, 14032 were
Bhardwaj et al. BMC Plant Biology (2015) 15:9
Number of contigs
(A)
Page 6 of 15
45000
40000
35000
30000
25000
20000
15000
10000
5000
0
Contig length
(B)
Number of transcripts
35000
32791
30000
25170
25000
20000
15000
10000
5000
2789
1768
1478
856
447
274
272
228
0
Species
Figure 2 Investigation of assembly performance and annotation. (A) Length-wise distribution of contigs. The number of contigs present in
each of the length category in clustered transcriptome of B. juncea is shown. Contig numbers gradually decreases with respect to increasing contig
length. (B) Number of B. juncea transcripts (Y-axis) that were annotated on the basis of homology with genes from closely related species (X-axis).
Transcripts were searched against EMBL plant protein database and based on BLAST score annotations were derived for each transcript. The number
of transcripts hitting the protein dataset of various plant species is indicated.
down regulated, 4266 of which were specifically downregulated by high temperature stress, 5453 by drought
stress and 4313 by both high temperature and drought
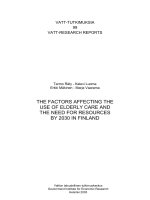
stress. A heat map of differentially regulated transcripts is
presented in Figure 4A. The heat map clearly shows that a
greater number of transcripts are down regulated as compared to up regulated transcripts. Nevertheless, a lesser
but substantial number of the transcripts were up regulated too, for example in BHS 2463, in BDS 1657 and in
both BHS and BDS 830 transcripts were up regulated
(Figure 4B). Interestingly, 128 transcripts regulated by
both BHS and BDS displayed an inverse correlation in
their expression with respect to these two stresses.
Details of differentially regulated transcripts are provided in Additional file 5: Table S4.
We also looked into the pathways in which the differentially expressed genes are involved. We were able to
map 1854 genes in 239 different metabolic pathways
(Additional file 6: Table S5). To further narrow down on
the most significant pathways, we shortlisted the pathways in which at least 10 differentially regulated genes
were present. Based on the above criteria 51 significant
pathways were shortlisted. The maximum numbers of
differentially regulated genes (87) were present in ‘ABC
transporters’, followed by ‘ribosome biogenesis’ having
76 genes and ‘purine metabolism’ with 43 genes. A list
Bhardwaj et al. BMC Plant Biology (2015) 15:9
(A)
Page 7 of 15
(B)
+6
BC_vs_BDS
BC_vs_BHS
Log10 FPKM
Log10 FPKM
+4
+2
0
0
-2
-4
BC
BHS
BDS
Log10 FPKM
Conditions
(C)
BC_vs_BDS
BC_vs_BHS
Minus log10 of p-value
15
10
5
0
-10
0
+10
-10
Log2 fold change
0
+10
Figure 3 Estimation of normalization and expression changes in different libraries. (A) Box-and-whisker plot of log10 FPKM values in RNA-Seq
libraries of control (BC), high temperature (BHS) and drought stress (BDS). The entire range is divided in 4 quartiles (Q1-Q4) each representing 25% of
genes in the particular range. (B) Scatter plot and (C) Volcano plot of the transcriptome in high temperature (BHS) and drought (BDS) stress. In scatter
plot, log10 FPKM values in control (X-axis) have been plotted against log10 FPKM values of stress treated sample (Y-axis) sample. In volcano
plot, statistical significance (−log10 of p-value; Y- axis) has been plotted against log2 fold change (X-axis).
of top 10 metabolic pathways possibly regulated by high
temperature and/or drought stress is presented in Table 4.
For each of the pathway, the hierarchical categorization
of KEGG (Kyoto Encyclopedia of Genes and Genomes)
identifier in the form of KEGG BRITE has also been included in the table.
Gene ontology analysis of stress-regulated transcripts
For a broader classification, the entire set of 19110 stressmodulated transcripts was subjected to gene ontology
(GO) analysis. Nearly 40% of high temperature stress and
43% of drought stress regulated genes were associated
with the GO category ‘biological process’. Similarly, 34%
and 31% of the high temperature and drought stress regulated genes were linked with ‘molecular function’ category,
respectively. Further, 26% of genes regulated by either high
temperature or drought stress were placed in ‘cellular
component’ category. A significant number of transcripts
(499 in BHS and 506 in BDS) were categorized under the
GO number ‘GO:0006355’ representing ‘regulation of
transcription’. Other apparent GO terms associated with
differentially expressed genes were ‘serine family amino
acid metabolic process (GO:0009069)’ and ‘protein phosphorylation (GO:0006468)’. More than 300 transcripts associated with each of the above-mentioned GO category.
For each of the stress conditions, a few GO terms, for example, ‘response to heat (GO:0009408)’ and ‘response to
high light intensity (GO:0009644)’ were enriched in high
temperature stress library. In case of drought stress
treated library, the enriched GO terms included ‘response
to water deprivation (GO:0009414)’ and ‘hyperosmotic salinity response (GO:0042538)’. The composition of significant GOs, having more than 40 differentially regulated
genes, in BDS and BHS samples is presented in Figure 5.
Bhardwaj et al. BMC Plant Biology (2015) 15:9
(A)
Page 8 of 15
(B)
BHS
BDS
1657
5453
(C)
830
4313
128
17
42
1
45
47
BHS
BDS
28
231
2463
4266
BHS
BDS
22
50
(D)
BHS
BDS
10
179
4
49
168
Color scale
-2
0
+2
Figure 4 Expression analysis of differentially expressed transcripts. (A) Unsupervised hierarchical clustering of differentially expressed
transcripts in high temperature (BHS) and drought stress (BDS) conditions. Comparison was made against control sample using Pearson uncentered
algorithm with an average linkage rule to identify clusters of genes based on their expression levels across samples. (B) Number of transcripts
(C) transcription factors and (D) kinases that were regulated by high temperature stress, drought stress or by both stresses. The up-regulation,
down-regulation and inverse corelation (up-regulated in one condition and down-regulated in other condition or vice versa) is indicated by arrows
pointing upwards, downwards and upwards-downwards, respectively.
Table 4 List of top 10 dysregulated pathways
KEGG ID
Pathway
BRITE Class-1
BRITE Class-2
Number of
transcripts
ko02010
ABC transporters
Environmental Information
Processing
Membrane transport
87
ko03010
Ribosome
Genetic Information Processing
Translation
76
ko00230
Purine metabolism
Metabolism
Nucleotide metabolism
43
ko00860
Porphyrin and chlorophyll metabolism
Metabolism
Metabolism of cofactors and vitamins
41
ko00010
Glycolysis/Gluconeogenesis
Metabolism
Carbohydrate metabolism
37
ko00520
Amino sugar and nucleotide sugar metabolism
Metabolism
Carbohydrate metabolism
36
ko02020
Two-component system
Environmental Information
Processing
Signal transduction
36
ko00520
Amino sugar and nucleotide sugar metabolism
Metabolism
Carbohydrate metabolism
34
ko00540
Lipopolysaccharide biosynthesis
Metabolism
Glycan biosynthesis and metabolism
33
ko00230
Purine metabolism
Metabolism
Nucleotide metabolism
31
Differentially regulated transcripts were mapped on various metabolic pathways using corresponding KEGG identifiers. Derived pathway and associated BRITE
Class with number of dysregulated genes are indicated.
Bhardwaj et al. BMC Plant Biology (2015) 15:9
Page 9 of 15
Figure 5 Gene ontology classification of differentially expressed transcripts under the ‘biological process’ category. Significant GO terms
(having atleast 40 genes) associated with differentially expressed transcripts in high temperature (BHS) and drought (BDS) stress samples along
with the number of genes is indicated.
Hormones play an important role in defining plant’s
response to high temperature and drought stress [32-34]
and therefore, many GO terms related to hormone signaling were enriched from the genes regulated by heat
and/or drought stress. Some of the enriched categories
were ‘response to auxin stimulus (GO:0009733)’, ‘response to salicylic acid stimulus (GO:0009751)’, response
to ‘jasmonic acid stimulus (GO:0009753)’, ‘abscisic acid
transport (GO:0080168)’ and ‘response to gibberellin
stimulus (GO:0009739)’. Approximately, 2914 and 2458
stress modulated transcripts from BDS and BHS samples
respectively, were associated with the top 20 GO terms
(Additional file 7: Table S6, Additional file 8: Table S7).
Expression analysis of transcription factors and protein
kinases
Considering the functional importance of transcription
factors and protein kinases, we identified 886 transcription factors and 2834 protein kinases in the assembled
B. juncea transcriptome (Additional file 9: Table S8,
Additional file 10: Table S9). A large collection of transcription factor families and their members have been
reported in Arabidopsis [35]. Similarly, we also discovered multiple members of transcription factor families in
our data, including 122 transcripts belonging to MYB
family. Other abundant transcription factor family members were from WRKY (118), bHLH (101), CCAAT (48),
HSF (39), NFY (37), JUMONJI (37), AP2 (32), GATA
(29), ERF (26), C2H2 (22), PLATZ (21), bZIP (21), DREB
(15). Amongst the protein kinases, maximum numbers
of transcripts (240) were identified for receptor-like kinase
family. Beside these, MAP kinases (116), casein kinases
(80), calcium-dependent protein kinases’ (62), CBLinteracting protein kinases (59) and cyclin-dependent
protein kinases (40) were also represented abundantly
in the assembled transcriptome data.
Following identification of TFs and kinases, we ascertained their digital expression so that they can be catalogued on the basis of their modulation by stress. Our
analysis revealed that expression of 72 and 92 TFs changed by at least log2 ± 2 folds in response to drought and
high temperature stress, respectively. Additionally, expression of 60 TFs changed significantly by both the stresses
(Figure 4C). It was noticed that among the differentially
regulated transcription factors in high temperature
stressed sample most dominating category was of MYBtranscription factors (26) followed by HSF (23) and ERF
(15). Together these three classes of transcription factors
represent 25% of all the transcription factors that were differentially regulated by heat stress. In case of transcription
factors responsive to drought stress, MYB transcription
factors constitutes largest group (17) followed by bHLH
(13) and WRKY (12) transcription factor members. When
we searched for the TFs, whose expression was significantly up-regulated, we observed that HSF family (21
members) and DREB family (7 members) were the predominant families in high temperature and drought stress,
respectively. Similarly, investigation of abundances of protein kinases revealed change in expression of 669 kinases
with respect to their expression in control sample. Among
the various kinase families, 86 members of receptor-like
kinase, 29 members of MAP kinase, 15 members of casein
kinase, 11 members of calcium-dependent kinase, 6 members each of CBL-interacting kinase and cyclin dependent
kinase families were regulated by more than two fold.
Moreover, out of 669 differentially regulated kinases, 259,
217 and 193 were regulated by drought, high temperature
or both stresses, respectively (Figure 4D). These results
Bhardwaj et al. BMC Plant Biology (2015) 15:9
Page 10 of 15
indicate that heat and drought stress drive change in
expression of many transcription factors and kinases
which serve as key components of signal transduction
pathways. Some of these are regulated by both stresses
while others are specifically involved in either heat or
drought stress response. The number of differentially
regulated transcripts of various transcription factor and
kinase families is presented in Table 5. Information about
the individual transcripts can be found in Additional
file 9: Table S8 and Additional file 10: Table S9.
Validation of differentially regulated transcripts
From the list of significantly regulated transcripts, eight
transcripts were selected for experimental validation
and expression profiling. These transcripts include
TCONS_00034159, TCONS_00057510, TCONS_00068
803, TCONS_00031582, TCONS_00018135, TCONS_000
75263, TCONS_00034464 and TCONS_00054852 which
were annotated as HSP101, HSFB2a, HSFA7a, DREB2B,
group 1 LEA protein, polygalacturonase inhibitor protein
9, SAC-domain containing protein and senescence associated protein, respectively. As expected expression
of HSP101, HSFB2a and HSFA7a increased substantially and specifically in high temperature stress treatment whereas genes encoding for DREB 2B, Group 1
LEA protein and polygalacturonase inhibitor protein 9
were induced by drought stress. A significant increase
in the expression of Group 1 LEA protein was also observed in high temperature stress. SAC-domain containing
protein and senescence-associated protein were inducible
by both high temperature and drought treatment. The
Table 5 Differential expression of transcripts annotated as transcription factors and kinases
Family
Unique in BHS and/or BDS
BDS
BHS
Transcripts
identified
Differentially
expressed transcripts
Up regulated
Down
regulated
Total Up regulated
Down
regulated
Total
MYB
122
34
4
13
17
12
14
26
HSF
39
24
7
2
9
21
2
23
ERF
26
22
2
9
11
6
9
15
WRKY
118
21
5
7
12
3
11
14
bHLH
101
18
1
12
13
1
9
10
AP2
32
14
4
2
6
5
7
12
DREB
15
11
9
0
9
10
0
10
Transcription factors
JUMONJI
37
8
0
7
7
0
4
4
GATA
29
7
0
5
5
2
2
4
bZIP
21
6
1
4
5
0
3
3
PLATZ
21
4
3
0
3
1
0
1
TCP
8
3
1
0
1
1
0
1
CCAAT
48
2
0
1
1
0
1
1
HD
5
2
0
1
1
0
1
1
SCARECROW
5
1
0
1
1
0
1
1
GRAS
5
1
1
0
1
1
0
1
NFY
37
0
0
0
0
0
0
0
C2H2
22
0
0
0
0
0
0
0
Receptor-like kinases
240
86
4
59
63
2
52
54
MAP kinases
116
29
6
14
20
2
10
12
Kinases
Casein kinases
80
15
1
9
10
2
7
9
Calcium-dependent protein kinases
62
11
2
7
9
1
8
9
CBL-interacting kinases
59
6
0
3
3
1
3
4
Cyclin-dependent kinases
40
6
0
6
6
0
3
3
The members of various transcription factor and kinase families were fetched from assembled transcriptome data and analyzed for expression pattern under
conditions of drought (BHS) and high temperature (BHS). The details of total and differentially regulated transcripts in respective families along with categorization as
up-regulated, down-regulated and total regulated transcripts in BDS and BHS is presented.
Bhardwaj et al. BMC Plant Biology (2015) 15:9
Page 11 of 15
drought stresses. Here, we carried out paired end sequencing of RNA-Seq libraries prepared from poly A+
RNA isolated from hydroponically grown 7-day old
seedlings that were either grown under control conditions or subjected to high temperature and drought
stress. High throughput sequencing generated more than
180 million purity filtered reads and nearly 150 million
HQ reads were de-novo assembled using SOAPdenovo
assembler. Assembly was performed at multiple K-mers
and assemblies obtained from all the K-mers were clustered together. We adopted assembly at multiple K-mers
primarily because of two reasons: firstly, many studies
have shown that de novo assemblies with multiple Kmers result in discovery of greater number of transcripts
[36,37] and secondly it provides an opportunity to remove the contigs that are present in only one of the Kmer assembly, thereby increasing the confidence on the
assembly. Data assembled with multiple K-mers was
clustered, followed by removal of singletons. Subsequently, the resultant transcriptome was analyzed by
assigning annotations, expression (FPKM values), gene
ontologies and other functional categories. Based on the
relative expression profiles of the above mentioned transcripts are depicted in Figure 6.
Discussion
Ecological confinement of crops is determined by the
climatic conditions prevailing in a niche. Ever-increasing
population and decreasing arable land is straining economies of the countries that are largely dependent on
agronomic produce. Multiple abiotic factors that act either in isolation or combination contribute to decrease
in overall yield of crops. Amongst abiotic factors, high
temperature and water scarcity has an implacable effect
on plant physiology and undermines the plant’s capability to sustain adequate grain production. To mitigate the
effects of stress injuries, it is critical to contrive plants
that can withstand environmental challenges. Identification of molecular factors that either reinforce or provide
ab initio abilities to combat these stresses is therefore of
paramount importance.
The primary objective of this study was to visualize
the landscape of changes occurring in transcriptome of
B. juncea upon imposition of high temperature and
6000
HSP101
3000
2000
1500
1000
200
1000
500
0
0
BC 30 min 2h
4h
1h
3h
0
BC 30 min 2h
6h
BDS
BHS
Relative fold change
2500
400
2000
4h
1h
50
3h
6h
4h
1h
3h
Group 1 LEA protein
6h
BDS
BHS
DREB 2B
8
40
10
BC 30 min 2h
BDS
BHS
Polygalacturonase inhibitor
protein 9
HSF A7A
3000
600
4000
15
HSF B2a
800
5000
6
30
4
20
5
2
10
0
4h
1h
3h
6h
BC 30 min 2h
BDS
BHS
14
0
0
BC 30 min 2h
4h
1h
8
6h
BDS
BHS
Senescence-associated protein
3h
BC 30 min
2h
BHS
4h
1h
3h
6h
BDS
SAC domain containing protein
12
6
10
8
4
6
4
2
2
0
0
BC 30 min 2h
BHS
4h
1h
3h
BDS
6h
BC 30 min
2h
BHS
4h
1h
3h
6h
BDS
Figure 6 Relative abundance of selected transcripts as determined by qPCR. Expression profiling of a few differentially regulated transcripts
was performed using quantitative real time PCR. The relative abundance (Y-axis) was calculated using ΔΔCt method. B. juncea seedlings were
subjected for varied durations to either high temperature stress (BHS) at 42°C for 30 min, 2 h and 4 h or drought stress (BDS) by using 300 mM
mannitol for 1 h, 3 h and 6 h. The mean of three independent biological replicates is presented.
Bhardwaj et al. BMC Plant Biology (2015) 15:9
digital expression data many transcripts regulated by either high temperature and/or drought were shortlisted.
We report the existence of more than 97000 unique
transcripts in Indian mustard. However, a significant
proportion of these unique transcripts were smaller than
200 bases. Suspecting that these are artifacts of de-novo
assembly, we discarded them to obtain 77750 unique
transcripts. The fact that a large number of assembled
transcripts were annotated provides another support for
the multi K-mer approach adopted for assembly. Analysis of expression patterns of these transcripts revealed,
19110 unique transcripts were responsive to drought
stress and/or high-temperature. Moreover, 5271 transcripts
were regulated (830 up regulated, 4313 down regulated,
128 with inverse regulation) by both high temperature
and drought stress. Several studies have previously
shown that some components are involved in more
than one stress-signaling pathway [38-45] and therefore
functional characterization of the transcripts that are
up regulated by both these stresses will shed light on
the conserved signaling pathways in B. juncea. Equally
important are the transcripts that display an inverse
correlation with respect to these stresses, as their
characterization will help us unravel the reasons for
their inverse regulation and functional significance.
Of the genes identified in our study are the TFs like
DREBs, HSFs, WRKYs, MYBs etc. and calcium sensors,
kinases, calmodulin-binding chaperonins, glutathione
transferases, ascorbate peroxidases, ferritin etc. many of
which have previously been implicated, in multiple abiotic stresses including drought and high temperature
[46-51]. A detailed investigation of the digital expression data revealed that 7110 and 6729 genes were modulated specifically by drought and high temperature
stress, respectively. As reported previously in multiple
studies a majority of these genes were down regulated
upon stress imposition indicating a general transcriptional repression [52]. Of the 19110 stress- modulated
transcripts 1854 mapped onto different metabolic pathways, the few significant of which included “ABC transporters”, “purine metabolism”, and “two component
systems”. Components of the above-mentioned pathways
are involved in abiotic stresses and therefore it is plausible
that the B. juncea transcripts mapping to these pathways
also play an important role in mitigating effects of abiotic
stresses. At the center of abiotic stress signaling are TFs
and kinases many of which are themselves regulated by
abiotic stresses. Our data reveals presence of 886 TFs and
2834 kinases, out of which 256 TFs and 669 kinases were
regulated by high temperature and drought stress respectively. The major up-regulated TFs in high temperature
and drought stress turned out to be HSFs and DREBs,
which are the known biomarkers for these stresses,
respectively.
Page 12 of 15
In order to prove the authenticity of B. juncea denovo assembly, we selected a few transcripts and validated them using quantitative real time PCR. Three of the
shortlisted targets were HSP101, HsfB2a and HsfA7a, homologues which show a specific induction by heat stress.
Time kinetics studies of B. juncea HSP101, HsfB2a and
HsfA7a shows that these transcripts are induced many
folds under high temperature [53-57]. Moreover, the induction of the TFs HSFB2a and HSFA7a precedes that of
HSP101 indicating a hierarchy in stress signaling. Another
transcript, which was validated by QPCR, was a member
of group I LEA protein that are known to accumulate in
water deprived cells [58,59]. As expected expression of
LEA transcript increased nearly 40 folds under sustained
conditions of drought. Surprisingly, approximately, 10fold induction of LEA transcript was observed in high
temperature stressed seedlings also. Reports suggest that
LEA proteins can act synergistically with trehalose to prevent protein aggregation in vitro during high temperature
[60]. In-vivo trehalose accumulates in plants subjected to
high temperature stress [43,61,62] and hence it is conceivable that the accumulated LEA proteins act in conjunction
with trehalose to in-vivo obviate the protein denaturation
occurring during high temperature stress. Polygalacturonase inhibiting proteins (PGIP) are synthesized in plants
to inhibit the activity of polygalacturonase enzyme secreted by phytopathogenic fungi [63]. AtPGIP1 is inducible by cold stress [63] and analysis of 27 different PGIPs
revealed that abiotic stress responsive cis-regulatory elements are present in their promoters [64]. Induction of
PGIP under drought stress in the present study thereby
indicate that PGIP is involved in multiple biological processes and may provide a link between drought stress mediated signaling and plant defense response. SAC domain
containing proteins were initially discovered in yeast and
are believed to act as phosphoionositide phosphatases.
Arabidopsis has 9 SAC domain containing proteins and
AtSAC6 is inducible by salinity stress [65]. We believe that
multiple SAC domain containing proteins are present in
B. juncea and induction of some of the members in abiotic
stresses might be helpful in attenuating stress signaling by
removing phosphate from phosphoionositides.
Conclusion
In present study we have utilized next generation sequencing and computational methods to decipher the genomewide perturbations of steady state levels of transcripts in
B. juncea seedlings subjected to high temperature and
drought stress. We identified more than 97000 transcripts
out of which approximately 19000 were differentially
regulated. Importantly, we also identified multiple TFs
and protein kinases that were modulated by these
stresses. These transcripts are components of important
physiological processes, signaling/metabolic pathways and
Bhardwaj et al. BMC Plant Biology (2015) 15:9
regulatory networks. Stress responsive genes identified in
this study will be useful in expanding our knowledge of
high temperature and drought stress biology. The identified transcripts can be used to engineer tolerance against
two of the most important abiotic stresses in B. juncea
and related crop species.
Page 13 of 15
Approximately, 350 bp size region was eluted and PCR
amplified for 12 cycles. The quality and quantity of
prepared libraries was evaluated utilizing Bioanalyzer
(Agilent, USA). Ultra-deep parallel sequencing was performed using Illumina Genome Analyzer IIx at University
of Delhi South Campus, Delhi, India according to manufacturer’s instructions.
Methods
Plant material and growth conditions
RNA-Seq data processing, de-novo assembly and annotation
Seeds of Brassica juncea var. Varuna were obtained from
National Seed Center (NSC), Indian Agricultural Research
Institute (IARI), Delhi, India. Seeds were surface sterilized
with 2% sodium hypochlorite solution for 10 minutes
(min) on a shaker and then washed five times with double
distilled water for three min each. Sterile seeds were
hydroponically grown on a muslin cloth wrapped around
a small container in a growth chamber at 24°C ± 1 with
16 hours (h) day/8 h night photoperiod.
RNA-Seq raw reads were processed by NGS-QC toolkit
[67] and low-quality as well as adapter-contaminated sequences were discarded. High quality (paired and unpaired) reads were assembled de-novo using SOAPdenovo
assembler [31] independently at eight different K-mers
(21, 27, 33, 39, 45, 51, 57, 63). The eight assemblies were
subsequently clustered by using CD-HIT-EST [68]. The
clustering parameters used were ≥80% query coverage and
≥80% identity. To further clean the data transcripts
present in only one of the K-mer assemblies were removed. This was followed by removal of transcripts with
less than 1 FPKM in all the three conditions (BC, BDS
and BHS). Finally all the transcripts less than 200 bp were
removed and the remaining transcripts were functionally
annotated using FASTAnnotater tool (http://fastannotator.
cgu.edu.tw/) with an e-value cut-off of 0.00001 by taking
non-redundant protein database of EMBL (European
Molecular Biology Laboratory) as a reference. Gene ontology analysis of transcripts was derived through Uniprot
hit accessions and prediction of biochemical pathways
was performed by KEGG identifiers (ome.
jp/kegg/).
Stress conditions and treatments
Seedlings were grown for seven days and then subjected
to various abiotic stresses. Drought stress was imposed for
3 h and 12 h by replacing water with high osmolality solution (300 mM mannitol). For imposing high temperature
stress, seedlings were placed in a BOD incubator (Scientific systems, India) at 42°C for 30 min and 4 h. Entire
seedlings (including the roots) were harvested after specified time intervals, snap frozen in liquid nitrogen and
stored at −80°C. Untreated seedlings were taken as
control.
RNA isolation, RNA-Seq library preparation and sequencing:
Total RNA was isolated using GITC-based method [66]
from abiotic stress treated and untreated whole seedlings,
independently for each time point. Extracted RNA was
quantified using spectrophotometer (Biorad, USA) and an
aliquot of heat denatured RNA was electrophoresed on
denaturing agarose gel to check its integrity. RNA extracted from two different time points were pooled in
equimolar amounts and three RNA-Seq libraries- BC
(control seedlings), BDS (drought stressed seedlings)
and BHS (high temperature stressed) were prepared
utilizing NEBNext RNA-Seq library preparation Master
Mix Set for Illumina procured from NEB, USA. Briefly,
Poly A+ RNA was isolated from 10 μg of total RNA
using Sera-Mag beads (GE Healthcare, UK) and fragmented chemically at high temperature. Fragmented
RNA was qualitatively and quantitatively checked on
Bioanalyzer (Agilent, USA). 250 ng of fragmented RNA
was used for first strand reverse transcription using
random primers followed by second strand synthesis.
The ends of double stranded cDNA were repaired and
mono-adenylated. Paired end adapters were ligated
using Rapid T4 DNA ligase and then size fractionated.
Quantitative real time PCR validation of differentially
expressed genes (DEGs)
Ten microgram of total RNA was treated with two units
of RNase free DNase I (NEB, USA) followed by phenol
chloroform extraction and precipitation. Two μg of DNase
free RNA was reverse transcribed using iScript reverse
transcription kit (Biorad Inc., USA). The first strand
cDNA was diluted 10 times and used as template. Quantitative real time PCR was performed on CFX connect real
time system (Biorad Inc., USA) using gene-specific forward and reverse primers (Additional file 11: Table S10)
and SYBR green chemistry (Roche, GmbH). Actin was
used as an internal reference gene. Delta delta ct method
was used to calculate relative fold change values. Three
biological replicates and two technical replicates were included for each experiment.
Availability of supporting data
The data discussed in this publication have been deposited
in NCBI's Gene Expression Omnibus and are accessible
through GEO Series accession number GSE64242 (http://
www.ncbi.nlm.nih.gov/geo/query/acc.cgi?acc=GSE64242).
Bhardwaj et al. BMC Plant Biology (2015) 15:9
Additional files
Additional file 1: Figure S1. Frequency (in %) of the individual
nucleotides in high quality reads of control (BC), high temperature (BHS)
and drought (BDS) RNA-Seq libraries.
Page 14 of 15
2.
3.
4.
Additional file 2: Table S1. Distribution of number of clusters in
various cluster size ranges.
5.
Additional file 3: Table S2. List of identified transcripts with their
respective IDs, length, relative fold change, best BLASTx hit to protein
database and gene ontologies.
6.
Additional file 4: Table S3. Homologue species distribution based on
BLASTx results.
Additional file 5: Table S4. List of differentially regulated transcripts
with their respective IDs, length, relative fold change, best BLASTx hit to
protein database and gene ontologies.
7.
8.
Additional file 6: Table S5. List of dysregulated metabolic pathways.
Additional file 7: Table S6 Gene ontologies associated with drought
responsive unique transcripts.
Additional file 8: Table S7. Gene ontologies associated with high
temperature responsive unique transcripts.
9.
10.
Additional file 9: Table S8. List of identified transcription factors with
their respective IDs, length, relative fold change, best BLASTx hit to
protein database and gene ontologies.
Additional file 10: Table S9. List of identified kinases with their
respective IDs, length, relative fold change, best BLASTx hit to protein
database and gene ontologies.
Additional file 11: Table S10. Details of primers utilized for quantitative
real time PCR.
Competing interests
The authors declare that they have no competing interests.
11.
12.
13.
14.
Authors’ contributions
MA and SKA conceived the idea, designed and supervised the experiments;
ARB performed stress treatments, RNA isolation, prepared RNA-Seq libraries
and performed high throughput sequencing; RP assisted in RNA-Seq library
preparations, GJ, RNS, KGB, ARB and VM performed data analysis; BK and PA
performed qPCR based expression profiling; SKA, SG, AJ and AK critically
reviewed the manuscript; ARB and MA wrote the manuscript. All authors
read and approved the manuscript.
15.
Acknowledgement
Research work in the laboratory is supported by grants from Department of
Biotechnology (DBT; grant No. BT/PR62 8/AGR/36/674/2011; BT/190/NE/TBP/
2011), India and R&D grant from University of Delhi, Delhi, India. ARB, GJ, BK,
VM are supported by DBT, India. Grant from Special Assistance Program by
University Grants Commission, India (UGC-SAP) to PA is duly acknowledged.
RP is thankful for research fellowships from Council of Scientific and
Industrial research (CSIR), India and DBT, India. We also thank Dr. Vinod Scaria
from Institute of Genomics and Integrative Biology (IGIB), Delhi, India for
critical discussions during de-novo assembly of the transcriptome data. RNA
sequencing was carried at DBT-funded High-Throughput Sequencing Facility
at University of Delhi South Campus, New Delhi, India.
18.
16.
17.
19.
20.
Author details
1
Department of Botany, University of Delhi Main Campus, Delhi 110007,
India. 2Department of Plant Molecular Biology, University of Delhi South
Campus, Delhi 110021, India. 3Bionivid Technology [P] Ltd, Bangalore 560043,
India.
21.
Received: 25 September 2014 Accepted: 22 December 2014
23.
References
1. Ding Y, Tao Y, Zhu C. Emerging roles of microRNAs in the mediation of
drought stress response in plants. J Exp Bot. 2013;64(11):3077–86.
24.
22.
Sunkar R, Li Y-F, Jagadeeswaran G. Functions of microRNAs in plant stress
responses. Trends Plant Sci. 2012;17(4):196–203.
Lu X-Y, Huang X-L. Plant miRNAs and abiotic stress responses. Biochem Biophys
Res Commun. 2008;368(3):458–62.
Ashraf M. Inducing drought tolerance in plants: recent advances. Biotechnol
Adv. 2010;28(1):169–83.
Varshney RK, Bansal KC, Aggarwal PK, Datta SK, Craufurd PQ. Agricultural
biotechnology for crop improvement in a variable climate: hope or hype?
Trends Plant Sci. 2011;16(7):363–71.
Zhu J-K. Salt and drought stress signal transduction in plants. Annu Rev
Plant Biol. 2002;53(1):247–73.
Mousavi S, Alisoltani A, Shiran B, Fallahi H, Ebrahimie E, Imani A, et al.
De-novo transcriptome assembly and comparative analysis of differentially
expressed genes in Prunus dulcis Mill. in response to freezing stress. PLoS One.
2014;9(8):e104541.
Yates SA, Swain MT, Hegarty MJ, Chernukin I, Lowe M, Allison GG, et al.
De-novo assembly of red clover transcriptome based on RNA-Seq data provides
insight into drought response, gene discovery and marker identification.
BMC Genomics. 2014;15(1):453.
Qi B, Yang Y, Yin Y, Xu M, Li H. De-novo sequencing, assembly, and analysis
of the Taxodium ‘Zhongshansa’ roots and shoots transcriptome in response
to short-term waterlogging. BMC Plant Biol. 2014;14(1):201.
Burton W, Salisbury P, Potts D: The potential of canola quality Brassica juncea as
an oilseed crop for Australia. In: Proceeding of the 11th international rapeseed
congress: 6-10th July 2003, Pages 5–7. The Royal Veterinary and Agricultural
University, Copenhagen, Denmark
Liu S, Liu Z, Guan C. Advances in germplasm of oilseed Brassica juncea. J Plant
Genetic Resour. 2007;3:351–8.
Oram R, Kirk J, Veness P, Hurlstone C, Edlington J, Halsall D. Breeding Indian
mustard [Brassica juncea (L.) Czern.] for cold-pressed, edible oil production-a
review. Crop Pasture Sci. 2005;56(6):581–96.
Pradhan A, Gupta V, Mukhopadhyay A, Arumugam N, Sodhi Y, Pental D. A
high-density linkage map in Brassica juncea (Indian mustard) using AFLP
and RFLP markers. Theor Appl Genet. 2003;106(4):607–14.
Pandey M, Srivastava AK, D'Souza SF, Penna S. Thiourea, a ROS scavenger,
regulates source-to-sink relationship to enhance crop yield and oil content
in Brassica juncea (L.). PLoS One. 2013;8(9):e73921.
Augustine R, Mukhopadhyay A, Bisht NC. Targeted silencing of BjMYB28
transcription factor gene directs development of low glucosinolate lines in
oilseed Brassica juncea. Plant Biotechnol J. 2013;11(7):855–66.
Y-b L, Z-x T, Darmency H, Stewart Jr CN, Di K, Wei W, et al. The effects of
seed size on hybrids formed between oilseed rape (Brassica napus) and wild
brown mustard (B. juncea). PLoS One. 2012;7(6):e39705.
Østergaard L, Kempin SA, Bies D, Klee HJ, Yanofsky MF. Pod shatter-resistant
Brassica fruit produced by ectopic expression of the FRUITFULL gene.
Plant Biotechnol J. 2006;4(1):45–51.
Ramineni R, Sadumpati V, Khareedu VR, Vudem DR. Transgenic pearl
millet male fertility restorer line (ICMP451) and hybrid (ICMH451)
expressing Brassica juncea nonexpressor of Pathogenesis Related Genes
1 (BjNPR1) exhibit resistance to downy mildew disease. PLoS One.
2014;9(3):e90839.
Kaur P, Jost R, Sivasithamparam K, Barbetti MJ. Proteome analysis of the
Albugo candida–Brassica juncea pathosystem reveals that the timing of the
expression of defence-related genes is a crucial determinant of pathogenesis.
J Exp Bot. 2011;62(3):1285–98.
Roussel S, Nicole M, Lopez F, Renard M, Chevre A, Brun H. Cytological
investigation of resistance to Leptosphaeria maculans conferred to Brassica
napus by introgressions originating from B. juncea or B. nigra B genome.
Phytopathology. 1999;89(12):1200–13.
Mondal KK, Bhattacharya R, Koundal K, Chatterjee S. Transgenic Indian
mustard (Brassica juncea) expressing tomato glucanase leads to arrested
growth of Alternaria brassicae. Plant Cell Rep. 2007;26(2):247–52.
Zou X, Tan X, Hu C, Zeng L, Lu G, Fu G, et al. The transcriptome of Brassica
napus L. roots under waterlogging at the seedling stage. Int J Mol Sci.
2013;14(2):2637–51.
Yu S, Zhang F, Yu Y, Zhang D, Zhao X, Wang W. Transcriptome profiling of
dehydration stress in the Chinese cabbage (Brassica rapa L. ssp. pekinensis)
by tag sequencing. Plant Mol Biol Report. 2012;30(1):17–28.
Torabi B, Ardestani FG. Effect of salt and drought stresses on
germination components in canola (Brassica napus L.). Intl J Agri Crop
Sci. 2013;5(15):1642–7.
Bhardwaj et al. BMC Plant Biology (2015) 15:9
25. Omidi H, Khazaei F, Hamzi Alvanagh S, Heidari-Sharifabad H. Improvement
of seed germination traits in canola (Brassica napus L.) as affected by saline
and drought stresses. Plant Ecophysiol. 2009;1(3):151–8.
26. Anand A, Nagarajan S, Kishore N, Verma A. Impact of high temperature at
pod development stage on yield and quality of Brassica juncea cultivars
under controlled conditions. Indian J Agric Sci. 2010;80(12):1043–7.
27. Youssefi A, Nshanian A, Aziz M. Evaluation of influences of drought stress in
terminal growth duration on yield and yield components of different spring
Brassica oilseed species. Am-Euras J Agric Environ Sci. 2011;11(3):406–10.
28. Sun Q, Zhou G, Cai Y, Fan Y, Zhu X, Liu Y, et al. Transcriptome analysis of
stem development in the tumourous stem mustard Brassica juncea var.
tumida Tsen et Lee by RNA sequencing. BMC Plant Biol. 2012;12(1):53.
29. Liu X, Lu Y, Yuan Y, Liu S, Guan C, Chen S, et al. De-novo transcriptome of
Brassica juncea seed coat and identification of genes for the biosynthesis of
flavonoids. PLoS One. 2013;8(8):e71110.
30. Paritosh K, Gupta V, Yadava SK, Singh P, Pradhan AK, Pental D. RNA-Seq
based SNPs for mapping in Brassica juncea (AABB): synteny analysis between
the two constituent genomes A (from B. rapa) and B (from B. nigra) shows
highly divergent gene block arrangement and unique block fragmentation
patterns. BMC Genomics. 2014;15(1):396.
31. Luo R, Liu B, Xie Y, Li Z, Huang W, Yuan J, et al. SOAPdenovo2: an empirically
improved memory-efficient short-read de-novo assembler. Gigascience.
2012;1(1):18.
32. Kumar PP. Regulation of biotic and abiotic stress responses by plant hormones.
Plant Cell Rep. 2013;32(7):943.
33. Munne-Bosch S, Muller M. Hormonal cross-talk in plant development and
stress responses. Frontiers Plant Sci. 2013;4:529.
34. Peleg Z, Blumwald E. Hormone balance and abiotic stress tolerance in crop
plants. Curr Opin Plant Biol. 2011;14(3):290–5.
35. The Arabidopsis Genome Initiative (AGI). Analysis of the genome sequence
of the flowering plant Arabidopsis thaliana. Nature. 2000;408(6814):796–815.
36. Surget-Groba Y, Montoya-Burgos JI. Optimization of de-novo transcriptome
assembly from next-generation sequencing data. Genome Res.
2010;20(10):1432–40.
37. Rismani-Yazdi H, Haznedaroglu BZ, Reeves D, Peccia J. Optimization of
de-novo transcriptome assembly from high-throughput short read sequencing
data improves functional annotation for non-model organisms. BMC
Bioinformatics. 2012;13:170.
38. Kilian J, Whitehead D, Horak J, Wanke D, Weinl S, Batistic O, et al. The
AtGenExpress global stress expression data set: protocols, evaluation and
model data analysis of UV‐B light, drought and cold stress responses. Plant
J. 2007;50(2):347–63.
39. Langridge P, Paltridge N, Fincher G. Functional genomics of abiotic stress
tolerance in cereals. Brief Funct Genomic Proteomic. 2006;4(4):343–54.
40. Liu HT, Gao F, Cui SJ, Han JL, Sun DY, Zhou RG. Primary evidence for
involvement of IP3 in heat-shock signal transduction in Arabidopsis. Cell Res.
2006;16(4):394–400.
41. Mittler R. Oxidative stress, antioxidants and stress tolerance. Trends Plant Sci.
2002;7(9):405–10.
42. Nakashima K, Ito Y, Yamaguchi-Shinozaki K. Transcriptional regulatory networks
in response to abiotic stresses in Arabidopsis and grasses. Plant Physiol.
2009;149(1):88–95.
43. Rizhsky L, Liang H, Shuman J, Shulaev V, Davletova S, Mittler R. When
defense pathways collide. The response of Arabidopsis to a combination of
drought and heat stress. Plant Physiol. 2004;134(4):1683–96.
44. Sreenivasulu N, Sopory S, Kavi Kishor P. Deciphering the regulatory
mechanisms of abiotic stress tolerance in plants by genomic approaches.
Gene. 2007;388(1):1–13.
45. Wang W, Vinocur B, Altman A. Plant responses to drought, salinity and
extreme temperatures: towards genetic engineering for stress tolerance.
Planta. 2003;218(1):1–14.
46. Lata C, Prasad M. Role of DREBs in regulation of abiotic stress responses in
plants. J Exp Bot. 2011;62(14):4731–48.
47. Scharf K-D, Berberich T, Ebersberger I, Nover L. The plant heat stress
transcription factor (Hsf) family: structure, function and evolution. Biochimica
et Biophysica Acta (BBA)-Gene Regulatory Mechanisms. 2012;1819(2):104–19.
48. Chen L, Song Y, Li S, Zhang L, Zou C, Yu D. The role of WRKY transcription
factors in plant abiotic stresses. Biochimica et Biophysica Acta (BBA)-Gene
Regulatory Mechanisms. 2012;1819(2):120–8.
49. Li C, Ng CK-Y, Fan L-M. MYB transcription factors, active players in abiotic stress
signaling. Environ Experiment Botany 2014. doi:10.1016/j.envexpbot.2014.06.014
Page 15 of 15
50. Rao X-L, Zhang X-H, Li R-J, Shi H-T, Lu Y-T. A calcium sensor-interacting
protein kinase negatively regulates salt stress tolerance in rice (Oryza sativa).
Function Plant Biol. 2011;38(6):441–50.
51. Snedden WA, Fromm H. Calmodulin, calmodulin-related proteins and plant
responses to the environment. Trends Plant Sci. 1998;3(8):299–304.
52. Weber C, Guigon G, Bouchier C, Frangeul L, Moreira S, Sismeiro O, et al.
Stress by heat shock induces massive down regulation of genes and allows
differential allelic expression of the Gal/GalNAc lectin in Entamoeba
histolytica. Eukaryot Cell. 2006;5(5):871–5.
53. Kotak S, Larkindale J, Lee U, von Koskull-Döring P, Vierling E, Scharf K-D.
Complexity of the heat stress response in plants. Curr Opin Plant Biol.
2007;10(3):310–6.
54. Queitsch C, Hong S-W, Vierling E, Lindquist S. Heat shock protein 101 plays
a crucial role in thermotolerance in Arabidopsis. Plant Cell Online.
2000;12(4):479–92.
55. Nieto-Sotelo J, Martínez LM, Ponce G, Cassab GI, Alagón A, Meeley RB, et al.
Maize HSP101 plays important roles in both induced and basal thermotolerance
and primary root growth. Plant Cell Online. 2002;14(7):1621–33.
56. Y-y C, H-c L, N-y L, W-t C, C-n W, S-h C, et al. A heat-inducible transcription
factor, HsfA2, is required for extension of acquired thermotolerance in
Arabidopsis. Plant Physiol. 2007;143(1):251–62.
57. Busch W, Wunderlich M, Schöffl F. Identification of novel heat shock factor‐
dependent genes and biochemical pathways in Arabidopsis thaliana. Plant J.
2005;41(1):1–14.
58. Tunnacliffe A, Wise MJ. The continuing conundrum of the LEA proteins.
Naturwissenschaften. 2007;94(10):791–812.
59. Veeranagamallaiah G, Prasanthi J, Reddy KE, Pandurangaiah M, Babu OS,
Sudhakar C. Group 1 and 2 LEA protein expression correlates with a
decrease in water stress induced protein aggregation in horsegram during
germination and seedling growth. J Plant Physiol. 2011;168(7):671–7.
60. Goyal K, Walton L, Tunnacliffe A. LEA proteins prevent protein aggregation
due to water stress. Biochem J. 2005;388:151–7.
61. Garg AK, Kim J-K, Owens TG, Ranwala AP, Do Choi Y, Kochian LV, et al.
Trehalose accumulation in rice plants confers high tolerance levels to different
abiotic stresses. Proc Natl Acad Sci. 2002;99(25):15898–903.
62. Kaplan F, Kopka J, Haskell DW, Zhao W, Schiller KC, Gatzke N, et al. Exploring
the temperature-stress metabolome of Arabidopsis. Plant Physiol.
2004;136(4):4159–68.
63. Ferrari S, Vairo D, Ausubel FM, Cervone F, De Lorenzo G. Tandemly duplicated
Arabidopsis genes that encode polygalacturonase-inhibiting proteins are
regulated coordinately by different signal transduction pathways in response
to fungal infection. Plant Cell Online. 2003;15(1):93–106.
64. Kumar GM, Mamidala P, Podile AR. Regulation of Polygalacturonase-inhibitory
proteins in plants is highly dependent on stress and light responsive elements.
Plant Omics. 2009;2(6):238.
65. Zhong R, Ye Z-H. The SAC domain-containing protein gene family in
Arabidopsis. Plant Physiol. 2003;132(2):544–55.
66. Chomczynski P, Sacchi N. Single-step method of RNA isolation by acid
guanidinium thiocyanate-phenol-chloroform extraction. Anal Biochem.
1987;162(1):156–9.
67. Patel RK, Jain M. NGS QC Toolkit: a toolkit for quality control of next
generation sequencing data. PLoS One. 2012;7(2):e30619.
68. Huang Y, Niu B, Gao Y, Fu L, Li W. CD-HIT Suite: a web server for clustering
and comparing biological sequences. Bioinformatics. 2010;26(5):680–2.
Submit your next manuscript to BioMed Central
and take full advantage of:
• Convenient online submission
• Thorough peer review
• No space constraints or color figure charges
• Immediate publication on acceptance
• Inclusion in PubMed, CAS, Scopus and Google Scholar
• Research which is freely available for redistribution
Submit your manuscript at
www.biomedcentral.com/submit