Identification of a novel major locus for gray leaf spot resistance in Italian ryegrass (Lolium multiflorum Lam.)
Bạn đang xem bản rút gọn của tài liệu. Xem và tải ngay bản đầy đủ của tài liệu tại đây (699.58 KB, 11 trang )
Takahashi et al. BMC Plant Biology 2014, 14:303
/>
RESEARCH ARTICLE
Open Access
Identification of a novel major locus for gray
leaf spot resistance in Italian ryegrass (Lolium
multiflorum Lam.)
Wataru Takahashi1*, Yuichi Miura2,4, Tohru Sasaki3,5 and Tadashi Takamizo1
Abstract
Background: Gray leaf spot (GLS), caused by Magnaporthe oryzae (anamorph Pyricularia oryzae), in ryegrasses is a very
serious problem. Heavily infected small seedlings die within a matter of days, and stands of the grasses are seriously
damaged by the disease. Thus, the development of GLS-resistant cultivars has become a concern in ryegrass breeding.
Results: Phenotypic segregations in a single cross-derived F1 population of Italian ryegrass (Lolium multiflorum Lam.)
indicated that the GLS resistance in the population was possibly controlled by one or two dominant genes with
66.5–77.9% of broad-sense heritability. In bulked segregant analyses, two simple sequence repeat (SSR) markers,
which have so far been reported to locate on linkage group (LG) 3 of Italian ryegrass, showed specific signals in
the resistant parent and resistant bulk, indicating that the resistance gene locus was possibly in the LG 3. We thus
constructed a genetic linkage map of the LG 3 covering 133.6 centimorgan with other SSR markers of the LG 3 of
Italian ryegrass and grass anchor probes that have previously been assigned to LG 3 of ryegrasses, and with rice
expressed sequence tag (EST)-derived markers selected from a rice EST map of chromosome (Chr) 1 since LG 3
of ryegrasses are syntenic to rice Chr 1. Quantitative trait locus (QTL) analysis with the genetic linkage map and
phenotypic data of the F1 population detected a major locus for GLS resistance. Proportions of phenotypic variance
explained by the QTL at the highest logarithm of odds scores were 61.0–69.5%.
Conclusions: A resistance locus was confirmed as novel for GLS resistance, because its genetic position was different
from other known loci for GLS resistance. Broad-sense heritability and the proportion of phenotypic variance explained
by the QTL were similar, suggesting that most of the genetic factors for the resistance phenotype against GLS in the
F1 population can be explained by a function of the single resistance locus. We designated the putative gene for the
novel resistance locus as LmPi2. LmPi2 will be useful for future development of GLS-resistant cultivars in combination
with other resistance genes.
Keywords: Blast, Comparative genomics, Expressed sequence tag, Lolium multiflorum, Magnaporthe oryzae,
Single-strand conformation polymorphism
Background
Italian ryegrass (Lolium multiflorum Lam.) originated in
the Mediterranean region and is produced mainly for hay
and silage. It is one of the most important forage grasses
in the temperate zones of Europe and Asia because of its
high palatability to and digestibility by livestock [1,2].
Blast disease, caused by the fungal pathogen Magnaporthe oryzae (anamorph Pyricularia oryzae), is the most
* Correspondence:
1
Forage Crop Research Division, NARO Institute of Livestock and Grassland
Science, 768 Senbonmatsu, Nasushiobara, Tochigi 329-2793, Japan
Full list of author information is available at the end of the article
severe disease of rice. Blast may cause devastating production losses in rice in epidemic years. Thus, many
researchers have studied rice blast disease using genetic, pathological, and biotechnological approaches for
controlling outbreaks of the disease by determining
many aspects of the resistance mechanisms in rice and
the pathogenicity of the disease [3].
Ryegrass blast, also called gray leaf spot (GLS), has
recently become a very serious problem in Italian ryegrass
in Japan [4] and in perennial ryegrass (L. perenne L.) in
the United States [5]. The causal fungal pathogen of the
© 2014 Takahashi et al.; licensee BioMed Central Ltd. This is an Open Access article distributed under the terms of the Creative
Commons Attribution License ( which permits unrestricted use, distribution, and
reproduction in any medium, provided the original work is properly credited. The Creative Commons Public Domain
Dedication waiver ( applies to the data made available in this article,
unless otherwise stated.
Takahashi et al. BMC Plant Biology 2014, 14:303
/>
disease belongs to the same species as that causing rice
blast disease [6]. Disease symptoms first appear as small
brown spots on leaves and stems, and develop into watersoaked spots that further progress into round or oval
lesions with gray centers and dark-brown margins. If
M. oryzae heavily infects leaves of susceptible genotypes,
the infected leaves die, and small seedlings are killed
within a matter of days.
A diversity of resistant phenotypes against the GLS has
been observed in ryegrass species, and some resistant
genotypes have been found from cultivars and experimental lines in both perennial ryegrass [5,7] and Italian ryegrass [8,9]. In addition, this resistance may be controlled
by a few major gene loci [5] with high levels of heritability
[5,7], suggesting that a breeding program based on recurrent selection should be effective to improve the resistance
to GLS in ryegrasses [5].
In this context, we have identified a locus for a GLS
resistance gene, LmPi1, on linkage group (LG) 5 of Italian
ryegrass [4] and performed targeted mapping of rice
expressed sequence tags (ESTs) around the locus using
a synteny-based comparative genomics approach [10].
Similarly, Curley et al. [11] reported four quantitative
trait loci (QTLs) for GLS resistance on LG 2, 3, 4, and
6 from a mapping population derived from parental clones
of Italian × perennial ryegrass hybrids. These achievements are expected to promote breeding programs for
GLS-resistant cultivars in ryegrasses, because breeders
can easily screen GLS-resistant genotypes using genetic
molecular markers linked tightly to the above-mentioned
resistance loci.
However, because the breakdown of resistance controlled
by a few major genes is a known phenomenon in rice blast
disease [3], the durability of the previously identified
resistance gene loci in ryegrasses cannot be assured, and
other novel loci for GLS resistance should be identified
and used for developing durable resistant cultivars against
GLS in the future.
Thus, we attempted to identify a novel genetic locus for
GLS resistance from an F1 population by bulked segregant
analysis [12] and a synteny-based comparative genomics
approach with rice genome information. A genetic linkage
map corresponding to ryegrass LG 3 was constructed by
bulked segregant analysis with amplified fragment length
polymorphism (AFLP) and simple sequence repeat (SSR)
markers. Targeted mapping of rice EST-derived markers
further enriched the linkage map. QTL analysis with
the linkage map and phenotypic data of the F1 population
detected a resistance gene locus that explained 61.0–
69.5% of the phenotypic variance that was influenced and
fluctuated by age of leaves inoculated. The position of the
resistance gene locus was confirmed to be distinguishable
from previously identified GLS resistance gene locus
on ryegrass LG 3 reported by Curley et al. [11]. We
Page 2 of 11
designated the resistance gene LmPi2 as a novel gene
for GLS resistance in ryegrasses.
Results
Evaluation of GLS resistance in the F1 population
We conducted two independent inoculations each for the
second-youngest leaves still expanding and the thirdyoungest fully expanded leaves, which are hereafter referred
to as young leaves and expanded leaves, respectively, in the
F1 population (four inoculations in total). We scored after
seven days for each inoculation moment according to the
rating scale shown in Table 1.
Averaged phenotypic values for each genotype were
calculated from each datum of the experiment with young
or expanded leaves, and all four experiments. Actual
phenotypic segregations in the F1 population were 59
resistant (scores 0–2) and 46 susceptible (scores 3–4)
plants in the young leaf experiment, 72 resistant and 33
susceptible plants in the expanded leaf experiment, and
65 resistant and 40 susceptible plants as the averages of
all four inoculations (Figure 1). The segregation ratios
were not different from 1:1 in the young leaf experiment
(χ2 = 1.61, P = 0.20) and 3:1 in the expanded leaf experiment (χ2 = 2.31, P = 0.13); however, the segregation ratio
for averages of all four inoculations was statistically different from both 1:1 and 3:1. These results indicated that
the GLS resistance in the F1 population was possibly
controlled by one or two dominant genes.
There was a significant correlation (P < 0.01) among
all GLS severity of the different leaf ages and inoculation
moments (Table 2). In particular, higher correlation
coefficients were obtained between the results of the
same leaf stage (Table 2). Repeated-measures analysis of
variance (ANOVA) indicates that there were significant
differences (P < 0.01) among genotypes in all inoculations for GLS severity; however, the differences were not
significant between the inoculations within the same leaf
age (Table 3a). Two-way ANOVA using the same data
set with that of the above-mentioned repeated-measures
ANOVA revealed significant differences (P < 0.01) among
genotypes and leaf ages for GLS severity, and a significant
interaction (P < 0.01) between genotype and leaf age
Table 1 Rating scale for phenotypic assessment of gray
leaf spot resistance
Phenotype
Score
Symptoms
Resistant
0
No visible symptoms
1
Dark-brown, non-sporulating lesions
2
Expanding, dark-brown, non-sporulating lesions
3
Small circular or diamond-shaped lesions
with sporulating areas
4
Large expanding lesions with sporulating areas
Susceptible
See details and corresponding photographs in Takahashi et al. [13].
Takahashi et al. BMC Plant Biology 2014, 14:303
/>
Page 3 of 11
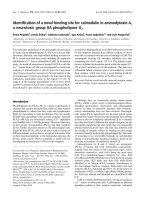
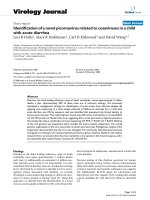
Figure 1 Frequency distribution of gray leaf spot severity in
an Italian ryegrass F1 population derived from cv. ‘Surrey’
(resistant - score 1) and cv. ‘Minamiaoba’ (susceptible - score 4).
Average phenotypic values from four inoculation experiments
are shown.
(Table 3b). The percentages of broad-sense heritability
calculated from the results of the repeated-measures
ANOVA shown in Table 3a were 70.1%, 77.9%, and
66.5% for the young leaf experiment, the expanded leaf
experiment, and all four inoculations, respectively.
Detection of a GLS resistance gene
To detect the major gene locus, we employed bulked
segregant analysis [12] because we succeeded in detecting a major gene, LmPi1, for GLS resistance using the
method in a previous study [4]. First, we used 64 primer
combinations for AFLP and identified two markers, E38/
M47 and E32/M59, which showed specific signals in both
the resistant parent and the resistant bulk. Preliminary
genetic linkage analysis and subsequent QTL analysis
indicated that the two markers were linked together and
were associated with GLS resistance (data not shown).
This result encouraged us to further progress the analysis
using SSR markers from a ryegrass reference map developed by Hirata et al. [14] to identify the LG containing
the resistance locus. Bulked segregant analyses with 218
SSR markers revealed four markers that showed specific
signals in the resistant parent and resistant bulk. Of these,
two markers 08-08B and 9-12A have already been
reported to locate on ryegrass LG 3 with a relatively
close genetic distance between them, whereas the other
two markers, 12-01E and 17-01H, have been reported
to locate on LG 6 and LG 7, and LG 2, respectively [14].
From these results, we predicted that the resistance gene
locus might be in ryegrass LG 3. Nevertheless, all four
resistant bulk-specific SSR markers were selected for map
construction of LG 3.
The two resistant bulk-specific AFLP and four SSR
markers, and 38 other SSR markers that have been reported
to locate on ryegrass LG 3 [14], were then used to construct
a genetic linkage map corresponding to ryegrass LG 3
with deoxyribonucleic acid (DNA) isolated from individuals from the F1 population. Segregation types of the
banding patterns for the AFLP and SSR markers are
shown in Table 4. As a result, the genotypic data of the
F1 population obtained from two AFLP and 29 SSR
markers were selected for map construction of LG 3.
Targeted mapping around the locus for GLS resistance
LG 3 of ryegrass species are syntenic to rice chromosome
(Chr) 1 [15,16]; therefore, we selected rice EST clones
from the rice EST map of Chr 1 [17] at a genetic distance
of approximately every 5 centimorgan (cM) or less, as far
as possible. Furthermore, grass anchor probes that locate
on LG 3 of ryegrass [11] were selected. In total, 76 rice
EST clones and seven anchor probes were selected, and
primer pairs were designed from these. Among the rice
EST clones, 51 primer pairs (67.1%) successfully amplified
clear polymerase chain reaction (PCR) products from
the female and/or male parent. Thirty-seven primer
pairs (48.7%) successfully amplified fragments that were
polymorphic in the F1 population in single-strand conformation polymorphism (SSCP) analysis. Similarly, two
primer pairs (28.6%) derived from grass anchor probes
successfully amplified clear PCR products from the female
and/or male parent; both were polymorphic between the
parents in SSCP analysis. Most of the SSCP analyses
showed multiple bands (data not shown). However, most
banding patterns from the SSCP analyses could be categorized into the five segregation types shown in Table 4.
Table 2 Pearson’s correlation coefficients among gray leaf spot assessments in an Italian ryegrass F1 population
derived from cv. ‘Surrey’ (resistant) and cv. ‘Minamiaoba’ (susceptible)
Experimenta)
Young leaves 1st
Young leaves 2nd
Expanded leaves 1st
Young leaves 1st
1
Young leaves 2nd
0.70
1
Expanded leaves 1st
0.66
0.58
1
Expanded leaves 2nd
0.67
0.61
0.78
a)
1st and 2nd indicate first and second inoculation experiment, respectively.
All coefficients were obtained with P < 0.01.
Expanded leaves 2nd
1
Takahashi et al. BMC Plant Biology 2014, 14:303
/>
Page 4 of 11
Table 3 Repeated-measures ANOVA (a) and two-way ANOVA (b) for gray leaf spot assessments in an Italian ryegrass F1
population derived from cv. ‘Surrey’ (resistant) and cv. ‘Minamiaoba’ (susceptible)
(a)
d)
Young leaves
Expanded leaves
Total
(b)
Total
Factora)
Sum of squares
Dfb)
Mean square
Fc)
Genotype
407.50
104
3.92
5.68*
Inoculation
1.22
1
1.22
1.77
Error
71.78
104
0.69
Total
480.50
209
Genotype
367.70
104
3.54
8.05*
Inoculation
0.80
1
0.80
1.83
Error
45.70
104
0.44
Total
414.20
209
Genotype
668.53
104
6.43
8.95*
Inoculation
34.62
3
11.54
16.06*
Error
224.13
312
0.72
Total
927.28
419
Genotype
668.53
104
6.43
11.30*
Leaf age
32.59
1
32.59
57.28*
1.80*
Genotype × Leaf age
106.66
104
1.03
Error
119.50
210
0.57
Total
927.28
419
a)
All factors were recognized as fixed effect.
b)
Number of degrees of freedom.
c)
Value of F-distribution.
d)
The data for young leaves have also been shown in Takahashi et al. [13].
*P < 0.01.
Of the SSR markers selected by bulked segregant
analyses, the two markers 12-01E and 17-01H previously assigned to LG 6 and LG 7, and LG 2, respectively [14], were also integrated into the linkage map;
however, the order of other SSR markers in the linkage map was identical to other LG 3 maps from previous studies [14,20], indicating that the linkage map
of the present study accurately represents LG 3 of ryegrasses. Significant collinearity (Spearman’s rank correlation rho = 0.64, P < 0.01) between the ryegrass LG 3 and
rice Chr 1 genetic linkage map [17] was also observed
using the information of the order of the rice EST-derived
markers (Figure 2).
Detailed results of the SSCP analysis are also shown in
Additional file 1. In total, 27 rice EST-derived markers
and two grass anchor probe-derived markers, which were
categorized into the five segregation types, were used for
the genetic map construction of LG 3.
Construction of a genetic linkage map
AFLP, SSR, and SSCP data were analyzed by JoinMap 4
[18]. The analysis yielded a major group with a logarithm
of odds (LOD) threshold of 2.0 with 57 markers, and we
succeeded in constructing a genetic linkage map covering
133.6 cM with two AFLP-, two grass anchor probe-, 12
SSR-, and 16 rice EST-derived markers (Figure 2).
Table 4 Segregation types for the different markers analysis conducted in an Italian ryegrass F1 population derived
from cv. ‘Surrey’ (resistant) and cv. ‘Minamiaoba’ (susceptible)
No. of
markers analyzed
Segregation typesa)
lm × ll
nn × np
ef × eg
ab × cd
hk × hk
AFLP
2
2
0
0
0
SSR
40
19
5
5
0
Markers
No. of
markers omittedb)
No. of
polymorphic markers
0
0
2
0
11
29
Rice EST-derived
76
7
9
8
1
2
49
27
Grass anchor probe-derived
7
1
1
0
0
0
5
2
a)
Parental genotypes were coded in accordance with JoinMap 4 [18].
Markers that showed unclear, non-segregated, and unexpected banding patterns in the mapping population, or were monomorphic between parents of the
mapping population, were omitted.
b)
Takahashi et al. BMC Plant Biology 2014, 14:303
/>
Page 5 of 11
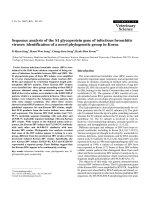
Figure 2 Comparative rice Chr 1 – Italian ryegrass LG 3 genetic maps and a LOD score plot obtained by QTL analysis. Markers on the rice
Chr 1 genetic map were selected from the rice EST map [17] to develop markers with intron-scanning primers. The developed rice EST-derived markers
are indicated by EST clone names (e.g., S14186) provided by the Rice Genome Project ( AFLP markers are
indicated by following the nomenclature of AFLP primer enzyme combinations of Key genes (e.g.. E32/M59). SSR markers are indicated by the names
(e.g., 08-08B) given by Hirata et al. [14]. Comparative loci between rice and Italian ryegrass are shown in bold on the rice Chr 1 genetic map and are
connected by solid lines. Locations of rice disease resistance gene loci on the rice Chr 1 reviewed by Ballini et al. [19] are shown in italics. Genetic
distances are measured in centimorgans (cM) against the ruler on the left side of the figure. The linkage map for the ryegrass LG 3 was used for QTL
analysis. The graph on the right side of the linkage map shows LOD score plots obtained by interval mapping. The light gray, gray, and black curves
represent score plots for young leaves, expanded leaves, and total data obtained from four inoculation experiments, respectively. A broken vertical line
indicates a LOD significance threshold level, 3.6, calculated by a permutation test (P < 0.05) with 1000 repetitions. The position of LmPi2 is shown with
an inner and outer vertical bar for 1-LOD and 2-LOD support interval, respectively. The position of LmPi2 and the LOD significance threshold level were
calculated based on a result of QTL analysis calculated with the total data obtained from four inoculation experiments.
Identification of a novel locus for GLS resistance
QTL analyses with the linkage map and phenotypic data
of GLS severity revealed a locus for GLS resistance in
the LG 3 (Figure 2). Three LOD score plots obtained with
the phenotypic data of young leaves, expanded leaves, and
total data obtained from four inoculation experiments
had similar shapes and showed peaks at almost the
same genetic position (Figure 2). The highest LOD scores
for young leaves, expanded leaves, and total data obtained
from four inoculation experiments were 13.8, 15.2, and
17.9, respectively. Proportions of phenotypic variance
explained by the QTL at the highest LOD scores for
young leaves, expanded leaves, and total data obtained
from four inoculation experiments were 61.0, 68.1, and
69.5%, respectively. Estimated additive effects contributed
by the resistant parent at the same genetic positions
Takahashi et al. BMC Plant Biology 2014, 14:303
/>
with those of the highest LOD scores for young leaves,
expanded leaves, and total data obtained from four
inoculation experiments were −1.09, −0.99, and −1.05,
respectively. The position of the GLS resistance gene locus
was predicted by 1-LOD and 2-LOD support intervals
of the LOD score plot, based on the total data obtained
from four inoculation experiments. The rice EST-derived
marker C30062 was found to be the closest marker to
the resistance locus (Figure 2). Since the proportions of
phenotypic variance explained by the QTL were similar
to percentages of the above mentioned broad-sense
heritability, most of genetic factors for the resistance
phenotype against GLS in the F1 population were thought
to be explained by a function of the detected single gene
locus nevertheless the segregation ratios of resistance to
susceptibility in the F1 population suggested that one or
two major loci are involved with the resistance. We designated the putative gene for the resistance locus as LmPi2,
because this is the second major locus for GLS resistance
after LmPi1 [4] in Italian ryegrass.
Discussion
The severity of GLS is influenced by environmental factors,
such as temperature and humidity [21,22]. Accordingly,
phenotype evaluations for populations in QTL analysis
should be conducted multiple times, and environmental
conditions during the phenotype evaluations should be as
stable as possible to increase the heritabilities of target
traits, because higher heritabilities will lead to more accurate estimations during the analysis. Thus, we employed
the filter-paper method [13], by which we could evaluate
GLS severity of an F1 population four times under fully
controlled inoculation conditions in vitro. This overcame
the high lethality of the GLS and annuality of the Italian
ryegrass, because the method does not require whole
plants, and only requires detached leaves of young seedlings. A correlation analysis for inoculation experiments
showed strong correlations, especially between the results
for the same leaf age (Table 2). Repeated-measures
ANOVA showed no significant difference between inoculation experiments within the same leaf age (Table 3a), indicating the high repeatability of the filter-paper method.
Frequency distribution of the disease severity of the F1
population in the present study was skewed toward
resistance in the expanded leaves compared with young
leaves. That is, segregation ratios of resistance to susceptibility in young leaves and in expanded leaves were not
different from 1:1 and 3:1, respectively. In GLS in ryegrasses, the more severe susceptibility of younger seedlings
[23], and mixing of lesion types that tends to be more
severe on younger leaves on the same plant [11], have been
reported. These reports and the results of the present study
suggest that it is important to use the same leaves or leaves
Page 6 of 11
at least under the same physiological condition for repeated
evaluations of GLS severities in each plant.
The segregation ratios of resistance to susceptibility
suggested that one or two major loci are associated with
resistance in the F1 population. We then used a three-step
analysis to detect the resistant gene locus: (1) A genomewide survey of the target locus by AFLP analysis; (2) identification of the LG containing the target locus using SSR
markers; and (3) targeted mapping of the target locus by
synteny-based comparative genomics approach with rice
EST-derived intron-scanning primers. These processes rapidly detected the resistance gene in the F1 population and
identified a locus on LG 3 comprising the resistance gene
by the bulked segregant AFLP and SSR analysis, respectively. Subsequent synteny-based targeted mapping with rice
EST-derived primer pairs effectively produced an enhanced
map of LG 3 covering 133.6 cM (Figure 2).
In the targeted mapping, 67.1% of the rice EST-derived
primer pairs amplified PCR products from the male and/or
female parent. The efficiency was almost the same as our
previous study, where 64.3% of intron-scanning primer
pairs derived from ESTs on a rice Chr 9 syntenic to a ryegrass LG 5 amplified clear PCR products [10]. Although it
is not clear how much sequence similarity there is between
the rice EST-derived primers used in this study and target
ryegrass genomic sequences, improvement of the primers
using a strategy of conserved three-prime end region
(COTER) primers, which have perfect similarity to target
genomic sequences in eight bases at their 3’ ends and thus
can be highly transferable markers among temperate forage
grasses [24], might further increase the efficiency.
QTL analysis with phenotypic values for GLS resistance
in the F1 population succeeded in detecting a major LmPi2
locus for a GLS resistance on the constructed map of LG 3
(Figure 2). Although the maximum LOD scores for GLS
resistance obtained from phenotypic values of young leaves,
expanded leaves, and total data obtained from four inoculation experiments were fluctuated by age of leaves inoculated, those were observed at almost the same position on
the LG 3 map (Figure 2), suggesting that resistance conferred by the LmPi2 locus is functional at various leaf ages.
Curley et al. [11] reported high broad-sense heritabilities
of GLS resistance against an isolate GG9 and low percentages of total phenotypic variance explained for three QTLs
with ranges of 0.895–0.932 and 32.3–53.0%, respectively, in
their mapping population. They mentioned that the reason
why the percentages of total phenotypic variance explained
were lower than those expected from the broad-sense heritabilities might result from additional undetected low-effect
QTLs or distorted segregation around regions of the most
significant QTLs. By contrast, in this study, percentages
of broad-sense heritability and of phenotypic variance
explained at the highest LOD score of the LmPi2 locus,
which were calculated with total data obtained from four
Takahashi et al. BMC Plant Biology 2014, 14:303
/>
inoculation experiments, were 66.5% and 69.5%, respectively. Although we only constructed the LG 3 map to detect
the LmPi2 locus, these values are very similar, indicating
that most of the genetic factors for the resistance phenotype
against GLS in the F1 population can be explained by a
function of the single LmPi2 gene.
LmPi2 locus is clearly distinguishable from a previously identified resistance gene locus for LmPi1 [4,10],
because they each locate on a different LG. Conversely,
one of the four QTLs detected by Curley et al. [11] was
also reported to locate on the same LG as LmPi2 locus.
Unfortunately, we could not directly distinguish between
that QTL and LmPi2 locus since most grass anchor
probe-derived markers, some of which are located around
the QTL of Curley et al. [11], could not be added to our
map of LG 3 because of unsuccessful PCR amplification
in this study (Additional file 1). Thus, substantively, we
confirmed the genetic distance between these genetic loci
using information from an LG 3 map reported by Hirata
et al. [14]. On that map, the closest grass anchor probe,
CDO460, linked tightly to the QTL of Curley et al. [11]
but is genetically over 25 cM distant from SSR markers,
08-08B and 09-12H, both of which are closely linked to
LmPi2 on our map of LG 3 (Figure 2). This means the
LmPi2 locus is probably different from the QTL detected
by Curley et al. [11] and thus we suggest it as a novel locus
for GLS resistance.
Plant disease resistance genes and resistance gene analogs (RGAs) often form clusters in genomes [25-28]. Both
LmPi2 locus and the above-mentioned QTL of Curley
et al. [11] are on ryegrass LG 3, and one of the isolated
ryegrass RGAs [29] may be located on a corresponding
region between the QTLs [30]. Similarly, as shown in
Figure 2, rice Chr 1 is known to include some genes for
rice blast resistance around a syntenic region to the ryegrass LG 3. From these, a homeologous cluster for disease
resistance might be formed around the syntenic region in
both the ryegrass and rice, although disruption of synteny
between cereal grasses is often revealed in resistance gene
loci [31-33].
Most genetic factors for resistance in the F1 population
used in this study could be explained by LmPi2 locus;
therefore, the resistance locus will be useful to develop
GLS-resistant cultivars in combination with LmPi1 locus
[4] and the QTLs detected by Curley et al. [11]. One major
concern has, however, been revealed by the breeding
histories of blast-resistant cultivars in rice: the breakdown
of resistance controlled by a few major genes is one of
the most important issues in the development of blastresistant cultivars in rice [3]. Both GLS in ryegrasses and
rice blast disease are caused by a common pathogenic species, M. oryzae [6]; therefore, it is reasonable to predict
that the same phenomenon might occur in GLS-resistant
cultivars if their resistance were controlled by a few
Page 7 of 11
resistance genes. Development of convertible multiple line
cultivars composed of exchangeable multiple isogenic
lines, each containing one major resistance gene, might be
one way to develop durable resistant cultivars against
GLS, as has been the case for rice [3], although the breeding systems for ryegrasses are quite different from those of
rice because of the nature of outcrossing.
Conclusions
We identified a genetic locus for GLS resistance from
a single cross-derived F1 population of Italian ryegrass
(L. multiflorum Lam.) by bulked segregant analysis.
The resistance locus was detected on ryegrass LG 3 of
ryegrasses and explained 61.0–69.5% of the phenotypic
variance that was influenced and fluctuated by age of
leaves inoculated. Since the phenotypic variance and
percentages of broad-sense heritability were similar, most
of the genetic factors for the resistance phenotype against
GLS in the F1 population can be explained by a function
of the single resistance locus. The resistance locus was
confirmed as a novel GLS resistance locus, because the
genetic position of the locus was different from other
known loci for GLS resistance. We designated the putative
gene for the novel resistance locus as LmPi2.
Methods
Plant materials
An F1 population of Italian ryegrass (L. multiflorum
Lam.) was generated from a single cross between two
heterozygous individuals: a GLS-resistant individual of
cv. ‘Surrey’ as the female parent and a GLS-susceptible
individual of cv. ‘Minamiaoba’ as the male parent. The
cv. ‘Surrey’ and cv. ‘Minamiaoba’ are registered as PI
593651 in the Germplasm Resources Information Network (GRIN; and as JP 67746
in the National Institute of Agrobiological Sciences GeneBank (NIAS GeneBank; />index_en.php), respectively.
The F1 population, comprising 105 individuals, had
been used previously to establish the filter-paper method
for evaluation of GLS resistance in Italian ryegrass [13].
Seeds were sown in soil in 96-well trays (8 × 12 wells;
28 × 40 cm), and grown in a glasshouse at 25°C. Total
genomic DNAs of the F1 population were extracted from
leaves with a DNeasy plant mini kit (Qiagen, Hilden,
Germany) and were subjected to polymorphism analyses,
as mentioned below.
Experimental design
For evaluating GLS resistance, we employed a repeated
measures design with four inoculations composed of two
independent inoculations each with the second-youngest
leaves still expanding and the third-youngest fully expanded
leaves in the F1 population. That is, we detached two each
Takahashi et al. BMC Plant Biology 2014, 14:303
/>
of the second-youngest and the third-youngest leaves from
each genotype, and subjected the four detached leaves to
independent inoculations to make in total four inoculations
composed of two times each for the second-youngest and
the third-youngest leaves per genotype. This experimental
design with the associated samples allowed us to test the
significance of the factors genotype and inoculation. In
addition, since the leaves of each genotype were separately placed in different culture dish and subjected to
each experiment in randomized inoculation order, we
also tested the significance of the factor leaf age and
interaction between genotype and leaf age.
Preparation of conidial suspensions
A single-postule isolate of M. oryzae obtained from a natural infection of Italian ryegrass in Yamaguchi Prefecture,
Japan [4] was used. The isolate was grown on culture
medium containing 5% (w v−1) oatmeal, 2% (w v−1)
sucrose, and 3.5% (w v−1) agar and incubated in the dark
at 25°C for 10 days. Aerial mycelia were scraped off the
surface with a brush. Conidiation was induced by exposing
the mycelia to near-ultraviolet light at 25°C for 5 days,
and the conidia were suspended in distilled water. The
final density of conidia and the final concentration of
the surfactant Tween 20 in the inoculum were adjusted
to 5 × 10⁴ conidia mL−1 and 0.01% (v v−1), respectively.
Page 8 of 11
with an average score obtained with four independent
evaluations of the GLS resistance. Genomic DNAs from
these resistant and susceptible individuals were then
mixed in equal proportions to construct resistant and
susceptible bulks, respectively, and subjected to AFLP
and SSR analyses.
AFLP analysis
AFLP analyses were carried out with the IRDye fluorescent AFLP kit for large plant genome analysis (LI-COR,
Lincoln, NE, USA). We analyzed 64 AFLP selective primer
combinations: EcoRI + AX1X2/MseI + CX3X2 (X1 = A or C;
X2 = A, C, G or T; X3 = A or T). The PCR products were
separated by electrophoresis through 6% (w v−1) denaturing acrylamide gels in a LI-COR DNA analyzer
(LI-COR), according to the manufacturer’s instructions.
SSR analysis
We used the filter-paper method [13] to evaluate GLS
resistance in the F1 population. That is, leaf segments
2.5 cm long were detached from seedlings at the two- or
three-tiller stage, and were placed, abaxial side up, in
Petri dishes containing 0.7% (w v−1) agar supplemented
with 40 mg L−1 benzimidazole. Ten microliters of conidial suspension was dropped onto a 2 × 15 mm rectangle
of filter paper (No. 5B; Toyo roshi kaisha, Tokyo, Japan).
The inoculated surface of the filter paper was then
placed in contact with the leaf. The Petri dishes were
sealed with Parafilm (PM-996; Bemis Company, Neenah,
WI, USA) and incubated for 24 h in the dark at 25°C.
The filter paper was then removed, and the Petri dish
was sealed again with Micropore surgical tape (1530-0;
3 M Health Care, Saint Paul, MN, USA). The inoculated
leaves were further incubated for 7 days under short-day
conditions (8 h light/16 h dark) at 25°C; light with a
photon flux intensity of 100 μmol m−2 s−1 at plant level
was provided by fluorescent lamps (FL40SEX-N-HG;
NEC lighting, Tokyo, Japan). After the incubation, disease symptoms were evaluated according to the rating
scale shown in Table 1.
We conducted SSR analysis with 218 primer combinations that were assigned to locations on the seven LGs
corresponding to the haploid Italian ryegrass karyotype
[14]. PCR was performed in a GeneAmp PCR system
9700 (Applied Biosystems, Foster City, CA, USA) with a
10-μL reaction mixture containing 0.05 μL Hot Star Taq
(5 units μL−1; Qiagen), 1 μL 10× PCR buffer, 0.4 μL
25 mM MgCl2, 0.8 μL dNTPs (2.5 mM each), 0.2 μL
each primer (20 pmol μL−1), 20 ng genomic DNA and
5.35 μL sterile distilled water. After the first treatment of
the reaction mixture at 95°C for 15 min, the following
PCR programs were performed: 10 cycles of 94°C for
15 s, 65–56°C (−1°C per cycle) for 15 s, and 72°C for
2.5 min; 30 cycles of 94°C for 15 s, 55°C 15 s, and 72°C
for 1 min; 72°C for 7 min. The PCR products were electrophoresed through precast polyacrylamide gel (GeneGel
Excel 12.5/24; GE Healthcare, Buckinghamshire, UK) in a
Peltier temperature-regulated electrophoresis unit (GenePhor; GE Healthcare) with an electrophoresis power supply (EPS3501XL; GE Healthcare), in accordance with the
manufacturer’s instructions. Sample buffer was made as
follows: 23 mL distilled water, 250 μL 0.1 M EDTA, and
500 μL 0.5 M Tris were mixed and adjusted to pH 7.5
using acetic acid, and then 1.25 mL 1% (w v−1) xylene
cyanol and 10 mg bromophenol blue were added. Two
microliters of the sample buffer were mixed with 4 μL of
PCR product. The mixture was loaded onto a polyacrylamide gel, which was temperature regulated at 25°C, and
electrophoresed for 80 min at 600 V, 25 mA, and 15 W.
Silver staining was used to visualize the isolated PCR
products, using a silver staining kit (GE Healthcare) in a
Hoefer automated gel stainer (GE Healthcare).
Bulked segregant analysis
Design of intron-scanning primers
Ten resistant (scores range 0–1) and 10 susceptible
(score 4) individuals of the F1 population were selected
Synteny-based genetic mapping was used for marker
saturation around a target resistance gene locus by a
Artificial inoculation
Takahashi et al. BMC Plant Biology 2014, 14:303
/>
procedure previously mentioned by Takahashi et al. [10].
Synteny between ryegrass and rice has been demonstrated
by other research groups [15,16]; therefore, we selected
rice EST clones from a Chr that is syntenic to a target
LG of ryegrass from public EST map data [17] in the
online database of the Rice Genome Research Program
(RGP; Subsequently, genomic
clones [P1-derived artificial Chr (PAC) clones] that contained the nucleotide sequence information for the selected
EST clones were retrieved from the Rice Annotation
Project Database (RAP-DB; />[34]. A coding sequence (CDS) of the EST clone was concomitantly obtained with the nucleotide sequence features
of the retrieved PAC clone. The exon/intron structure of
the target gene was predicted by generating CDS-to-PAC
clone sequence alignments with Spidey [35], an online
tool for mRNA-to-genome alignment (i.
nlm.nih.gov/IEB/Research/Ostell/Spidey/). Primer pairs in
the predicted exon regions were designed to amplify
across predicted intron regions using the primer analysis
software, OLIGO v. 6.7 (Molecular Biology Insights,
Cascade, Chico, CA, USA). PCR was performed in a
GeneAmp PCR system 9700 (Applied Biosystems) with
a 10-μL reaction mixture containing the same components as those in SSR analysis. After the first treatment of
the reaction mixture at 95°C for 15 min, the following
PCR programs were performed: two cycles of 94°C for
1 min and 72°C for 2.5 min; two cycles of 94°C for 1 min
and 68°C for 2.5 min; two cycles of 94°C for 1 min, 65°C
for 30 s, and 72°C for 2 min; and 30 cycles of 94°C 1 min,
55°C for 30 s, and 72°C for 2 min. The PCR products were
then subjected to SSCP analysis (see below).
Design of primers from grass anchor probes
PCR primers were also designed from the grass anchor
probes developed by Van Deynze et al. [36]. That is,
sequence data of each probe were retrieved from GenBank
( Primer pairs were
designed from the obtained sequences using OLIGO v. 6.7
(Molecular Biology Insights). PCR was performed using the
same procedure as that for the above-mentioned intronscanning primers. The PCR products were subjected to the
SSCP analysis, as described below.
SSCP analysis
SSCP analysis was carried out with the same precast
polyacrylamide gel and apparatus used for SSR analysis.
The denaturing solution was made in a ca. 25-mL total
volume containing 23.75 mL 99% formamide, 1.25 mL
1% (w v−1) xylene cyanol, and 10 mg bromophenol blue.
To denature the PCR products, equal amounts of PCR
products and denaturing solution were mixed to make
6 μL of mixture. The mixture was treated at 95°C for
5 min to denature the DNA and was then cooled rapidly
Page 9 of 11
on ice. The denatured sample was loaded onto a polyacrylamide gel, which was temperature-regulated at 5 or
15°C, and electrophoresed for 100 min at 600 V, 25 mA,
and 15 W. Silver staining visualized the isolated PCR
products, as mentioned in the SSR analysis.
Construction of a genetic linkage map
Polymorphic markers were scored in each individual of
the F1 population. The following segregation types were
adopted: locus heterozygous in either female or male
parent representing two alleles (lm × ll or nn × np), locus
heterozygous in both parents representing two alleles
(hk × hk), and locus heterozygous in both parents representing three (ef × eg) or four alleles (ab × cd), where the
parental genotypes were coded according to JoinMap 4
[18]. The segregation types that were heterozygous in
both parents were used as bridge markers. For map construction of LG 3, the segregation data were input and
calculated with the algorithm for cross pollination (CP)
population type codes in JoinMap 4, and genetic distances
were calculated by Haldane’s mapping function. All other
calculation conditions of JoinMap 4 were used at default
settings. The genetic linkage map was drawn with MapChart 2.2 software [37].
QTL analysis
The putative location of a resistance gene on the genetic
linkage map obtained with the CP population type codes
in JoinMap 4 was determined with both genotypic and
phenotypic data of the F1 population by simple interval
mapping in MapQTL 5 [38]. A LOD threshold to declare
a significant QTL was also determined by a permutation
test (P < 0.05) with 1000 replications, in the software.
Genetic effects of the detected QTL were also estimated
by conducting two-way pseudo-testcross analysis [39]
where marker data was separated into two meioses and
converted to doubled haploid population codes as described by Van Ooijen [40].
Statistical analysis
Pearson’s correlation coefficient and chi-squared goodnessof-fit tests were calculated to analyze the phenotypic data
of the F1 population. Repeated-measures ANOVA and twoway ANOVA, and Spearman’s rank correlation coefficient
were also calculated to analyze the phenotypic data of the
F1 population and the collinearity of genetic maps between
ryegrass and rice, respectively. All these analyses were
conducted in R v. 2.15.2 software [41].
Broad-sense heritability as a ratio between estimated
genotypic variance (σ2 g) and phenotypic variance (σ2 ph)
was calculated using the formula h2 = σ2 g/(σ2 g + σ2 e)
where the σ2 e and σ2 ph are error variance and a total of
σ2 g + σ2 e, respectively. The σ2 g can be obtained as (MSg −
σ2 e)/r where the MSg is expected mean square of the
Takahashi et al. BMC Plant Biology 2014, 14:303
/>
factor genotype, which is expressed as rσ2 g + σ2 e, and the r
is the number of inoculations per genotype.
Page 10 of 11
6.
7.
Availability of supporting data
The data supporting the results of this article are included
as Additional file 1.
8.
9.
Additional file
Additional file 1: Summary of EST clones selected from rice
chromosome 1 and grass anchor probes, and results of the
SSCP analysis.
10.
11.
12.
Competing interests
The authors declare that they have no competing interests.
13.
Authors’ contributions
Conceived the experiments: WT, TS, and YM. Designed the experiments:
WT. Conducted the experiments: WT, YM, and TS. Analyzed the data: WT.
Contributed materials: WT, TS, YM, and TT. Wrote the paper: WT. All authors
read and approved the final manuscript.
Acknowledgments
We thank Mr. Y. Sumida, Mr. H. Kajiwara, and Mr. K. Nishimi (Yamaguchi
Prefectural Agriculture and Forestry General Technology Center) for kindly
providing the field isolate of M. oryzae. We thank Dr. T. Tsukiboshi (NARO
Institute of Livestock and Grassland Science) for advice on the phenotypic
evaluations of GLS resistance in the F1 population. We thank Ms. K. Akimoto
(Japan Grassland Agriculture and Forage Seed Association) and Ms. S. Sasaki
(NARO Institute of Livestock and Grassland Science) for their technical
assistance throughout this study. This work was funded by a research grant
from the Japan Racing Association and supported by the National
Agriculture and Food Research Organization (NARO), Japan.
14.
15.
16.
17.
18.
Author details
Forage Crop Research Division, NARO Institute of Livestock and Grassland
Science, 768 Senbonmatsu, Nasushiobara, Tochigi 329-2793, Japan. 2Kyushu
Experiment Station, Japan Grassland Agriculture and Forage Seed
Association, 1740 Takaba, Koshi, Kumamoto 861-1114, Japan. 3Forage Crop
Research Institute, Japan Grassland Agriculture and Forage Seed Association,
388-5 Higashiakada, Nasushiobara, Tochigi 329-2742, Japan. 4Present address:
Snow Brand Seed Co., Ltd, Hokkaido Research Station, 1066 Horonai,
Naganuma-cho, Yubari-gun, Hokkaido 069-1464, Japan. 5Present address:
Hokkaido Branch, Japan Grassland Agriculture and Forage Seed Association,
406 Higashi-Nopporo, Ebetsu, Hokkaido 069-0822, Japan.
1
Received: 7 May 2014 Accepted: 23 October 2014
19.
20.
21.
22.
23.
24.
References
1. Baldinger L, Baumung R, Zollitsch W, Knaus WF: Italian ryegrass silage in
winter feeding of organic dairy cows: forage intake, milk yield and
composition. J Sci Food Agric 2011, 91:435–442.
2. Andrighetto I, Berzaghi P, Cozzi G, Gottardo F, Zancan M: Conservation of
spring cut Italian ryegrass as round bale silage: effect of stage of
maturity on ensiling characteristics and forage nutritive value. J Agron
Crop Sci 1997, 179:251–256.
3. Miah G, Rafii MY, Ismail MR, Puteh AB, Rahim HA, Asfaliza R, Latif MA: Blast
resistance in rice: a review of conventional breeding to molecular
approaches. Mol Biol Rep 2013, 40:2369–2388.
4. Miura Y, Ding C, Ozaki R, Hirata M, Fujimori M, Takahashi W, Cai H, Mizuno K:
Development of EST-derived CAPS and AFLP markers linked to a gene for
resistance to ryegrass blast (Pyricularia sp.) in Italian ryegrass (Lolium
multiflorum Lam.). Theor Appl Genet 2005, 111:811–818.
5. Han Y, Bonos SA, Clarke BB, Meyer WA: Inheritance of resistance to gray
leaf spot disease in perennial ryegrass. Crop Sci 2006, 46:1143–1148.
25.
26.
27.
28.
29.
Couch BC, Kohn LM: A multilocus gene genealogy concordant with host
preference indicates segregation of a new species, Magnaporthe oryzae,
from M. grisea. Mycologia 2002, 94:683–693.
Bonos SA, Kubik C, Clarke BB, Meyer WA: Breeding perennial ryegrass for
resistance to gray Leaf spot. Crop Sci 2004, 44:575–580.
Trevathan LE: Response of ryegrass plant introductions to artificial
inoculation with Pyricularia grisea under greenhouse conditions. Plant Dis
1982, 66:696–697.
Reith PE, Prine GM, Blount AR: Selection for gray leaf spot disease
resistance in annual ryegrass. Soil Crop Sci Soc Florida Proc 2003, 62:69–73.
Takahashi W, Miura Y, Sasaki T, Takamizo T: Targeted mapping of rice ESTs
to the LmPi1 locus for grey leaf spot resistance in Italian ryegrass. Eur J
Plant Pathol 2010, 126:333–342.
Curley J, Sim SC, Warnke S, Leong S, Barker R, Jung G: QTL mapping of
resistance to gray leaf spot in ryegrass. Theor Appl Genet 2005, 111:1107–1117.
Michelmore RW, Paran I, Kesseli RV: Identification of markers linked to
disease-resistance genes by bulked segregant analysis: A rapid method
to detect markers in specific genomic regions by using segregating
populations. Proc Natl Acad Sci U S A 1991, 88:9828–9832.
Takahashi W, Miura Y, Sasaki T: A novel inoculation method for evaluation of
grey leaf spot resistance in Italian ryegrass. J Plant Pathol 2009, 91:171–176.
Hirata M, Cai H, Inoue M, Yuyama N, Miura Y, Komatsu T, Takamizo T,
Fujimori M: Development of simple sequence repeat (SSR) markers and
construction of an SSR-based linkage map in Italian ryegrass (Lolium
multiflorum Lam.). Theor Appl Genet 2006, 113:270–279.
Jones ES, Mahoney NL, Hayward MD, Armstead IP, Jones JG, Humphreys
MO, King IP, Kishida T, Yamada T, Balfourier F, Charmet G, Forster JW: An
enhanced molecular marker based genetic map of perennial ryegrass
(Lolium perenne) reveals comparative relationships with other Poaceae
genomes. Genome 2002, 45:282–295.
Sim S, Chang T, Curley J, Warnke SE, Barker RE, Jung G: Chromosomal
rearrangements differentiating the ryegrass genome from the Triticeae, oat,
and rice genomes using common heterologous RFLP probes. Theor Appl
Genet 2005, 110:1011–1019.
Wu J, Maehara T, Shimokawa T, Yamamoto S, Harada C, Takazaki Y, Ono N, Mukai
Y, Koike K, Yazaki J, Fujii F, Shomura A, Ando T, Kono I, Waki K, Yamamoto K, Yano
M, Matsumoto T, Sasaki T: A comprehensive rice transcript map containing
6591 expressed sequence tag sites. Plant Cell 2002, 14:525–535.
Van Ooijen JW: JoinMap ® 4, Software for the calculation of genetic linkage
maps in experimental populations. Wageningen, Netherlands: Kyazma B.V.;
2006.
Ballini E, Morel J-B, Droc G, Price A, Courtois B, Notteghem J-L, Tharreau D:
A genome-wide meta-analysis of rice blast resistance genes and quantitative
trait loci provides new insights into partial and complete resistance. Mol
Plant Microbe Interact 2008, 21:859–868.
Miura Y, Hirata M, Fujimori M: Mapping of EST-derived CAPS markers in
Italian ryegrass (Lolium multiflorum Lam.). Plant Breed 2007, 126:353–360.
Moss MA, Trevathan LE: Environmental conditions conducive to infection
of ryegrass by Pyricularia grisea. Phytopathology 1987, 77:863–866.
Uddin W, Viji G, Vincelli P: Gray leaf spot (blast) of perennial ryegrass turf: an
emerging problem for the turfgrass industry. Plant Dis 2003, 87:880–889.
Landschoot PJ, Hoyland BF: Gray leaf spot of perennial ryegrass turf in
Pennsylvania. Plant Dis 1992, 76:1280–1282.
Tamura K, Kiyoshi T, Yonemaru J: The development of highly transferable
intron-spanning markers for temperate forage grasses. Mol Breed 2012,
30:1–8.
Collins NC, Webb CA, Seah S, Ellis JG, Hulbert SH, Pryor A: The isolation and
mapping of disease resistance gene analogs in maize. Mol Plant Microbe
Interact 1998, 11:968–978.
Kanazin V, Marek LF, Shoemaker RC: Resistance gene analogs are
conserved and clustered in soybean. Proc Natl Acad Sci U S A 1996,
93:11746–11750.
Shen KA, Meyers BC, Islam-Faridi MN, Chin DB, Stelly DM, Michelmore RW:
Resistance gene candidates identified by PCR with degenerate
oligonucleotide primers map to clusters of resistance genes in lettuce.
Mol Plant Microbe Interact 1998, 11:815–823.
Leister D, Kurth J, Laurie DA, Yano M, Sasaki T, Devos K, Graner A,
Schulze-Lefert P: Rapid reorganization of resistance gene homologues in
cereal genomes. Proc Natl Acad Sci U S A 1998, 95:370–375.
Ikeda S: Isolation of disease resistance gene analogs from Italian ryegrass
(Lolium multiflorum Lam.). Grassl Sci 2005, 51:63–70.
Takahashi et al. BMC Plant Biology 2014, 14:303
/>
Page 11 of 11
30. Miura Y, Ding C, Hirata M, Takahashi W: Genetic mapping of disease
resistance gene analogs from the Italian ryegrass (Lolium multiflorum
Lam.) genome. Breed Sci 2008, 58:469–473.
31. Brueggeman R, Rostoks N, Kudrna D, Kilian A, Han F, Chen J, Druka A,
Steffenson B, Kleinhofs A: The barley stem rust-resistance gene Rpg1 is a
novel disease-resistance gene with homology to receptor kinases.
Proc Natl Acad Sci U S A 2002, 99:9328–9333.
32. Perovic D, Stein N, Zhang H, Drescher A, Prasad M, Kota R, Kopahnke D,
Graner A: An integrated approach for comparative mapping in rice and
barley with special reference to the Rph16 resistance locus. Funct Integr
Genomics 2004, 4:74–83.
33. Mammadov JA, Steffenson BJ, Saghai Maroof MA: High-resolution
mapping of the barley leaf rust resistance gene Rph5 using barley
expressed sequence tags (ESTs) and synteny with rice. Theor Appl Genet
2005, 111:1651–1660.
34. Sakai H, Lee SS, Tanaka T, Numa H, Kim J, Kawahara Y, Wakimoto H, Yang C-c,
Iwamoto M, Abe T, Yamada Y, Muto A, Inokuchi H, Ikemura T, Matsumoto T,
Sasaki T, Itoh T: Rice Annotation Project Database (RAP-DB): an integrative
and interactive database for rice genomics. Plant Cell Physiol 2013, 54:e6.
35. Wheelan SJ, Church DM, Ostell JM: Spidey: a tool for mRNA-to-genomic
alignments. Genome Res 2001, 11:1952–1957.
36. Van Deynze AE, Sorrells ME, Park WD, Ayres NM, Fu H, Cartinhour SW, Paul E,
McCouch SR: Anchor probes for comparative mapping of grass genera.
Theor Appl Genet 1998, 97:356–369.
37. Voorrips RE: MapChart: software for the graphical presentation of linkage
maps and QTLs. J Hered 2002, 93:77–78.
38. Van Ooijen JW: MapQTL ® 5, Software for the mapping of quantitative trait
loci in experimental populations. Wageningen, Netherlands: Kyazma B.V.;
2004.
39. Grattapaglia D, Sederoff R: Genetic linkage maps of Eucalyptus grandis
and Eucalyptus urophylla using a pseudo-testcross: mapping strategy
and RAPD markers. Genetics 1994, 137:1121–1137.
40. Van Ooijen JW: MapQTL ® 6, Software for the mapping of quantitative trait
loci in experimental populations of diploid species. Wageningen, Netherlands:
Kyazma B.V.; 2009.
41. R Core Team: R: a language and environment for statistical computing.
[ />doi:10.1186/s12870-014-0303-6
Cite this article as: Takahashi et al.: Identification of a novel major locus for
gray leaf spot resistance in Italian ryegrass (Lolium multiflorum Lam.) BMC
Plant Biology 2014 14:303.
Submit your next manuscript to BioMed Central
and take full advantage of:
• Convenient online submission
• Thorough peer review
• No space constraints or color figure charges
• Immediate publication on acceptance
• Inclusion in PubMed, CAS, Scopus and Google Scholar
• Research which is freely available for redistribution
Submit your manuscript at
www.biomedcentral.com/submit