Identification of candidate genes, regions and markers for pre-harvest sprouting resistance in wheat (Triticum aestivum L.)
Bạn đang xem bản rút gọn của tài liệu. Xem và tải ngay bản đầy đủ của tài liệu tại đây (1.98 MB, 12 trang )
Cabral et al. BMC Plant Biology 2014, 14:340
/>
RESEARCH ARTICLE
Open Access
Identification of candidate genes, regions and
markers for pre-harvest sprouting resistance in
wheat (Triticum aestivum L.)
Adrian L Cabral1,3, Mark C Jordan1*, Curt A McCartney1, Frank M You1, D Gavin Humphreys1, Ron MacLachlan2
and Curtis J Pozniak2
Abstract
Background: Pre-harvest sprouting (PHS) of wheat grain leads to a reduction in grain yield and quality. The
availability of markers for marker-assisted selection (MAS) of PHS resistance will serve to enhance breeding selection
and advancement of lines for cultivar development. The aim of this study was to identify candidate regions and
develop molecular markers for PHS resistance in wheat. This was achieved via high density mapping of single
nucleotide polymorphism (SNP) markers from an Illumina 90 K Infinium Custom Beadchip in a doubled haploid
(DH) population derived from a RL4452/‘AC Domain’ cross and subsequent detection of quantitative trait loci (QTL)
for PHS related traits (falling number [FN], germination index [GI] and sprouting index [SI]). SNP marker sequences
flanking QTL were used to locate colinear regions in Brachypodium and rice, and identify genic markers associated
with PHS resistance that can be utilized for MAS in wheat.
Results: A linkage map spanning 2569.4 cM was constructed with a total of 12,201 SNP, simple sequence repeat
(SSR), diversity arrays technology (DArT) and expressed sequence tag (EST) markers. QTL analyses using Multiple
Interval Mapping (MIM) identified four QTL for PHS resistance traits on chromosomes 3B, 4A, 7B and 7D. Sequences
of SNPs flanking these QTL were subject to a BLASTN search on the International Wheat Genome Sequencing
Consortium (IWGSC) database ( Best survey sequence hits were
subject to a BLASTN search on Gramene (www.gramene.org) against both Brachypodium and rice databases, and
candidate genes and regions for PHS resistance were identified. A total of 18 SNP flanking sequences on
chromosomes 3B, 4A, 7B and 7D were converted to KASP markers and validated with matching genotype calls
of Infinium SNP data.
Conclusions: Our study identified candidate genes involved in abscissic acid (ABA) and gibberellin (GA) metabolism,
and flowering time in four genomic regions of Brachypodium and rice respectively, in addition to 18 KASP markers for
PHS resistance in wheat. These markers can be deployed in future genetic studies of PHS resistance and might also be
useful in the evaluation of PHS in germplasm and breeding material.
Keywords: Wheat, Pre-harvest sprouting, Quantitative trait loci, Candidate genes
* Correspondence:
1
Cereal Research Centre, Agriculture and Agri-Food Canada, Morden, MB
R6M 1Y5, Canada
Full list of author information is available at the end of the article
© 2014 Cabral et al.; licensee BioMed Central Ltd. This is an Open Access article distributed under the terms of the Creative
Commons Attribution License ( which permits unrestricted use, distribution, and
reproduction in any medium, provided the original work is properly credited. The Creative Commons Public Domain
Dedication waiver ( applies to the data made available in this article,
unless otherwise stated.
Cabral et al. BMC Plant Biology 2014, 14:340
/>
Background
Preharvest sprouting is observed across all major wheat
growing regions in the world. In western Canada, the
average annual losses due to PHS are approximately $100
million [1]. Insufficient seed dormancy is one major factor
contributing to pre-harvest sprouting losses, particularly
under humid, wet weather conditions at harvest. PHS
resistant/tolerant wheat cultivars and land races have been
identified globally, with origins mainly in Canada, USA,
Australia, China, Japan, South Africa, Kenya and New
Zealand [2]. Canadian red-seeded spring wheat cultivars
(AC Domain, AC Majestic, Columbus, Pasqua, Waskada,
Harvest) and white spring wheat genotypes (AC Vista,
Snowbird, Snowstar, Kanata, HY361) are known to carry
resistance to PHS, all having derived their resistance alleles from a red-seeded breeding line RL4137 [1,3].
Of the three PHS traits, FN [4,5] is most commonly
used to quantify PHS [6] and indirectly measures the
activity of the enzyme α-amylase that breaks down
starch in germinating grains. Degradation of grain-starch
as the result of greater α-amylase activitys result in lower
FN values and are an indirect indication of low levels of
PHS resistance or dormancy. Two other important traits
for the characterization of PHS are GI [7,8] and SI [9].
While GI values deduced from seed-germination tests in
petri dishes are a direct measure of seed dormancy, SI
values obtained via artificial wetting of intact wheat spikes,
detect dormancy and properties of the inflorescence that
affect PHS [5].
Quantitative trait loci (QTL) linked to PHS traits have
been reported on all 21 hexaploid wheat chromosomes
[10-13], mainly on 3A [14-17], 3B and 3D [17-19], 4A
[2,20-24], 5A [25,26], 6B and 7D [27]. Of these, the PHS
QTL on 4A has consistently been identified in several
different mapping populations. The RL4452/‘AC Domain’
DH population has been extensively characterized for
QTL detection of PHS [28], agronomic [29] and quality
traits [30], in several past studies that involved a small
number of molecular markers. These studies relied mainly
on SSR marker data for the preparation of genetic maps
and locating QTL on chromosomes. With low costs and
rapid advancements in sequencing technology, thousands
of molecular markers, mainly SNPs have become available
in wheat. Additionally, access to genome sequence information for rice [31] and Brachypodium [32] will now
facilitate comparative mapping for the identification of
genes underlying various important quantitative traits in
wheat.
Interaction among PHS QTL (QxQ, QTL epistasis),
and the environment (QxE, QxQxE) have been reported
from various studies [18,33-35] aimed at understanding
the complex genetic structure of QTL. As chromosomal
locations of PHS QTL are not uniform across populations,
obtaining a consensus on the precise genomic location of
Page 2 of 12
important trait QTL is required for fine mapping and
cloning studies. Meta-QTL or Meta-analysis [36] integrates several QTL studies of a common trait to provide
a meaningful estimate of the exact location and number
of QTL for that given trait. Eight PHS QTL on chromosomes 3A, 3B, 3D and 4A were identified in a Meta-QTL
study [37] involving 15 different populations (five DH;
nine recombinant inbred line [RIL]; one backcross [BC]).
A high level of genome-synteny exists among wheat,
Brachypodium and rice, with wheat being more closely
related to Brachypodium than to rice [38,39]. Conservation or collinearity of genetic markers [40,41] and greater
structural similarities in the coding regions of orthologous
genes [39] of wheat and Brachypodium have been reported. However, given differences in gene content in
orthologous regions of wheat, Brachypodium [41] and rice
[42], it might be beneficial to use both genomic sequences
of Brachypodium and rice in comparative mapping studies
for map based cloning and gene discovery in wheat.
Our study deployed SNP markers from a 90K Infinium
iSelect Custom Beadchip [43], in addition to available
SSR, DArT and ESTs, to generate high density genetic
maps for the identification of PHS resistance QTL. Sequences corresponding to polymorphic SNPs flanking
PHS QTL were analyzed against genomic sequences of
Brachypodium and rice. The objectives of our research
were a) to identify candidate genes and regions in
Brachypodium and rice that are orthologous to PHS
resistance QTL intervals in wheat, and b) to utilize sequences of SNPs flanking PHS QTL to develop KASP
markers for MAS of PHS resistance.
Results
Linkage mapping
A total of 12,201 SNP, SSR, DArT and EST markers were
mapped to all 21 wheat chromosomes. The resulting
linkage map spanning 2569.4 cM is reported in Additional
file 1. Of the 12,201 markers, 11,282 or 92.5% were SNPs,
while the remaining 919 or 7.5% comprised SSR, DArT and
EST markers. The largest number of SNP markers (6,291)
were distributed across the B genome, followed by 4,125
SNPs mapped to the A genome, and 1,785 SNP markers on
the D genome (Table 1).
QTL analysis
PHS datasets were analyzed with both MIM and simple
interval mapping (SIM; data not shown) methods. As
results of both methods were very similar, only those of
MIM were reported in this study. The MIM [44] analysis
identified four QTL with significant effects, located
across chromosomes 3B, 4A, 7B and 7D. Each of these
four QTL appeared in two or more environments and
had peak LOD scores greater than the critical threshold
LOD at 5% significance levels (α0.05) [45]. Coincident
Cabral et al. BMC Plant Biology 2014, 14:340
/>
Page 3 of 12
Table 1 Cumulative map-lengths of A, B and D genome chromosomes alongside corresponding genome-wise distribution
of SNP markers mapped in the hexaploid DH population of RL4452/‘AC Domain’
Genome
Map length (cM)
Mapped markers
SNPs
SSRs, DArTs & ESTs
% SNPs
A
888.4
4125
3816
309
92.5
B
940.6
6291
5871
420
93.3
D
(A + B + D)
740.4
1785
1595
190
89.4
2569.4
12201
11282
919
92.5
QTL for GI, SI and FN were located on chromosome
4A. Across trials, RL4452 alleles on 3B and 7B provided
PHS resistance as they reduced SI. However, ‘AC Domain’
alleles also provided PHS resistance as they increased FN
on 4A and 7D (with the exception of the Glenlea 2005
trial in which they reduced FN on 7D) and reduced SI and
GI on 4A (Table 2).
Candidate regions and genes for PHS resistance
Sequences of SNPs flanking QTL for PHS resistance on
chromosomes 3B, 4A, 7B and 7D were subjected to
BLASTN searches on the IWGSC and Gramene databases
and returned hits to candidate regions in Brachypodium
and rice (Table 3). Genetic and physical maps displaying
orthologous regions for PHS resistance in wheat, Brachypodium and rice are given in Figures 1a and b. A 7.8 cM
QTL interval on chromosome 3B was orthologous to
a ~7.0 Mb region (46,936,013 – 53,904,697 bp) on
chromosome 2 of Brachypodium (Bradi2) and to a ~8.7 Mb
(27,906,608 – 36,656,340 bp) region on chromosome 1 of
rice (Os01). The 4A QTL interval was 12.2 cM and was
orthologous to a ~0.52 Mb region (481,247 – 1,030,837 bp)
on chromosome 1 of Brachypodium (Bradi1) and to
a ~6.9 Mb (29,401,950 – 36,320,679 bp) region on
chromosome 3 of rice (Os03). On chromosome 7B.1,
the QTL interval spanned 1.7 cM and was orthologous to
a ~1.8 Mb region (42,620,688 – 44,420,413 bp) on
chromosome 1 of Brachypodium (Bradi1) and to a ~1 Mb
(5,588,196 – 6,603,975 bp) region on chromosome 6 of
rice (Os06). The QTL interval on 7D.2 was 7.7 cM and
was orthologous to a ~2.0 Mb region (47,249,027 –
49,335,697 bp) on chromosome 1 of Brachypodium
(Bradi1), and a ~0.5 Mb region (2,558,015 – 3,079,059 bp)
on chromosome 6 of rice (Os06).
Table 2 Results of Multiple Interval Mapping (MIM): four QTL for PHS traits (GI, SI, FN) identified on chromosomes 3B,
4A, 7B.1 and 7D.2 in a DH population of RL4452/‘AC Domain’ replicated in multi-year environments (Glenlea and
Winnipeg in Manitoba; Swift Current in Saskatchewan)
QTL
Trial dataset
Chromosome (Linkage gp.)
QTL peak location (cM)
Additivea
% PV (R2)
LOD
α0.05
4A
59.3
−0.04
27.6
12.83
3.86
Germination Index (GI)
QGi.crc-4A
Glenlea2005
QGi.crc-4A
Winnipeg2004
4A
59.5
−0.05
58.1
34.56
3.93
QGi.crc-4A
Winnipeg2005
4A
59.4
−0.02
29.6
13.93
3.86
QSi.crc-3B
Glenlea2005
3B
63.6
0.43
12.7
5.39
3.96
QSi.crc-3B
Winnipeg2004
3B
70.2
0.53
16.1
6.97
3.95
QSi.crc-4A
Glenlea2005
4A
59.3
−0.57
20.5
9.12
3.96
Sprouting Index (SI)
QSi.crc-4A
Winnipeg2004
4A
56.8
−0.85
32.1
15.38
3.95
QSi.crc-4A
Winnipeg2005
4A
58.0
−0.44
12.7
5.41
3.90
QSi.crc-4A
Swift Current2003
58.0
−0.49
10.5
4.41
3.94
QSi.crc-7B
Swift Current2003
7B.1
55.6
0.78
20.5
9.12
3.94
QSi.crc-7B
Swift Current2004
7B.1
56.4
0.59
11.8
4.99
3.92
4A
Falling Number (FN)
QFn.crc-4A
Glenlea2005
4A
64.2
22.49
11.2
4.71
3.83
QFn.crc-4A
Winnipeg2004
4A
56.2
45.45
25.8
11.85
3.95
QFn.crc-7D
Glenlea2003
7D.2
18.9
33.40
13.2
5.64
3.99
QFn.crc-7D
Glenlea2005
7D.2
20.2
−33.49
20.6
9.19
4.13
a
Positive or negative additive values relate to allele effects of the AC Domain parent.
Cabral et al. BMC Plant Biology 2014, 14:340
/>
Page 4 of 12
Table 3 Genetic map locations of SNP markers flanking PHS QTL on chromosomes 3B, 4A, 7B.1 and 7D.2 in a wheat
DH population of a RL4452/‘AC Domain’ cross and their corresponding physical locations/candidate regions in
Brachypodium distachyon and rice
SNP marker
Map
(cM)
Survey sequence
BLASTN hits to Brachypodium genes
BLASTN hits to Rice genes
Contig no.
(genomic regions in parenthesis)
(genomic regions in parenthesis)
Chromosome 3B
wsnp_Ku_c6825_11858665
63.0
10469056
Bradi2g46510 (46,936,013-46,952,333)
LOC_Os01g48680 (27,906,608-27,920,980)
wsnp_Ex_c4769_8510104
63.0
10613849
Bradi2g46590 (47,003,547-47,009,237)
LOC_Os01g48790 (27,983,688-27,990,383)
RAC875_rep_c113906_294
64.0
10557485
Bradi2g51030 (50,699,047-50,702,962)
LOC_Os01g56200 (32,367,683-32,371,816)
BobWhite_c46650_260
64.0
10441023
Bradi2g51017 (50,685,769-50,695,622)
LOC_Os01g56190 (32,350,513-32,360,765)
Kukri_c4310_489
64.6
10759762
Bradi2g51040 (50,703,620-50,708,573)
LOC_Os02g13910 (7,558,777-7,568,835)
TA002966-0294
65.1
10635317
Bradi2g46710 (47,135,003-47,136,451)
LOC_Os01g56580 (32,615,694-32,622,894)
10712014
Bradi2g49590 (49,632,703-49,638,684)
LOC_Os01g54100 (31,111,291-31,116,151)
BS00078127_51
65.7
10754454
Bradi2g51530 (51,119,031-51,123,083)
LOC_Os01g56810 (32,788,487-32,792,751)
Kukri_c21818_519
66.2
10455881
Bradi2g51620 (51,191,828-51,198,372)
LOC_Os01g56910 (32,869,293-32,878,216)
wsnp_Ra_rep_c74606_72470419
66.8
10523702
Bradi2g51710 (51,287,497-51,313,181
LOC_Os01g57082 (32,984,982-32,994,519)
IACX3871
66.8
10521243
Bradi2g51890 (51,441,692-51,446,044)
LOC_Os01g57450 (33,200,667-33,201,485)
Excalibur_c73633_120
67.3
10673653
Bradi2g48430 (48,731,037-48,732,308)
LOC_Os01g52260 (30,042,527-30,043,938)
wsnp_Ex_c5547_9774195
68.4
10770075
Bradi2g53020 (52,250,581-52,257,598)
LOC_Os01g59670 (34,514,117-34,520,887)
wsnp_Ex_rep_c69664_68618163
68.4
10477393
Bradi2g52540 (51,883,735-51,889,623)
LOC_Os01g58680 (33,919,393-33,924,664)
wsnp_Ku_rep_c72700_72370664
69.0
10484009
Bradi2g53340 (52,475,967-52,481,992)
LOC_Os01g60180 (34,803,492-34,804,046)
RAC875_rep_c116515_181
69.0
1068363
Bradi2g53130 (52,329,608-52,334,764)
LOC_Os01g59880 (34,629,359-34,635,205)
BobWhite_rep_c64944_264
69.6
1040995
Bradi2g53970 (52,969,054-52,973,550)
LOC_Os01g61400 (35,505,448-35,508,543)
Tdurum_contig38427_237
70.2
10658322
Bradi2g55100 (53,817,575-53,821,406)
LOC_Os01g63250 (36,656,340-36,660,768)
Tdurum_contig27495_111
70.2
10538814
Bradi2g53450 (52,567,117-52,569,109)
LOC_Os01g60430 (34,946,618-34,949,027)
Kasp3B(survey)_17
70.8
10495803
Bradi2g55230 (53,904,697-53,906,640)
LOC_Os03g60200 (34,238,474-34,241,647)
Chromosome 4A
BS00068243_51
53.8
7023446
Bradi2g12660 (11,006,410-11,009,518)
LOC_Os01g28244 (15,823,709-15,829,849)
CD920298
58.6
7174272
Bradi1g00600 (481,247-482,062)
LOC_Os03g64290 (36,320,679-36,333,253)
Kukri_c12563_52
59.3
7128338
Bradi1g51817 (50,293,482-50,308,189)
LOC_Os05g37500 (21,943,044-21,959,786)
Bradi1g00760 (565,638-570,467)!
LOC_Os03g63370 (35,809,964-35,814,672)!
BS00072025_51
59.3
7168762
Bradi1g00730 (555,714-559,377)
LOC_Os03g64210 (36,281,400-36,283,271)
RAC875_c21369_425
59.8
7070429
Bradi1g00820 (594,037-597,877)
LOC_Os03g64190 (36,265,672-36,271,489)
IAAV3132
59.8
7114346
Bradi1g01007 (695,876-702,209)
LOC_Os03g63920 (36,110,059-36,119,639)
wsnp_Ex_c5470_9657856
60.4
7174581
Bradi1g01070 (731,493-733,959)
LOC_Os03g51390 (29,401,950-29,403,115)
RAC875_c25124_182
61.6
7061368
Bradi1g01227 (825,624-828,017)
LOC_Os03g63680 (35,968,492-35,970,517)
wsnp_Ku_c4924_8816643
62.7
501046
Bradi1g52230 (50,605,616-50,611,584)
LOC_Os02g29140 (17,257,940-17,266,066)
3540051
Bradi1G00720 (552,185-555,346)!
-
864232
-
LOC_Os03g60710 (34,502,945-34,508,158)!
7119833
Bradi1g49910 (48,564,700-48,565,690)
LOC_Os06g16640 (9,564,124-9,566,967)
7139864
Bradi1g00820 (594,037-597,877)!
-
Excalibur_c24511_1196
63.2
5949088
-
LOC_Os03g53500 (30,679,685-30,689,230)!
Tdurum_contig13489_292
63.8
7124315
Bradi1g01500 (976,919-979,161)
LOC_Os03g63470 (35,855,445-35,860,549)
wsnp_JD_c38619_27992279
66.0
7098863
Bradi1g01580 (1,030,837-1,034,525)
LOC_Os03g63410 (35,826,263-35,830,205)
Cabral et al. BMC Plant Biology 2014, 14:340
/>
Page 5 of 12
Table 3 Genetic map locations of SNP markers flanking PHS QTL on chromosomes 3B, 4A, 7B.1 and 7D.2 in a wheat
DH population of a RL4452/‘AC Domain’ cross and their corresponding physical locations/candidate regions in
Brachypodium distachyon and rice (Continued)
Chromosome 7B.1
CAP7_c10566_170
55.3
3116911
Bradi1G46150 (44,420,413-44,423,001)!
LOC_Os06g10710 (5,588,196-5,594,757)
BobWhite_rep_c64768_264
55.3
3032904
Bradi1G46137 (44,416,953-44,419,121)
LOC_Os06g10760 (5,619,105-5,621,750)
Tdurum_contig84962_256
55.3
3032904
Bradi1G46137 (44,416,953-44,419,121)
LOC_Os06g10760 (5,619,105-5,621,750)
BS00022498_51
55.3
3115694
Bradi1G46060 (44,341,065-44,348,362)
LOC_Os06g10880 (5,677,080-5,682,126)
wsnp_Ex_c908_1754208
56.4
3153345
Bradi1g45210 (43,434,039-43,436,397)
LOC_Os06g12270 (6,603,975-6,604,635)
Tdurum_contig68347_605
56.4
3153345
Bradi1G45210 (43,434,039-43,436,397)
LOC_Os06g12270 (6,603,975-6,604,635)
RFL_Contig124_558
57
3126436
Bradi1g44967 (43,073,188-43,080,744)!
BobWhite_c46772_564
57
3109791
LOC_Os06g12280 (6,605,479-6,608,454)
-
Bradi1G44860 (42,951,596-42,953,323)
LOC_Os06g12990 (7,118,829-7,120,448)
Bradi1G44850 (42,949,245-42,951,551)
-
GENE-4333_211
57
3153554
Bradi1G44790 (42,899,346-42,900,477)
-
Tdurum_contig51087_573
57
3165147
Bradi1G44440 (42,620,688-42,629,717)
LOC_Os06g13820 (7,661,691-7,670,035)
RAC875_c1829_321
14.3
Bradi1g48660 (47,326,685-47,327,292)
LOC_Os06g06460 (3,040,092-3,041,121)
Chromosome 7D.2
3849095
Kukri_c32845_116
14.3
3964075
Bradi1g50860 (49,335,697-49,339,907)
LOC_Os06g05660 (2,558,015-2,562,242)
TA002473-0717
14.3
3929478
Bradi1g49140 (47,871,489-47,874,424)
LOC_Os06g05700 (2,579,088-2,581,726)
wsnp_CAP8_rep_c9647_4198594
22.0
3945994
Bradi1g48610 (47,249,027-47,255,499)!
LOC_Os06g06560 (3,079,059-3,086,808)
!
Weak hit to genomic regions in Brachpodium or rice that is orthologous to the QTL interval for PHS resistance in wheat.
Best hits that do not correspond to the candidate region in Brachpodium or rice are in italics.
Brachypodium/rice candidates for PHS resistance orthologous to consensus regions on wheat chromosomes 3B,
4A, 7B and 7D (Additional file 2) were identified. In the
3B region there are 895 genes in the Brachypodium orthologous region and 1375 in the rice region. The 4A region
had 98 genes in the Brachypodium region and 1159 in
rice, while the 7B region had 148 in Brachypodium and
155 in rice and the 7D region had 235 in Brachypodium
and 88 in rice. Genes involved in ABA and GA metabolism as well as those affecting flowering time were present
in the QTL regions. Among these were Bradi2g49795/
Os01g54490 (FT PEBP [phosphatidylethanolamine - binding protein] homologous to Flowering Locus T gene),
Os01g61100, Os01g63030 (Far-red impaired responsive
[FAR1] family protein) orthologous to chromosome
3B, Bradi1g00950/Os03g63970 (gibberellin 20 [GA20]
oxidase putative expressed protein), Os03g56630, Os03g62660
(Far-red impaired responsive [FAR1] family protein)
orthologous to 4A, Bradi1g46060/Os06g10880 (ABF3/
ABF2 - abscissic acid responsive elements) orthologous
to 7B, Bradi1g48640, Bradi1g48650, Bradi1g48822, Bradi1g48816 (Far-red impaired responsive [FAR1] family
protein), Bradi1g48690, Bradi1g50240 (VRN1-AP2/B3 - like
transcriptional factor family protein) and Bradi1g48830/
Os06g06320 (Vrn3/FT PEBP [phosphatidylethanolamine binding protein] homologous to Flowering Locus T gene)
orthologous to chromosome 7D.
Development and validation of KASP primers
A total of 18 KASP markers, five each for chromosomes
3B and 7B.1, and four each for chromosomes 4A and
7D.2 (Table 4) were developed from sequences of SNPs
flanking QTL for PHS resistance. Genetic map locations
of individual KASP markers were identical to the respective SNP from which they were derived. Primer sets
of all 18 KASP markers are listed in Additional file 3.
Further, we validated the conversion of these 18 KASPs
from matching genotype calls of Infinium SNP data on
183 DH progeny genotypes. Four DH progeny genotypes
of the RL4452/‘AC Domain’ cross were identified to
carry PHS resistance on chromosomes 3B, 4A, 7B and
7D (Additional file 4).
Discussion
The objectives of our research were to identify candidate
regions for PHS resistance QTL of wheat and develop
KASP markers (for MAS) from sequences of SNPs flanking such QTL. This is an important step in the process
of map-based cloning of genes that underlie important
quantitative traits like PHS resistance. Our objectives
were achieved using 11,282 SNPs from the 90 k Infinium
Custom Beadchip to develop a high density linkage map
in the RL4452/‘AC Domain’ mapping population and subsequently detect QTL for PHS resistance on chromosomes 3B, 4A, 7B and 7D. Comparative mapping utilizing
Cabral et al. BMC Plant Biology 2014, 14:340
/>
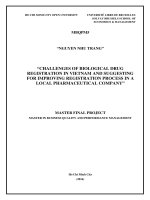
Figure 1 (See legend on next page.)
Page 6 of 12
Cabral et al. BMC Plant Biology 2014, 14:340
/>
Page 7 of 12
(See figure on previous page.)
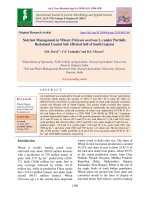
Figure 1 Location of QTL and syntenic regions in Brachpodium and rice. a. Location of QTL and flanking markers for PHS resistance on a)
wheat chromosome 3B and its candidate regions on Brachypodium Bd2 and rice Os1, and b) chromosome 7B.1 and its candidate regions on
Brachypodium Bd1 and rice Os6. b. Location of QTL and flanking markers for PHS resistance on a) wheat chromosome 4A and its candidate
regions on Brachypodium Bd1 and rice Os3, and b) chromosome 7D.2 and its candidate regions on Brachypodium Bd1 and rice Os6.
sequences of SNPs flanking PHS resistance QTL enabled
identification of candidate genes and regions in Brachypodium and rice. The resulting 18 KASP markers can be deployed in future genetic studies of PHS, and in evaluation
of PHS in germplasm and breeding material.
Of the 12,201 mapped markers, 11,282 or 92.5% were
SNP markers, while the remaining 919 or 7.5% were
SSR, DArT and EST markers. The B genome chromosomes accounted for the largest number of 6291 SNP
markers, followed by the A genome with 4125 SNPs,
and the D genome with 1785 SNP markers. A likely explanation for larger numbers of B genome SNP markers
could be the greater genetic diversity of B genome species when compared to the A and D genome species
[46,47]. A faster rate of evolution of the B genome due
to greater polymorphism and duplication events, in
addition to greater genetic diversity brought about by
cross pollination were cited [48-50] as possible explanations for findings of a greater number of ESTs associated
with more unique loci on the B genome when compared
to the A and D genomes.
PHS datasets were analyzed with both MIM and SIM
(data not shown) methods. Because results of both
methods were very similar, only those of the MIM analyses
were reported. As QTL identified using MIM were robust
and supported by SIM results, it is unlikely that additional
large effect QTL involved in epistatic interactions might
have been detected using other QTL mapping methods
that detect both main effect (M-QTL) and epistatic QTL
(E-QTL). Further, a Meta-QTL study [37] reporting PHS
QTL on 4A and group 3 chromosomes support significant
PHS QTL identified on chromosome 3B and 4A of our
study.
The most consistent of the four PHS QTL identified
on chromosomes 3B, 4A, 7B and 7D were located on
chromosome 4A; GI, SI and FN trait QTL each accounting for 58.1%, 32.1% and 25.8% of the phenotypic variation
in their respective traits. The QTL for these PHS traits
were coincident and maybe associated with the same
gene(s). These findings might suggest that chromosome
4A is involved in regulation of PHS trait QTL in our test
population. Previous reports of the association of PHS
Table 4 A list of 18 Competitive Allele-Specific PCR (KASP) markers developed for MAS of PHS from SNPs flanking PHS
QTL on chromosomes 3B, 4A, 7B and 7D in a DH population of a RL4452/‘AC Domain’ cross
Sl.
KASP marker
Source SNP
1.
Kasp3B_wsnp_Ku_rep_c72700_72370664
wsnp_Ku_rep_c72700_72370664
Chr
3B
SI
PHS trait
2.
Kasp3B_RAC875_rep_c116515_181,
RAC875_rep_c116515_181,
3B
SI
3.
Kasp3B_BobWhite_rep_c64944_264
BobWhite_rep_c64944_264
3B
SI
4.
Kasp3B_wsnp_Ex_c16378_24870688
wsnp_Ex_c16378_24870688
3B
SI
5.
Kasp3B_RAC875_c530_354
RAC875_c530_354
3B
SI
6.
Kasp4A_BS00072025_51
BS00072025_51
4A
GI, SI, FN
7.
Kasp4A_Kukri_c12563_52
Kukri_c12563_52
4A
GI, SI, FN
8.
Kasp4A_RAC875_c21369_425
RAC875_c21369_425
4A
GI, SI, FN
9.
Kasp4A_wsnp_Ex_c16175_24619793
wsnp_Ex_c16175_24619793
4A
GI, SI, FN
10
Kasp7B_wsnp_Ex_c908_1754208
wsnp_Ex_c908_1754208
7B.1
SI
11
Kasp7B_RFL_Contig124_558
RFL_Contig124_558
7B.1
SI
12
Kasp7B_RAC875_c1638_165
RAC875_c1638_165
7B.1
SI
13
Kasp7B_wsnp_Ex_rep_c69639_68590556
wsnp_Ex_rep_c69639_68590556
7B.1
SI
14
Kasp7B_Ku_c32389_1009
Ku_c32389_1009
7B.1
SI
15
Kasp7D_Excalibur_c22419_460
Excalibur_c22419_460
7D.2
FN
16
Kasp7D_RAC875_c1829_321
RAC875_c1829_321
7D.2
FN
17
Kasp7D_Kukri_c32845_116
Kukri_c32845_116
7D.2
FN
18
Kasp7D_wsnp_CAP8_rep_c9647_4198594
wsnp_CAP8_rep_c9647_4198594
7D.2
FN
Cabral et al. BMC Plant Biology 2014, 14:340
/>
traits with chromosome 4A [2,20-24], support the
importance of this QTL for PHS
In addition to a major SI QTL on 4A, two other QTL
for SI were identified on chromosomes 3B and 7B.1.
Both SI QTL on 3B and 7B.1 were detected in two of six
environments. QTL that provide tolerance to late maturity α- amylase (LMA) have been mapped on 3BS and
7BL in an Australian wheat cross Cranbrook/Halberd
[51]. In both studies, the SSR markers Xwmc623,
Xwmc808, Xgwm72, Xwmc612, Xgwm285, Xwmc693,
Xwmc1 (3B LMA QTL interval) and Xgwm577, Xwmc273,
Xwmc276 (7B LMA QTL interval) also flanked corresponding PHS QTL intervals on chromosomes 3B.1 and
7B.1 respectively (data not shown). Further, alleles of a
regulator gene Vp-1B on 3B have been reported to influence grain dormancy in Chinese wheat varieties [19]. In a
follow up study [52], the VP-1B locus was validated in a
white-grained Chinese landrace Wanxianbaimaizi (high
seed dormancy and PHS tolerance) using SSR markers
and a gene-specific primer Vp1. A CIM analysis identified
a seed dormancy QTL QSd.ahau-3B on 3B flanked by
Vp1 which is linked to an SSR marker Xwmc446 that also
happens to flank the PHS QTL interval on chromosome
3B of our study. The above findings suggest that PHS and
LMA QTL on chromosomes 3B and 7B are likely the
same.
‘AC Domain’ alleles contributed to increasing the FN
on 7D (linkage group 7D.2), with the exception of the
Glenlea 2005 trial, wherein a negative additive score was
observed for the FN. While the FN QTL on chromosome
7D is unique to our study, a significant time to maturity
(Mat) QTL (PV = 26%) also on 7D, and a positive contribution of the RL4452 allele, has been reported previously
by [29] in the same RL4452/‘AC Domain’ population. The
authors reported an SSR marker Xgwm130 tightly linked
to this QTL, which is distally located on 7DL, and is
1.1 cM from the QTL peak of our study. In the Glenlea
2005 trial (with a negative additive score for FN), the
average FN (LS Mean) score of 183 DH progeny was the
lowest of the four trials (data not shown). The low FN
score at this location might suggest greater levels of PHS
of ‘AC Domain’ genotypes, probably brought on by wet
weather conditions at the maturity stages or during the
three weeks preceding harvest [53]. As QTL locations of
both these Mat and FN traits nearly coincide and are influenced by negative and positive additive effects (with the
exception of the FN QTL of the Glenlea 2005 trial) of ‘AC
Domain’ alleles respectively, the action of a pleiotrophic
locus regulating both FN and Mat could be assumed. At
Glenlea in 2005 it is possible that the lower FN for the
Domain allele is due to adverse weather conditions at
maturity or that the 7D QTL identified here might not
actually be a PHS QTL, but rather a pleiotrophic effect of
the Mat QTL on PHS.
Page 8 of 12
Flanking marker intervals of a given PHS trait (GI, SI
or FN) QTL were not always the same across trials/datasets. It is quite likely that the respective underlying genes
influencing each of these traits are the same; difference
in QTL interval location being mainly due to environment
or experimental error from differences in class means of
individual trial data sets [54]. Alternatively, the possibility
of two closely linked loci controlling the same trait cannot
be ruled out.
BLASTN searches with sequences of SNP markers
flanking PHS QTL on chromosomes 3B, 4A, 7B and 7D
revealed candidate regions in Brachypodium and rice
genomes. The QTL interval on chromosome 3B was
orthologous to regions on Bradi2 and the long arm of
Os01, while QTL intervals on chromosomes 4A were
orthologous to regions on Bradi1 and the short arm of
Os03. QTL intervals on chromosome 7B.1 and 7D.2
were orthologous to regions on Bradi1 and the short
arm of Os06 of rice. The above findings of orthology between wheat/rice chromosomes: 3B/Os01, 4A/Os03 and
7B&7D/Os06 concur with previous reports [42,55-57] of
wheat/rice chromosomal region similarities revealed via
comparative mapping with DNA probes and ESTs. Further, orthologies between PHS QTL intervals of 4A, 7B,
7D and genomic regions of Bradi1, and 3B/Bradi2 in
our study will be refined to tease out individual genes
responsible for variation in PHS resistance. The availability of information on whole-genome 454 assembled gene
sequences of Chinese spring [58] and gene-orthologies
among the said wheat and Brachypodium chromosomes
established using 5003 ESTs mapped to wheat deletion
bins [32] will serve as useful references to complement
our efforts.
Eighteen KASP markers were developed from SNP
sequences flanking QTL for PHS resistance. Identical
genotype calls of Infinium SNP data enabled validation
of the 18 KASP markers and identified four (of 183) progeny genotypes of the RL4452/‘AC Domain’ population
possessing PHS resistance on all four QTL on 3B, 4A,
7B and 7D (Additional file 4). Criteria for selection of
these genotypes was based on findings of our study: ‘AC
Domain’ (allele 'A') reduced GI and SI on 4A, increased
FN on 4A and 7D, while RL4452 (allele 'B') reduced SI
on chromosomes 3B and 7B. Further, these 18 KASP
markers can be deployed in future genetic studies of
PHS, and in evaluation of PHS in germplasm and breeding material.
Genes present in Brachypodium and rice in orthologous regions corresponding to the QTL were identified
(Additional file 2). The 3B region is large and contains
over 800 genes in Brachypodium and over 1300 in
rice. More markers are needed to reduce the size of
the region and the emerging reference sequence of
chromosome 3B ( />
Cabral et al. BMC Plant Biology 2014, 14:340
/>
Seq-Repository/Reference-sequence) will be a valuable
resource. There are a number of ABA-inducible genes
(2 Brachypodium and 3 rice) which could be a starting
point to search for additional markers.
The 4A and 7B regions contain many fewer genes in
Brachypodium and rice than the 3B region. Gibberellin
20 oxidase (GA20 – oxidase) [59] on Bradi1/Os03
orthologous to 4A and abscissic acid responsive elements (ABF2, ABF3) [60-62] on Bradi1/Os06 orthologous to chromosome 7B are candidates worth further
study. GA20 - oxidase has previously been considered
as a candidate gene underlying PHS QTL on 4A [63].
On chromosome 7D the QTL was coincident with a
previously identified maturity QTL in the same population
(29). Genes affecting flowering time are present in the
orthologous regions in Brachypodium and rice. These
include the Far-red impaired responsive (FAR1) related
proteins [64] on chromosome Bradi1, as well as VRN1AP2/B3-like transcription factors [65,66] on Bradi1 and
phosphatidylethanolamine - binding protein (PEBP)
homologous to the Flowering Locus T gene [67,68] on
Bradi1/Os06, orthologous to chromosome 7D.
Because our study utilized a large number of sequencebased SNPs not available for previous mapping studies,
the resulting genetic maps and QTL flanking SNP
markers are a novel and current resource for identification
of underlying genes based on synteny and collinearity to
model species Brachypodium and rice. Further, the identification of candidate genes and regions for PHS in Brachypodium and rice will enable a targeted focus for selection
of candidate genes whose physiological/biological functions are linked to or influence variation in PHS traits
under study. Such candidate gene-specific PCR markers
will be developed and validated via mapping to the QTL
intervals for PHS resistance in wheat.
Conclusions
In our study we utilized SNPs from a wheat 90 K Infinium
iSelect Custom Beadchip that permitted detection and
assignment of significant PHS resistance QTL to specific
chromosomal locations on genetic maps. Sequences of
SNPs flanking PHS resistance QTL enabled identification
of candidate genes and regions for PHS in Brachypodium
and rice via comparative mapping. The 18 KASP markers
resulting from this study can be suitably deployed in
future genetic studies of PHS and might also be useful
in the evaluation of PHS in germplasm and breeding
material.
Methods
Plant material, experimental layout and trait phenotyping
A total of 193 DH progeny genotypes derived from a
cross RL4452/‘AC Domain’ were used to develop the
genetic linkage map. Of these, trait data was available on
Page 9 of 12
183 DH lines for detection of QTL across the genome.
Data on three PHS traits (GI, SI and FN) was collected
from six trials: Glenlea (2003; 2005), Winnipeg (2004;
2005) and Swift Current (2003; 2004), in Manitoba and
Saskatchewan Canada. The phenotyping methods, experimental design and layout for each of these traits are
described in [6,28].
Molecular markers and genotyping
Infinium SNPs and PCR based markers
The 90 K Infinium iSelect Custom Wheat Beadchip
identified 12,351 polymorphic markers that were added
to existing SSR, DArT and EST markers for the RL4452/
‘AC Domain’ cross. Of these, a total of 12,201 markers
(11282 SNPs; 919 SSRs, DArTs and ESTs) were used in
the construction of genetic maps. Further, co-segregating
markers were removed from the set of 12,201 markers
and QTL analysis was carried out (one marker per bin)
with 1054 markers.
Linkage mapping
Genotypic data of 193 DH progeny, screened with
12,201 markers (SSR, SNP, DArT and ESTs), were used
to construct genetic maps for all 21 chromosomes. Bins
of co-segregating markers were identified with MSTMap
[69], and the most informative marker per bin was
retained for mapping with MapDisto® [70]. Linkage groups
were created using a minimum LOD score of 4 and maximum recombination fraction (RF) of 0.25. Recombination
fractions were converted into centiMorgan (cM) map distances using the Kosambi mapping function.
QTL analysis
Multi-year trial data collected at six environments on
three PHS traits (GI, SI, FN) were used for QTL mapping with QGene version 3.0 software [71]. Trait data
and molecular phenotypes of 183 DH progeny assessed
with 1054 markers were subject to MIM and SIM (data
not shown) analyses. QTL with LOD scores exceeding
critical threshold values at 5% (α0.05), at two or more environments were deemed significant. Threshold values for
trait QTL were obtained through permutation analyses involving 1000 iterations. Further, marker–trait regression
(r2) values were interpreted as the percent phenotypic
variation (% PV) explained due to respective QTL.
Identification of candidate genes and regions in
Brachypodium and rice
Sequences of SNPs flanking QTL for PHS resistance traits
(GI, SI, FN) on chromosomes 3B, 4A, 7B and 7D were
subject to a BLASTN (Basic search) on the IWGSC database ( />Further, best survey sequence hits were subject to a
BLASTN search (Maximum E-value 10) on Gramene
Cabral et al. BMC Plant Biology 2014, 14:340
/>
(www.gramene.org) against both Brachypodium and rice
databases to obtain candidate regions for PHS resistance.
QTL intervals were deduced from centiMorgan map distances between SNP markers flanking QTL peaks of a
given PHS resistance trait (GI, SI or FN). Consensus candidate regions for PHS resistance were arrived at from
best hits (of PHS QTL flanking SNP sequences) to genes
and genomic regions in Brachypodium and rice. A few of
the SNP markers returned hits to non-candidate regions/chromosomes prompting the selection of weaker
hits to the consensus candidate regions. MapChart 2.2
[72] was used to construct genetic and physical maps of
orthologous regions in wheat, Brachypodium and rice.
Candidate genes in Brachypodium and rice corresponding to QTL intervals for PHS resistance on chromosomes 3B, 4A, 7B and 7D of wheat were obtained from
the online PlantGDB database (ntgdb.
org/).
KASP markers
Sequences of SNP markers flanking QTL for PHS
resistance on chromosomes 3B, 4A, 7B and 7D were
converted to KASP markers. PrimerPicker Lite for
KASP version 0.25 (KBioscience®) was used to generate
KASP primer sets from QTL flanking SNP sequences.
Protocols for the preparation and running of KASP reactions, and PCR conditions are given in the KASP manual
( A FLUOstar Omega plate
reader (BMG LABTECH® Offenburg Germany) with
KlusterCaller™ software was used to visualize KASP
marker polymorphisms.
Availability of supporting data
All the supporting data are available as additional files.
Additional files
Additional file 1: A linkage map constructed using 193 DH
progeny genotypes of a RL4452/‘AC Domain’ cross evaluated
with 12,201 polymorphic markers (11282 SNPs and 919 PCR
markers).
Additional file 2: Brachypodium and rice candidates corresponding
to QTL intervals for PHS resistance on chromosomes 3B, 4A, 7B
and 7D in a DH population of a RL4452/‘AC Domain’ cross.
Additional file 3: List of 18 Competitive Allele-Specific PCR (KASP)
primers derived from sequences of SNPs flanking QTL for PHS
resistance on chromosomes 3B, 4A, 7B and 7D.
Additional file 4: Validation of 18 Competitive Allele-Specific PCR
(KASP) markers designed from Illumina iSelect markers flanking
QTL in a RL4452/‘AC Domain’ population.
Competing interests
The authors declare that they have no competing interests.
Authors’ contributions
MCJ, CAM, ALC (designed and edited the manuscript); ALC, MCJ (conducted
the experiment and drafted the manuscript); GH (provided the RL4452/‘AC
Page 10 of 12
Domain’ DH population and edited the manuscript); CJP (conducted the
90 K genotyping, edited the manuscript and is the lead of the CTAG project
that funded part of this work); FMY, RM (carried out bioinformatics and data
sorting work); CAM (performed MST mapping and SNP clustering). All
authors read and approved the final manuscript.
Acknowledgements
This study was conducted as part of the Canadian Triticum Advancement
through Genomics (CTAG) project. The authors thank Genome Canada,
Genome Prairie, the Western Grains Research Foundation, the Province of
Saskatchewan, and Alberta Innovates for funding this project.
Author details
1
Cereal Research Centre, Agriculture and Agri-Food Canada, Morden, MB
R6M 1Y5, Canada. 2Crop Development Centre, University of Saskatchewan,
Saskatoon, SK S7N 5A8, Canada. 3National Research Council of Canada, 110
Gymnasium Place, Saskatoon, SK S7N 0W9, Canada.
Received: 17 July 2014 Accepted: 18 November 2014
References
1. DePauw RM, Knox RE, Singh AK, Fox SL, Humphreys DG, Hucl P:
Developing standardized methods for breeding preharvest sprouting
resistant wheat, challenges and successes in Canadian wheat. Euphytica
2012, 188:7–14.
2. Ogbonnaya FC, Imtiaz M, DePauw RM: Haplotype diversity of preharvest
sprouting QTLs in wheat. Genome 2007, 50:107–118.
3. DePauw RM, Clarke FR, Fofana B, Knox R, Humphreys G, Cloutier S: RL4137
contributes preharvest sprouting resistance to Canadian wheats.
Euphytica 2009, 168(3):347–361.
4. Hagberg S: Note on a simplified rapid method for determining alpha-amylase
activity. Cereal Chem 1961, 38:202–203.
5. Paterson AH, Sorrells ME, Obendorf RL: Methods of evaluation for
preharvest sprouting resistance in wheat breeding programs. Can J Plant
Sci 1989, 69:681–689.
6. Humphreys DG, Noll J: Methods for characterization of preharvest
sprouting resistance in a wheat breeding program. Euphytica 2002,
126(1):61–65.
7. Hagemann MG, Ciha AJ: Evaluation of methods used in testing winter
wheat susceptibility to preharvest sprouting. Crop Sci 1983, 24:249–253.
8. Reddy LV, Metzger RJ, Ching TM: Effect of temperature on seed dormancy
of wheat. Crop Sci 1985, 25:455–458.
9. McMaster GJ, Derera NF: Methodology and sample preparation when
screening for sprouting damage in cereals. Cereal Res Commun 1976,
4:251–254.
10. Mohan A, Kulwal P, Singh R, Kumar V, Mir RR, Kumar J, Prasad M, Balyan HS,
Gupta PK: Genome-wide QTL analysis for pre-harvest sprouting tolerance
in bread wheat. Euphytica 2009, 168(3):319–329.
11. Munkvold JD, Tanaka J, Benscher D, Sorrells ME: Mapping quantitative trait
loci for preharvest sprouting resistance in white wheat. Theor Appl Genet
2009, 119(7):1223–1235.
12. Kulwal PL, Mir RR, Kumar S, Gupta PK: QTL analysis and molecular
breeding for seed dormancy and pre-harvest sprouting tolerance in
bread wheat. J Plant Biol 2010, 37:59–74.
13. Jaiswal V, Mir RR, Mohan A, Balyan HS, Gupta PK: Association mapping for
pre-harvest sprouting tolerance in common wheat (Triticum aestivum L.).
Euphytica 2012, 188(1):89–102.
14. Osa M, Kato K, Mori M, Shindo C, Torada A, Miura H: Mapping QTLs for
seed dormancy and the Vp1 homologue on chromosome 3A in wheat.
Theor Appl Genet 2003, 106(8):1491–1496.
15. Kulwal PL, Kumar N, Gaur A, Khurana P, Khurana JP, Tyagi AK, Balyan HS,
Gupta PK: Mapping of a major QTL for pre-harvest sprouting tolerance
on chromosome 3A in bread wheat. Theor Appl Genet 2005,
111(6):1052–1059.
16. Mori M, Uchino N, Chono M, Kato K, Miura H: Mapping QTLs for grain
dormancy on wheat chromosome 3A and the group 4 chromosomes,
and their combined effect. Theor Appl Genet 2005, 110(7):1315–1323.
17. Fofana B, Humphreys DG, Rasul G, Cloutier S, Brûlé-Babel A, Woods S,
Lukow OM, Somers DJ: Mapping quantitative trait loci controlling
Cabral et al. BMC Plant Biology 2014, 14:340
/>
18.
19.
20.
21.
22.
23.
24.
25.
26.
27.
28.
29.
30.
31.
32.
33.
34.
35.
36.
37.
38.
39.
pre-harvest sprouting resistance in a red × white seeded spring wheat
cross. Euphytica 2009, 165(3):509–521.
Kulwal PL, Singh R, Balyan HS, Gupta PK: Genetic basis of pre-harvest
sprouting tolerance using single-locus and two-locus QTL analyses in
bread wheat. Funct Integr Genomic 2004, 4(2):94–101.
Chang C, Zhang HP, Feng JM, Yin B, Si HQ, Ma CX: Identifying alleles of
Viviparous-1B associated with pre-harvest sprouting in micro-core
collections of Chinese wheat germplasm. Mol Breeding 2010, 25(3):481–490.
Flintham J, Adlam R, Bassoi M, Holdsworth M, Gale M: Mapping genes for
resistance to sprouting damage in wheat. Euphytica 2002, 126(1):39–45.
Mares D, Mrva K, Cheong J, Williams K, Watson B, Storlie E, Sutherland M,
Zou Y: A QTL located on chromosome 4A associated with dormancy in
white-and red-grained wheats of diverse origin. Theor Appl Genet 2005,
111(7):1357–1364.
Torada A, Ikeguchi S, Koike M: Mapping and validation of PCR-based
markers associated with a major QTL for seed dormancy in wheat.
Euphytica 2005, 143(3):251–255.
Ogbonnaya FC, Imtiaz M, Ye G, Hearnden PR, Hernandez E, Eastwood RF,
Ginkel MV, Shorter SC, Winchester JM: Genetic and QTL analyses of seed
dormancy and preharvest sprouting resistance in the wheat germplasm
CN10955. Theor Appl Genet 2008, 116(7):891–902.
Chen CX, Cai SB, Bai GH: A major QTL controlling seed dormancy and
pre-harvest sprouting resistance on chromosome 4A in a Chinese wheat
landrace. Mol Breeding 2008, 21(3):351–358.
Groos C, Gay G, Perretant MR, Gervais L, Bernard M, Dedryver F, Charmet G:
Study of the relationship between pre-harvest sprouting and grain color
by quantitative trait loci analysis in a white × red grain bread-wheat
cross. Theor Appl Genet 2002, 104(1):39–47.
Singh R, Matus-Ca´diz M, Baga M, Hucl P, Chibbar RN: Identification of
genomic regions associated with seed dormancy in white-grained
wheat. Euphytica 2010, 174:391–408.
Roy JK, Prasad M, Varshney RK, Balyan HS, Blake TK, Dhaliwal HS, Edwards KJ,
Gupta PK: Identification of a microsatellite on chromosomes 6B and a
STS on 7D of bread wheat showing an association with preharvest
sprouting tolerance. Theor Appl Genet 1999, 99(1):336–340.
Rasul G, Humphreys DG, Brûlé-Babel A, McCartney CA, Knox RE, DePauw
RM, Somers DJ: Mapping QTLs for pre-harvest sprouting traits in the
spring wheat cross RL4452/‘AC Domain’. Euphytica 2009, 168(3):363–378.
McCartney CA, Somers DJ, Humphreys DG, Lukow O, Ames N, Noll J,
Cloutier S, McCallum BD: Mapping quantitative trait loci controlling
agronomic traits in the spring wheat cross RL4452 × 'AC Domain'.
Genome 2005, 48(5):870–883.
McCartney CA, Somers DJ, Lukow O, Ames N, Noll J, Cloutier S, Humphreys
DG, McCallum BD: QTL analysis of quality traits in the spring wheat cross
RL4452 × ‘AC Domain’. Plant Breed 2006, 125(6):565–575.
International Rice Genome Sequencing Project: The mapbased sequence
of the rice genome. Nature 2005, 436:793–800.
The International Brachypodium Initiative: Genome sequencing and
analysis of the model grass Brachypodium distachyon. Nature 2010,
463(7282):763–768.
Liu S, Bai G, Cai S, Chen C: Dissection of genetic components of preharvest
sprouting resistance in white wheat. Mol Breeding 2010, 27(4):511–523.
Kulwal P, Kumar N, Kumar A, Gupta RK, Balyan HS, Gupta PK: Gene
networks in hexaploid wheat: interacting quantitative trait loci for grain
protein content. Funct Integr Genomic 2005, 5(4):254–259.
Imtiaz M, Ogbonnaya FC, Oman J, van Ginkel M: Characterization of
quantitative trait loci controlling genetic variation for preharvest sprouting
in synthetic backcross-derived wheat lines. Genetics 2008, 178(3):1725–1736.
Goffinet B, Gerber S: Quantitative trait loci: a meta-analysis. Genetics 2000,
155(1):463–473.
Tyagi S, Gupta PK: Meta-analysis of QTLs involved in pre-harvest sprouting
tolerance and dormancy in bread wheat. Triticeae Genomics Genetics 2012,
3(2):9–24.
Faris JD, Zhang Z, Fellers JP, Gill BS: Micro-colinearity between rice,
Brachypodium, and Triticum monococcum at the wheat domestication
locus Q. Funct Integr Genomic 2008, 8(2):149–164.
Huo N, Vogel JP, Lazo GR, You FM, Ma Y, McMahon S, Dvorak J, Anderson
OD, Luo M-C, Gu YQ: Structural characterization of Brachypodium
genome and its syntenic relationship with rice and wheat. Plant Mol Biol
2009, 70(1–2):47–61.
Page 11 of 12
40. Griffiths S, Sharp R, Foote TN, Bertin I, Wanous M, Reader S, Colas I, Moore
G: Molecular characterization of Ph1 as a major chromosome pairing
locus in polyploid wheat. Nature 2006, 439:749–752.
41. Bossolini E, Wicker T, Knobel PA, Keller B: Comparison of orthologous loci
from small grass genomes Brachypodium and rice: implications for
wheat genomics and grass genome annotation. Plant J 2007, 49:704–717.
42. Sorrells ME, La Rota M, Bermudez-Kandianis CE, Greene RA, Kantety R,
Munkvold JD, Miftahudin, Mahmoud A, Ma X, Gustafson PJ, Qi LL, Echalier B,
Gill BS, Matthews DE, Lazo GR, Chao S, Anderson OD, Edwards H, Linkiewicz
AM, Dubcovsky J, Akhunov ED, Dvorak J, Zhang D, Nguyen HT, Peng J,
Lapitan NLV, Gonzalez-Hernandez JL, Anderson JA, Hossain K, Kalavacharla
V, et al: Comparative DNA Sequence Analysis of Wheat and Rice
Genomes. Genome Res 2003, 13:1818–1827.
43. Wang S, Wong D, Forrest K, Allen A, Chao S, Huang BE, Maccaferri M, Salvi S,
Milner SG, Cattivelli L, Mastrangelo AM, Whan A, Stephen S, Barker G, Wieseke
R, Plieske J, International Wheat Genome Sequencing Consortium, Lillemo M,
Mather D, Appels R, Dolferus R, Brown-Guedira G, Korol A, Akhunova AR,
Feuillet C, Salse J, Morgante M, Pozniak C, Luo M-C, Dvorak J, et al:
Characterization of polyploid wheat genomic diversity using a
high-density 90 000 single nucleotide polymorphism array. Plant
Biotech J 2014, doi:10.1111/pbi.12183.
44. Kao CH, Zeng ZB, Teasdale RD: Multiple interval mapping for quantitative
trait loci. Genetics 1999, 152(3):1203–1216.
45. Churchill GA, Doerge RW: Empirical threshold values for quantitative trait
mapping. Genetics 1994, 138:963–971.
46. Chao S, Dubcovsky J, Dvorak J, Luo MC, Baenziger SP, Matnyazov R, Clark
DR, Talbert LE, Anderson JA, Dreisigacker S, Glover K, Chen J, Campbell K,
Bruckner PL, Rudd JC, Haley S, Carver BF, Perry S, Sorrells ME, Akhunov ED:
Population-and genome-specific patterns of linkage disequilibrium and
SNP variation in spring and winter wheat (Triticum aestivum L.). BMC
Genomics 2010, 11(1):727.
47. Jordan MC, Somers DJ, Banks TW: Identifying regions of the wheat
genome controlling seed development by mapping expression
quantitative trait loci. Plant Biotech J 2007, 5(3):442–453.
48. Huang S, Sirikhachornkit A, Su X, Faris J, Gill B, Haselkorn R, Gornicki P:
Genes encoding plastid acetyl-CoA carboxylase and 3-phosphoglycerate
kinase of the Triticum/Aegilops complex and the evolutionary history of
polyploid wheat. Proc Natl Acad Sci U S A 2002, 99:8133–8138.
49. Akhunov ED, Akhunova AR, Linkiewicz AM, Dubcovsky J, Hummel D, Lazo
GR, Chao S, Anderson OD, David J, Qi L, Echalier B, Gill BS, Miftahudin,
Gustafson JP, La Rota M, Sorrells ME, Zhang D, Nguyen HT, Kalavacharla V,
Hossain K, Kianian SF, Peng J, Lapitan NLV, Wennerlind EJ, Nduati V,
Anderson JA, Sidhu D, Gill KS, McGuire PE, Qualset CO, et al: Synteny
perturbations between wheat homoeologous chromosomes caused by
locus duplications and deletions correlate with recombination rates. Proc
Natl Acad Sci U S A 2003, 100:10836–10841.
50. Qi LL, Echalier B, Chao S, Lazo GR, Butler GE, Anderson OD, Akhunov ED,
Dvorak J, Linkiewicz AM, Ratnasiri A, Dubcovsky J, Bermudez-Kandianis CE,
Greene RA, Kantety R, La Rota CM, Munkvold JD, Sorrells SF, Sorrells ME,
Dilbirligi M, Sidhu D, Erayman M, Randhawa HS, Sandhu D, Bondareva SN,
Gill KS, Mahmoud AA, Ma XF, Miftahudin, Gustafson JP, Conley EJ, et al: A
Chromosome Bin Map of 16,000 Expressed Sequence Tag Loci and
Distribution of Genes Among the Three Genomes of Polyploid Wheat.
Genetics 2004, 168:701–712.
51. McNeil MD, Diepeveen D, Wilson R, Barclay I, McLean R, Chalhoub B, Appels R:
Haplotype analyses in wheat for complex traits: tracking the chromosome
3B and 7B regions associated with late maturity alpha amylase (LMA) in
breeding programs. Crop Pasture Sci 2009, 60(5):463–471.
52. Chang C, Feng JM, Si HQ, Yin B, Zhang HP, Ma CX: Validating a novel
allele of viviparous-1 (Vp-1Bf) associated with high seed dormancy of
Chinese wheat landrace, Wanxianbaimaizi. Mol Breeding 2010,
25(3):517–525.
53. Mares DJ: Pre-harvest sprouting in wheat. I. Influence of cultivar, rainfall
and temperature during grain ripening. Crop Pasture Sci 1993,
44(6):1259–1272.
54. Szalma SJ, Snook ME, Bushman BS, Houchins KE, McMullen MD: Duplicate
Loci as QTL. Crop Sci 2002, 42(5):1679–1687.
55. Kurata N, Moore G, Nagamura Y, Foote T, Yano M, Minobe Y, Gale M:
Conservation of genome structure between rice and wheat. Nat
Biotechnol 1994, 12(3):276–278.
Cabral et al. BMC Plant Biology 2014, 14:340
/>
Page 12 of 12
56. Van Deynze AE, Nelson JC, Yglesias ES, Harrington SE, Braga DP, McCouch
SR, Sorrells ME: Comparative mapping in grasses. Wheat relationships.
Mol Gen Genet 1995, 248(6):744–754.
57. Gale MD, Devos KM: Comparative genetics in the grasses. Proc Natl Acad
Sci U S A 1998, 95(5):1971–1974.
58. Brenchley R, Spannagl M, Pfeifer M, Barker GLA, D’Amore R, Allen AM,
McKenzie N, Kramer M, Kerhornou A, Bolser D, Kay S, Waite D, Trick M,
Bancroft I, Gu Y, Huo N, Luo M-C, Sehgal S, Gill B, Kianian S, Anderson O,
Kersey P, Dvorak J, McCombie WR, Hall A, Mayer KFX, Edwards KJ, Bevan
MW, Hall N: Analysis of the bread wheat genome using whole-genome
shotgun sequencing. Nature 2012, 491(7426):705–710.
59. Lange T, Hedden P, Graebe JE: Expression cloning of a gibberellin 20-oxidase,
a multifunctional enzyme involved in gibberellin biosynthesis. Proc Natl Acad
Sci U S A 1994, 91(18):8552–8556.
60. Choi H, Hong J, Ha J, Kang J, Kim S: ABFs, a family of ABA-responsive
element binding factors. J Biol Chem 2000, 275:1723–1730.
61. Kim S, Ma J, Perret P, Li Z, Thomas T: Arabidopsis ABI5 subfamily members
have distinct DNA binding and transcriptional activities. Plant Physiol
2002, 130:688–697.
62. Kim S, Kang J-Y, Cho D-I, Park JH, Kim SY: ABF2, an ABRE-binding bZIP
factor, is an essential component of glucose signaling and its overexpression
affects multiple stress tolerance. Plant J 2004, 40:75–87.
63. Tyagi S, Gupta PK: Meta-analysis of QTLs Involved in Pre-harvest Sprouting
Tolerance and Dormancy in Bread Wheat. Triticeae Gen Genet 2012, 3:9–24.
64. Hudson M, Ringli C, Boylan MT, Quail PH: The FAR1 locus encodes a novel
nuclear protein specific to phytochrome A signaling. Gene Dev 1999,
13(15):2017–2027.
65. Yan L, Loukoianov A, Tranquilli G, Helguera M, Fahima T, Dubcovsky J:
Positional cloning of the wheat vernalization gene VRN1. Proc Natl Acad
Sci U S A 2003, 100(10):6263–6268.
66. Alonso JM, Stepanova AN, Leisse TJ, Kim CJ, Chen H, Shinn P, Stevenson DK,
Zimmerman J, Barajas P, Cheuk R, Gadrinab C, Heller C, Jeske A, Koesema E,
Meyers CC, Parker H, Prednis L, Ansari Y, Choy N, Deen H, Geralt M, Hazari
N, Hom E, Karnes M, Mulholland C, Ndubaku R, Schmidt I, Guzman P,
Aguilar-Henonin L, Schmid M, et al: Genome-wide insertional mutagenesis
of Arabidopsis thaliana. Science 2003, 301(5633):653–657.
67. Kojima S, Takahashi Y, Kobayashi Y, Monna L, Sasaki T, Araki T, Yano M:
Hd3a, a rice ortholog of the Arabidopsis FT gene, promotes transition to
flowering downstream of Hd1 under short-day conditions. Plant Cell
Physiol 2002, 43(10):1096–1105.
68. Ciaffi M, Paolacci AR, D'Aloisio E, Tanzarella OA, Porceddu E: Identification
and characterization of gene sequences expressed in wheat spikelets at
the heading stage. Gene 2005, 346:221–230.
69. Wu Y, Bhat PR, Close TJ, Lonardi S: Efficient and Accurate Construction of
Genetic Linkage Maps from the Minimum Spanning Tree of a Graph.
PLoS Genet 2008, 4(10):e1000212. doi:10.1371/journal.pgen.1000212.
70. Lorieux M: MapDisto: fast and efficient computation of genetic linkage
maps. Mol Breeding 2012, in press (doi:10.1007/s11032-012-9706-y).
71. Joehanes R, Nelson JC: QGene 4.0 an extensible Java QTL-analysis
platform. Bioinformatics 2008, 24:2788–2789.
72. Voorrips RE: MapChart: Software for the graphical presentation of linkage
maps and QTLs. J Hered 2002, 93(1):77–78.
doi:10.1186/s12870-014-0340-1
Cite this article as: Cabral et al.: Identification of candidate genes,
regions and markers for pre-harvest sprouting resistance in wheat
(Triticum aestivum L.). BMC Plant Biology 2014 14:340.
Submit your next manuscript to BioMed Central
and take full advantage of:
• Convenient online submission
• Thorough peer review
• No space constraints or color figure charges
• Immediate publication on acceptance
• Inclusion in PubMed, CAS, Scopus and Google Scholar
• Research which is freely available for redistribution
Submit your manuscript at
www.biomedcentral.com/submit