Adaptive expansion of the maize maternally expressed gene (Meg) family involves changes in expression patterns and protein secondary structures of its members
Bạn đang xem bản rút gọn của tài liệu. Xem và tải ngay bản đầy đủ của tài liệu tại đây (2.11 MB, 14 trang )
Xiong et al. BMC Plant Biology 2014, 14:204
/>
RESEARCH ARTICLE
Open Access
Adaptive expansion of the maize maternally
expressed gene (Meg) family involves changes in
expression patterns and protein secondary
structures of its members
Yuqing Xiong1, Wenbin Mei2, Eun-Deok Kim3, Krishanu Mukherjee1, Hatem Hassanein1, William Brad Barbazuk2,
Sibum Sung3, Bryan Kolaczkowski1* and Byung-Ho Kang1*
Abstract
Background: The Maternally expressed gene (Meg) family is a locally-duplicated gene family of maize which encodes
cysteine-rich proteins (CRPs). The founding member of the family, Meg1, is required for normal development of the
basal endosperm transfer cell layer (BETL) and is involved in the allocation of maternal nutrients to growing seeds.
Despite the important roles of Meg1 in maize seed development, the evolutionary history of the Meg cluster and
the activities of the duplicate genes are not understood.
Results: In maize, the Meg gene cluster resides in a 2.3 Mb-long genomic region that exhibits many features of
non-centromeric heterochromatin. Using phylogenetic reconstruction and syntenic alignments, we identified the
pedigree of the Meg family, in which 11 of its 13 members arose in maize after allotetraploidization ~4.8 mya.
Phylogenetic and population-genetic analyses identified possible signatures suggesting recent positive selection in
Meg homologs. Structural analyses of the Meg proteins indicated potentially adaptive changes in secondary structure
from α-helix to β-strand during the expansion. Transcriptomic analysis of the maize endosperm indicated that 6
Meg genes are selectively activated in the BETL, and younger Meg genes are more active than older ones. In endosperms
from B73 by Mo17 reciprocal crosses, most Meg genes did not display parent-specific expression patterns.
Conclusions: Recently-duplicated Meg genes have different protein secondary structures, and their expressions in
the BETL dominate over those of older members. Together with the signs of positive selections in the young Meg
genes, these results suggest that the expansion of the Meg family involves potentially adaptive transitions in which
new members with novel functions prevailed over older members.
Background
Transfer cells in plants mediate solute transport between
the apoplast and the symplast. One structural feature of
plant transfer cells is the extensive secondary cell wall
growth, which increases the plasma membrane surface
area and is thought to facilitate rapid solute transport
across the plasma membrane [1]. In agreement with their
solute exchange activity, transfer cells are typically observed in sink or source tissues in the vicinity of vascular
tissues. At the base of the maize endosperm, a layer of
* Correspondence: ;
1
Department of Microbiology and Cell Science, University of Florida,
Gainesville, FL 32611, USA
Full list of author information is available at the end of the article
transfer cells faces the maternal placento-chalazal zone
[2]. Seed development in maize is dependent on nutrient
transfer through this cell layer, termed the basal endosperm transfer cell layer (BETL).
Cysteine rich proteins (CRPs) constitute a large superfamily of small, secreted proteins abundant in eukaryotes
[3,4]. CRPs are involved in both cell-signaling [5,6] and
antimicrobial processes [7]. In plants, cell-cell communications mediated by secreted CRPs contribute to stomata differentiation [8], to guiding pollen tube growth
[9] in self-incompatibility [10], and patterning embryo
development [11]. BETL in the maize endosperm also
secretes multiple types of CRPs, including basal endosperm transfer layer1 (BETL-1), 2 (BETL-2) and 4 (BETL-
© 2014 Xiong et al.; licensee BioMed Central Ltd. This is an Open Access article distributed under the terms of the Creative
Commons Attribution License ( which permits unrestricted use, distribution, and
reproduction in any medium, provided the original work is properly credited. The Creative Commons Public Domain
Dedication waiver ( applies to the data made available in this article,
unless otherwise stated.
Xiong et al. BMC Plant Biology 2014, 14:204
/>
4) [12], BAP [13], and maternally expressed gene 1 (Meg1)
[14]. It was shown that a MYB-like transcription factor
that plays a key role in BETL development, ZmMRP-1, is
involved in expression of BETL-1, BETL-2, and Meg1
[14-17]. Given that the BETL is at the maternal-filial interface, these CRPs may protect developing seeds from
maternally-transmitted pathogens [18]. It is also possible
that some BETL CRPs serve as extracellular signal molecules that coordinate the supply of maternal nutrients
during seed development [3].
The Meg1 gene is required for normal development of
the BETL, and elevated expression of Meg1 increases BETL
sizes and seed biomass. Interestingly, ectopic expression of
Meg1 drives the expression of BETL-specific genes such as
ZmMRP-1 and INCW2 in non-BETL endosperm cells. Because Meg1 is a maternally expressed imprinted gene, and
the effects of Meg1 are dosage dependent, the promotion
of nutrient uptake by Meg1 provides evidence that nutrient
uptake during seed development is under maternal control
[19,20]. The enhanced nutrient allocation resulting from
Meg1 over-expression suggests that the Meg1 protein contributes to establishing the sink strength of developing
seeds by controlling BETL. A group of CRPs, termed Embryo Surrounding Factor 1 (ESF1), play roles similar to
Meg1 in Arabidopsis. The suspensor at the base of the embryo is involved in nutrient transport in Arabidopsis and
ESF1s produced from the central cells and endosperm cells
promote suspensor development [11].
Homologs of Meg1 are also transcribed in the developing endosperm [14]. We have shown that these Meg1
homologs are among the most highly-expressed genes in
the BETL [21]. The existence of active Meg1 homologs
raises questions about how this family arose and whether
various Meg1 homologs play similar or different functional roles. In this study, we identify the global complement of functional and non-functional Meg family genes
in maize and in the closely-related sorghum outgroup;
we use a combination of phylogenetic and populationgenetic techniques to characterize selection pressures
across these genes and link selection to changes in gene
expression and protein structure. We find that the Meg
gene family expanded rapidly in maize, with some evidence suggesting that positive selection may have driven
changes in protein structure. Our analysis indicates that
more recent duplicates exhibit higher expression levels,
more extensive structural changes, and stronger evidence
for adaptation than do older duplicates, suggesting that
newer, functionally different Meg homologs may have prevailed over older homologs during recent adaptation.
Results and discussion
Identification of Meg genes in maize
The Meg1 gene in maize is a member of the large Meg/
Ae1 supergroup of CRPs consisting of 17 subgroups
Page 2 of 14
sharing a simple CXCC motif but little detectable sequence similarity [4]. We focused our attention on the
subgroup CRP5420, which includes Meg1 and other members containing the cysteine motif: CX(6)CX(4)CYCCX
(14)CX(3)C and exhibiting conserved amino acid sequence. Based on sequence conservation, we identified 13
loci in the B73 maize genome homologous to Meg1, including Meg2, Meg3, Meg4, and Meg6 that have been
identified previously together with Meg1 [14]. The B76
genome does not contain any open reading frame that
matches Meg5. We named 8 new members Meg7—Meg14
according to their chromosome position. The seven loci
upstream of Meg1 were named Meg7—Meg13 from proximal to distal to the Meg1 gene, and the locus downstream
of Meg1 was named Meg14 (Additional file 1: Table S1).
The Meg1 gene consists of two coding exons separated
by a single intron and an upstream promoter required
for specific expression in basal endosperm transfer cells
(BETCs) [14]. We found that the complete Meg1 gene
architecture is shared by 8 Meg homologs (Figure 1A).
Exceptions were Meg7, Meg8, Meg3, Meg10 and Meg14.
Meg14 has the two canonical exons but its promoter is
distinct from that of Meg1. The first coding exon is
missing from Meg10 and Meg8. Meg8 does not appear to
have promoter elements, suggesting that it may not be
transcribed. The flanking sequences of Meg8 and Meg10
suggest that disruption of the two genes has been caused
by non-homologous end joining. Meg7 has the two coding
exons, but its promoter is dislocated ~6.2 kb upstream
from the first exon by a transposon insertion. The structure of Meg3 is abnormal in that it has multiple regulatory
elements and extra exons that are disarranged.
Clustering of maize Meg genes
All 13 Meg loci reside on maize chromosome 7S,
between the molecular markers p-asg8 and p-asg34.
When compared with chromosome regions where gene
density is high or where local gene duplicates are concentrated, this Meg region exhibits several distinct features. First, rather than tightly clustering in a genic
island like other maize gene clusters [22], the thirteen
loci of the Meg family are spread over a genomic region
of ~800 kb (Figure 1B). Also gene density is lower in the
Meg region than in other genic regions of the maize
genome; the average distance between neighboring Meg
genes is 62 kb, larger than the average interval between
similar locally-duplicated genes such as p1, rp1, zein,
kn1, pl1, a1-b, or rp3 (Additional file 2: Table S2). The
density of genes in the Meg cluster is even lower than
the average gene density of the entire maize genome
(one gene/52 kb, based on the filtered gene content of
the 2066 Mb RefGen_v2 whole genome assembly in
The overly-dispersed nature
of the Meg gene cluster is striking, considering the
Xiong et al. BMC Plant Biology 2014, 14:204
/>
Page 3 of 14
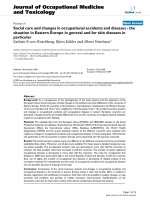
Figure 1 Gene structures and genomic arrangement of the 13 Meg genes in maize. (A) Meg genes and their flanking regions are aligned to
illustrate their gene structures. Promoters and exons of Meg genes are depicted as red and blue rectangles, respectively. Note that Meg14 is
missing the canonical Meg promoter. Each superfamily of transposons is shown as a rectangle with the following color codes: xillon-digus yellow, prem1 - orange, ji - brown. The transposon insertions within 10 kb upstream and 5 kb downstream of each gene model are shown. All of
the Meg genes except Meg1, Meg13 and Meg14 have xillon-digus on their 5’ side and CACTA sequences on their 3’ side (asterisks). Two putative
H-type thioredoxins downstream of Meg14 and SbMeg2 are colored light blue. All other regions are colored gray. All components of the region
were drawn to scale according to their physical sizes. (B) The 800 kb region in chromosome 7S that contains the 13 Meg genes is detailed. Color
codes for the 6 main elements in the region are provided under the diagram.
general tendency of maize genes to concentrate in
tightly-integrated gene islands [22].
Approximately 85% of the maize genome consists of
transposable elements, with gypsy transposons tending
to predominate in gene-poor heterochromatic regions
[23] and Mutator transposons tending to predominate
in genic regions and in open chromatin [24]. In contrast
this general pattern across the maize genome, gypsy
transposons comprise 75% lengthwise of all transposable elements in the 800-kb Meg region, and Mutator
transposons are completely absent from this region
(Figure 1B).
Chromosomal recombination tends to occur often in
euchromatin but is suppressed in heterochromatin [25].
Consistent with the presence of the gypsy heterochromaticmarker transposons and highly-dispersed genes, the 2.3Mb genomic region containing the Meg cluster (from 10.85
to 13.86 Mb of chromosome 7S) shows a low recombination rate of < 1 centimorgan (cM) (Liu et al. [24]; http://
www.maizegdb.org). The 3.3-Mb region upstream (from
7.38 to 10.68 Mb) and the 3.7-Mb region downstream
(13.92—17.05 Mb) flanking the low-recombining Meg region represent ~15.8 and ~8.5 cM of genetic distance, respectively, suggesting that the region surrounding the Meg
Xiong et al. BMC Plant Biology 2014, 14:204
/>
gene cluster represents a localized region of reduced recombination. Taken together, these data suggest that the
Meg gene region displays characteristics of maize nonpericentromeric heterochromatin.
We found that all members of the Meg cluster, except
Meg1 and Meg14, are surrounded by homologous 5’ and
3’ flanking sequences (Figure 1A). The lengths of the
homologous flanking sequences vary from a few hundred
base pairs to more than 5 kb. The 5' flanking sequences of
nine genes (Meg2, 3, 4, 6, 8, 9, 10, 11, and 12) contain
xilon-digus retrotransposons, which vary in length. In contrast, Meg13 and Meg1 have prem1 retrotransposon insertions at the beginning of their 5' flanking sequences. The
3' flanking sequences of all Meg genes, except Meg14, are
homologous. Meg14 is peculiar in that the flanking sequences on both sides are not homologous to any of the
other 12 Meg genes, suggesting that it may have a unique
origin. The general homology of the sequences surrounding the Meg genes suggests that expansion of the Meg
family can be primarily attributed to unequal crossover
and insertion of transposable elements that left characteristic signatures up- and down-stream of duplicate genes.
Evolutionary history of Meg genes
The Meg gene cluster resides exclusively on chromosome 7S in maize. We searched the public databases to
identify homologs of Meg genes in other grass species.
Two open reading frames in sorghum (Sorghum bicolor)
displayed strong sequence similarity with Meg1 and
other members of the maize Meg gene cluster, and one
gene in foxtail millet (Setaria italica) was identified as a
potential homolog. We found no homologs in rice or
other closely-related species, suggesting that Meg genes
originated before the sorghum/maize split but after the
Panicoideae group diverged from other grass species
[PMID: 22580950]. Although Meg1-related peptides of
Arabidopsis, ESF1s, have been identified and functionally characterized [11], there is no detectable sequence
similarity between ESF1s and the genes identified in
maize and other grass species, asides from their conserved
patterns of cysteine residues. Short secreted peptides such
as Meg typically evolve very rapidly, making the determination of precise phylogenetic relationships across large
timescales difficult. We therefore restricted our analyses
to those Meg homologs displaying reliable sequence similarity, although the actual evolutionary origin of this gene
family is likely to have been much earlier.
Using sequence similarity to Meg genes and to other
genes flanking the maize Meg cluster, we identified regions
in the maize, sorghum, and rice genomes that are homologous or homeologous to the 800-kb Meg-containing region.
The maize Meg genes and their sorghum homologs reside
exclusively in a syntenic block conserved throughout grass
genomes (Additional file 3: Figure S1). Gene colinearity is
Page 4 of 14
well-retained in the syntenic blocks of maize, sorghum
and rice, although the 4-Mb region of maize chromosome
7S containing the Meg genes is five times larger than the
corresponding region in rice, which lacks Meg homologs.
The complete lack of Meg genes in the homeologous region of maize chromosome 2 suggests that the duplication
events in the Meg family happened only in chromosome
7, primarily after allotetraploidization ~4.8 million years
ago (mya) [26,27], while the Meg copies in chromosome 2
were lost.
In order to confirm that the expansion of the Meg
gene family is not an anomaly of the B73 inbred line, we
estimated copy numbers in six additional maize cultivars. All Meg loci were amplified from each cultivar, and
amplicons were sequenced to determine whether the
specific polymorphisms in each Meg gene were present
in the amplicons (Additional file 3: Figure S2). With few
exceptions, all six inbred lines share the complete complement of Meg genes, suggesting that Meg gene family
expansion probably occurred before the establishment of
modern maize cultivars. Further supporting this hypothesis, we were able to confirm all the Meg homologs from
teosinte (Zea mays ssp. parviglumis), suggesting that the
Meg gene cluster had fully expanded before maize was
domesticated from its wild ancestor, ca. 4000–10,000 years
ago (Additional file 3: Figure S2).
We reconstructed the phylogeny of Meg family genes
using maximum likelihood, with the distantly-related
foxtail millet Meg gene used as an outgroup. The resulting phylogeny identified a large clade consisting of the
12 B73 Meg genes and one of the sorghum Meg homologs (SbMeg1), separated from Meg14 and the other sorghum homolog (SbMeg2) with strong statistical support
(Figure 2A). Maize Meg14 and sorghum SbMeg2 share
homologous downstream flanking sequences and a
nearby putative thioredoxin H gene (Figure 1A), further
supporting their grouping. Together, these data suggest
that maize Meg14/SbMeg2 may have diverged from the
maize Meg1-13/SbMeg1 clade after the maize/sorghum
group split from millet but prior to the maize/sorghum
divergence.
In addition to outgroup rooting using the foxtail millet
Meg sequence, we used gene-tree/species-tree reconciliation to estimate the rooted phylogeny by minimizing
gene gain/loss events [31]. The most parsimonious rooting (Figure 2A) supports the view that two Meg genes
were present in the common ancestor of maize and sorghum. One of these ancestral genes was retained as a single copy in both species (maize Meg14/SbMeg2), while the
other ancestor underwent a series of at least two rapid expansions in the maize genome. Maize Meg1 falls at the
base of the maize-specific expansion and is separated from
the other Meg homologs with strong support. Meg1 is also
located downstream from the other maize-specific Meg
Xiong et al. BMC Plant Biology 2014, 14:204
/>
Page 5 of 14
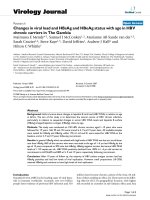
Figure 2 Phylogenetic analyses of maize Meg genes identifies adaptative amino acid substitutions. (A) We reconstructed maximum
likelihood phylogenies from protein and corresponding DNA sequence data. SH-like aLRT support [28] at key nodes is shown for protein sequence
data with and without Gblocks [29] processing to remove unreliable alignment positions (top row) and DNA alignments with and without Gblocks
processing (bottom row). Nodes having <0.8 SH-like aLRT support in any analysis are collapsed, and the tree is rooted using gene-species tree
reconciliation to minimize duplication/loss events. A blue star indicates significant support for adaptative substitutions in that specific branch
(p < 0.05 after correcting for multiple tests), inferred using codon-based analysis (see Methods). (B) We plot amino-acid substitutions inferred
as adaptive by branch-sites analysis (Zhang et al) [30] along the alignment of Meg protein sequences (green arrows). Biochemical properties
of amino acids are marked as pink for hydrophilic polar, green for hydrophilic polar uncharged, red for hydrophilic polar basic, and blue for
hydrophobic nonpolar amino acids. Conserved cysteine residues are highlighted in orange.
genes (Figure 1A), suggesting that the Meg1 gene was
probably the original progenitor of the maize expansion
that would have occurred through a series of “upstream”
duplication events. The consistency between phylogenetic
“age” and chromosome position supports this general
model, with genes closer in physical location to Meg1
tending to fall toward the base of the Meg phylogeny (see
Figures 1B and 2A).
To date the time of Meg gene duplications, we reconstructed the maximum likelihood phylogenetic tree using
a molecular clock calibrated with a maize-sorghum divergence time of ~11.9 mya [26]. Consistent with the absence
of Meg genes on maize chromosome 2, molecular-clock
analysis suggested that Meg gene expansions occurred
after maize allotetraploidization (Additional file 3: Figure
S3). According to this analysis, the majority of Meg genes
(Meg2-11) appeared very recently through a rapid series of
duplication events that cannot be resolved phylogenetically (i.e. approximately 0.90—1.58 mya). Meg12 was inferred to have arisen ~1.77—2.77 mya, and the oldest
duplicates following the maize-sorghum split, Meg1 and
Meg13, arose ~3.07—4.80 mya, right after maize allotetraploidization. Although we are cautious in our assignment of concrete dates to these duplication events, as
molecular-clock assumptions are likely to be violated,
these results suggest a model in which the Meg gene
cluster expanded rapidly in maize after allotetraploidzation
(~4.8 mya) but before domestication (~4000-10,000 years
ago). These results are corroborated by examination of
synteny and phylogenetic analyses (Figure 2A, Additional
file 3: Figure S1), which do not rely on molecular-clock
assumptions.
Evidence for positive selection driving changes in Meg
protein secondary structure
Functional divergence of cysteine rich proteins (CRPs)
has often been linked to gene duplication followed by
positive selection acting to alter protein function [32-34].
We used statistical analyses based on examining the ratio
of nonsynonymous to synonymous substitutions in order
to characterize the possible role of adaptive processes in
shaping the protein functions of maize Meg homologs.
These analyses identified a single branch on the phylogeny
as exhibiting strong evidence for protein-coding adaptation, the branch uniting Meg3-9, which represents the
most recent maize-specific expansion event (p < 0.05 after
correcting for multiple tests; Figure 2A).
Branch-sites analysis further identified two amino-acid
substitutions on the Meg3-9 branch that appear to have
been driven by positive selection (Figure 2B). These substitutions replace a conserved AK motif next to the first conserved cysteine with a VV motif, altering the size, charge
and hydrophobicity of this region. An additional unusual
Arg to Trp substitution in Meg6 in front of the same cysteine residue suggests that this position may represent a
“hotspot” of Meg protein functional differentiation.
Xiong et al. BMC Plant Biology 2014, 14:204
/>
Page 6 of 14
Although crystal structures to support homology modeling of Meg proteins are not available, we characterized
secondary structures of Meg proteins to identify possible
structural consequences of amino-acid substitutions. We
found that there was a general reduction in the proportion of α-helices and a corresponding increase in βstrands during the maize-specific Meg family expansion
(Table 1, Figure 3). For example, the oldest Meg proteins,
Meg1 and Meg14, were predicted to contain 52.81% and
45.45% α-helices, respectively. In contrast, the youngest
proteins, Meg9, Meg2 and Meg6, were 35.63%, 36.36%
and 36.36% alpha-helix, respectively (Table 1). The alphahelix content of the evolutionary intermediates, Meg13
and Meg4, fell between those of the oldest and youngest
genes (i.e. 38.64% and 37.50%, respectively). Proportions
of β-strand displayed the opposite trend, with β-strand
proportion increasing from oldest to youngest (Table 1).
We are cautious in our interpretation of secondarystructure predictions, as modern methods only achieve ~80% accuracy [ />jsp?arnumber=6217208]. However, it is interesting to note
that localized changes in predicted protein secondary
structure correlate strongly with the specific amino acids
identified as being under positive selection (Figure 3). This
protein region forms the first α-helix of the mature peptide in Meg1 and Meg14. The region surrounding the
adaptive changes is predicted as disordered in the
intermediate-aged Meg4 and Meg13, leading to an overall
reduction in the length of this first α-helix. In the more
recently derived Meg2, Meg6, and Meg9, the first αhelix is predicted as completely missing and is replaced
by a conserved β-strand (Figure 3). Overall, these results
suggest that the N-terminal region of maize Meg proteins has undergone a systematic and directional structural reorganization throughout the expansion of the
Meg gene family. Although the absence of 3D structural
data and the low accuracy of secondary structure prediction limit our ability to draw strong conclusions
about how changes in Meg protein sequence may have
changed protein function, the confluence of adaptive
protein-coding changes and alteration of predicted
Table 1 Composition of secondary structures in Meg
proteins
Types of secondary structure
α-helix
β-strand
Random coils
Meg14
52.81%
6.74%
40.45%
Meg1
45.45%
11.36%
40.91%
Meg13
38.64%
9.09%
50.00%
Meg4
37.50%
13.64%
46.59%
Meg9
35.63%
14.94%
48.28%
Meg2
36.36%
13.64%
46.59%
Meg6
36.36%
17.05%
44.32%
secondary structures do suggest that these evolutionary
changes have altered Meg protein function in some way.
Evidence for recent selective sweeps in the maize Meg
gene cluster
To investigate the possible role of recent selective sweeps
in maize Meg gene evolution, we analyzed maize polymorphism data [35,36] using a composite-likelihood
method to identify population-level adaptation [37]. We
found that the Meg region had the strongest signature of
an adaptive sweep across the entire distal 30 Mb of maize
chromosome 7S (Figure 4A). Although we are cautious
about the ability of these methods to identify the precise
locations of selective sweeps across the genome [37], we
note that the strongest support for population-level adaptation localized to Meg9—10 and just upstream of Meg1
and Meg7 (Figure 4B). The functional consequences of
these putative adaptive sweeps remain unknown, although
these results do suggest that the maize Meg gene cluster
may have experienced recent positive selection, further
supporting a general model of maize adaptation through
Meg gene family expansion and diversification.
It is impossible to draw definitive conclusions about
adaptive changes in protein function from phylogenetic
and population-genetic analyses, alone so we consider
these conclusions speculative at this point. However, we
note that the combination of statistical evidence for elevated
nonsynonymous/synonymous substitution ratios, nonconservative amino-acid substitutions, localized changes in predicted secondary structure, and population-genetic evidence
for possible selective sweeps all argue in favor of a model in
which adaptation has played a role in the maize Meg gene
expansion.
Expression profiles of Meg genes
To determine transcription profiles of Meg genes in the
endosperm, we measured mRNA levels from basal endosperm transfer cells (BETCs), starchy endosperm cells
(SECs) and peripheral endosperm (PE) containing aleurone cells at three developmental stages (Figure 5A). We
found that the transcript levels of six Meg genes (Meg1,
Meg2, Meg4, Meg6, Meg9, and Meg13) are significantly
higher than those of other Meg genes (Unpaired t test:
two-tailed p < 0.0001) (Figure 5B). These genes are all
highly expressed specifically in BETCs at 8, 12 and
16 days after pollination (DAP) (FPKM > 4800), with the
three consecutive Meg genes, Meg2, Meg6 and Meg9 being the most highly transcribed (Figure 5B). In contrast
to these highly-expressed Meg homologs, five Meg genes
showed negligible transcription levels across all cell
types and time points (Meg7, Meg8, Meg3, Meg10 and
Meg14, FPKM < 365), and the two remaining Meg genes
had intermediate levels of transcription, specifically in
Xiong et al. BMC Plant Biology 2014, 14:204
/>
Page 7 of 14
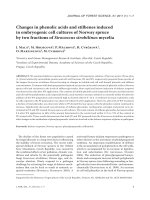
Figure 3 Meg protein secondary structure has changed over the maize-specific gene family expansion. The secondary structures of Meg
proteins were predicted using different algorithms on the Network sequence analysis server (NPS@, Network Protein Sequence Analysis, http://
npsa-pbil.ibcp.fr). The α-helix, β-strand and disordered loop regions are denoted by the longest, the second longest and the second shortest bars,
respectively. The shortest bars represent residues with ambiguous states. The symbols of positively selected amino acids are shown above the
corresponding bars. Gaps were introduced according to the amino acid sequence alignment in order to align secondary structural elements for
visualization. The figure illustrates amino acid sequences of Meg genes whose coding sequences are intact.
BETCs (FPKM = 1368 and 1910 for Meg9 and Meg11,
respectively).
These differences in the transcript levels of Meg genes
correlate well with preservation of gene integrity in the
Meg genes. The promoter and/or the two canonical
exons are disrupted in the five Meg genes with low
FPKM values (Figure 1). Meg11 and Meg12 exhibit intermediate transcript levels and appear to have the canonical Meg gene structure. However, Meg11 has a 22 bp
deletion in its promoter, and Meg12 contains a frame
shift mutation, which may affect the stability of its transcript. Meg12 has been annotated as a pseudogene
(www.maizesequences.org).
Despite the large variation in transcript levels, all Meg
genes displayed similar spatiotemporal expression patterns. Their transcripts were strictly confined to BETCs,
and transcription levels were highest at 8 DAP, but decreased thereafter (Figure 5B). These results suggest that
the expansion of the Meg gene family in maize does not
include diversification of expression patterns but does
include variation in expression level across homologs,
with more recently-derived intact genes generally having
higher expression levels.
To further examine expression of Meg genes at the protein level, we searched the Atlas of Maize Proteotypes
database (), where results from proteomic analyses of maize seed tissues are
cataloged. Peptides were identified from six Meg genes,
corresponding to the six genes with the highest transcript
concentrations in the endosperm (Figure 5C). Peptides
from the other 7 Meg genes were absent from the database. Furthermore, the protein abundance of highlyexpressed Meg genes peaked at 8–10 DAP and reduced
thereafter, in agreement with their transcript levels.
Because Meg1 is a maternally expressed imprinted
gene, we examined imprinting status of other Meg genes
from publicly available transcriptome datasets generated
by reciprocal crosses of B73XMo17 [38-40]. Meg1 expression is maternally imprinted at 4 DAP but it becomes biallelic at 12 DAP [14]. The transcriptome datasets were
generated from endosperm samples at 7 DAP and 10
DAP, before Meg1’s imprinted expression disappears. First,
we compared coding sequences of all Meg genes to determine their single nucleotide polymorphisms (SNPs) in
B73 and in Mo17 inbred lines. We were able to identify
SNPs in 8 Meg alleles of B73 and Mo17 (Additional file 3:
Xiong et al. BMC Plant Biology 2014, 14:204
/>
Page 8 of 14
devoid of coding sequences, and 11 are predicted to be
protein-coding genes with intact open reading frames. To
determine whether the 11 putative protein-coding genes
are transcriptionally active in the endosperm, we searched
our endosperm transcriptome data using the BLAST program. Transcripts from three genes (GRMZM2G553132,
GRMZM2G144653, GRMZM2G150091) were identified
as transcribed in endosperm, but their levels ranged
from 5% to 20% of the Meg6 transcript (Figures 2B, 6B).
GRMZM2G144653 is expressed in all three cell-types,
while GRMZM2G553132 and GRMZM2G150091 are
expressed specifically in BETCs. The high levels of Meg
transcripts in BETCs suggest that the Meg region corresponds to a transcriptional “hotspot” in BETCs, even
though the region exhibits features of pericentromeric
heterochromatin.
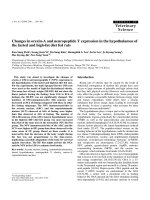
Figure 4 Selective sweeps in maize Meg gene region identified
by composite-likelihood analysis. We used a spatially-explicit
likelihood model to identify recent selective sweeps within the
region of maize chromosome 7S containing the Meg gene array
from polymorphism data (see Methods). We plot the log-likelihood
support in favor of a selective sweep model along chromosome
position. A dotted horizontal line indicates the empirically-derived
0.05 significance cutoff, with log-likelihood greater than the dotted
line indicating significant support for a selective sweep. (A) We plot
support for a selective sweep across the 30-Mb region of chromosome
7S containing the Meg gene region. (B) Close-up of the chromosomal
region containing the Meg gene cluster, with each Meg gene’s coding
sequence indicated.
Figure S4) and maternal to paternal expression ratios of
the 8 genes were available in the dataset by Xin et al. [39].
Unlike Meg1, none of the 8 genes exhibited parent-oforigin specific expression. Instead, Mo17 alleles of Meg2,
Meg7, and Meg11 displayed strong dominance over those
of B73 while B73 alleles of Meg3, Meg4, and Meg13 overwhelmed those of Mo17 (Figure 6A). Meg6 and Meg12
did not exhibit allele specific expression patterns. No
SNPs were identified in B73 and Mo17 alleles of Meg1,
Meg3, Meg9 and Meg10 and we were not able to find information about their parent of origin specific expression
in the datasets. Expression data of Meg3, Meg4, and
Meg13 were available from Waters et al. [38] and they
were consistent with the results in Figure 6A. These suggest that parent-of-origin specific expression of Meg1 is
not conserved in the 8 Meg duplicates that we examined
in the B73XMo17 expression datasets.
The Meg gene region comprises 48 annotations in the
B73 genome database (AGPv2, working gene set), including the 13 Meg genes. Among the 35 other annotations,
13 are transposable elements, 11 are pseudogenes or
Conclusions
The Meg gene family has expanded radically in maize
since its divergence from sorghum. However, the functional consequences of this expansion remain unclear.
Meg proteins are members of the CRP superfamily,
other members of which play diverse roles in cell signaling and defense in eukaryotic cells [3]. Most maize Meg
genes are expressed exclusively in the BETL, and it is
evident that Meg1 is involved in the control of nutrient
transport by promoting BETL formation [20]. Both sorghum and maize have BETLs [41,42], but Meg genes
have expanded only in maize. This suggests that the cellsignaling networks controlling seed development and
nutrient allocation through the BETL may have diversified in maize. Alternatively, Meg gene-family expansion
could function to alter the molecular mechanisms responsible for isolating the developing seed from infections in the maternal tissue in maize. The loss of
imprinting in Meg genes is in line with the notion that
functional diversity in the Meg family expanded along its
evolution. Further examination of the functional roles
played by Meg family genes is likely to enhance our understanding of how tandem gene duplication events contribute to species-specific adaptation in plants.
In this study, we examined the evolution of recentlyduplicated genes to identify molecular selection by the
combined use of phylogenetic and population-genetic analyses and to identify functional differences between duplicates by characterizing their expression, localization,
imprinting, and protein structures. We observed changes
in coding exons and promoter sequences throughout the
Meg gene array in maize, consistent with a model in which
mistakes introduced during the production of tandemlyduplicated gene arrays may be an important source of differences in both gene expression and protein function.
We expect that a thorough understanding of gene duplication processes will illuminate the potential roles of
Xiong et al. BMC Plant Biology 2014, 14:204
/>
Figure 5 (See legend on next page.)
Page 9 of 14
Xiong et al. BMC Plant Biology 2014, 14:204
/>
Page 10 of 14
(See figure on previous page.)
Figure 5 Specific Meg homologs are highly expressed in maize endosperm. (A) Bright-field micrograph of a maize endosperm at 8 days
after pollination (DAP), showing the basal endosperm transfer cell (BETC), peripheral endosperm (PE) and starchy endosperm cell (SEC) layers.
These three tissue types were isolated by cryo-microdissection, and gene-specific transcripts were evaluated by RNA-seq. Scale bar: 0.5 ○m. (B)
Transcript levels of each Meg gene in the BETC, PE and SEC. The six highly-expressed genes are highlighted in green. Note that Meg transcripts
are detected exclusively in BETC. (C) Abundances of Meg proteins in the maize endosperm at three developmental stages. The histogram is based
on results from searching the maizeproteome.ucsd.edu. Meg proteins not found in the proteome database are omitted from the histogram. The
x-axis is scaled to the normalized arbitrary unit according to the maize proteome database.
Figure 6 Imprinting status of Meg genes and endosperm expression patterns of non-Meg genes in the Meg region. (A) Maternal
expression ratios of Meg genes at 7 DAP (left panel) and 10 DAP (right panel) endosperms from B73XM17 reciprocal crosses. The horizontal and
vertical dotted lines mark boundaries of 3:1 maternal and paternal expression ratio in each cross. If the maternal allele of a gene is expressed 3
times more than its paternal allele, the gene should appear in the upper right corner (red square). The ratios were calculated from the
endosperm transcriptome data by Xin et al. [39]. Expression of Meg genes was not detected in 15 DAP endosperm. (B) Heat map depicting the
transcriptional activities in BETCs of genes within a ~9.4-Mb region spanning the Meg gene cluster in. Normalized gene expression level (FPKM)
was used to generate the graphic. Meg genes are marked with green arrows. The FPKM values of the 6 highly-expressed Meg genes are far larger
(>3000) than those of any other genes in the 9.4 Mb interval. Genes with FPKM < 20 in any of the nine samples were omitted from the heat map.
Xiong et al. BMC Plant Biology 2014, 14:204
/>
“imperfect” gene duplication in generating the molecular
diversity necessary to drive evolution and adaptation.
Methods
Cell type-specific sample preparation and sequencing
library construction
It was impossible to differentiate transcription levels of
each Meg gene by RNA blot analysis or by quantitative
RT-PCR due to their high nucleotide sequence similarities. We determined nucleotide polymorphisms in the
two exons present in all Meg genes and differentiated
Illumina reads that mapped to the exons of different
Meg genes according to their sequence polymorphisms
(Additional file 3: Figure S4). Therefore, we used Illumina sequencing technology to identify and quantify
transcripts of each member of the Meg family. Three
endosperm cell types were isolated and total RNA samples from each cell type were prepared as described in
[21,43]. In brief, maize B73 kernels at 8, 12, and 16
DAPs were frozen in liquid nitrogen and mounted on
the specimen holder with Tissue-Tek OCT compound
(Ted Pella, CA). 50-μm sections were collected at −15°C
and the frozen sections were dehydrated in ethanol and
stained with the HistoGene LCM frozen section staining
kit (MDS Analytical Technologies, CA). BETL, SEC, and
PE samples were cut out from the sections using surgical
scalpels under a dissecting stereomicroscope until we acquired approximately 2 μg total RNA for each sample.
Total RNA samples were purified with the Arcturus
PicoPure RNA isolation kit (Life Technologies, CA) and
RNA-seq libraries were constructed according to a previously published protocol by Zhong et al. [43], with
slight modifications. First-strand cDNA was generated
using random hexamer-primed reverse transcription,
and second strand cDNA synthesis and adaptor ligation
were subsequently performed. cDNA fragments of approximately 200–500 bp were isolated by Ampure XP
(Beckman Coulter) and cDNA fragments were amplified
by 15 cycles of PCR. The library was quantified by quantitative PCR and by a bioanalyzer (Agilent, CA) before
being sequenced on an Illumina HiSeq 2000 platform.
The bright-field micrograph in Figure 5 was prepared as
described in [44]. The Illumina reads have been deposited at NCBI Sequence Read Archive (Accession numbers SRA175303).
Sequence preprocessing, mapping, and quantification of
gene expression
The raw data were grouped into separate files by the
barcode. The adapter sequence was removed using
CUTADAPT [45,46] followed by barcode trimming,
quality trimming (−t 20, −l 50), artifact removal, and
quality filtering (−q 20, −p 90) using FASTX-TOOLKIT
( />
Page 11 of 14
Mitochondrial, chloroplast and ribosomal reads were removed by bowtie2 [47] using the default setting. The
processed reads were put back into the paired end mode,
or single end mode, if only one end was left.
Reads were aligned using GSNAP [48] with the supplied
known splice junction from RefGen_v2 working gene
set, with the parameters: −-nthreads 12, −-batch 5, −-maxmismatches 0.05, −-npaths 5, −-quiet-if-excessive, −-novelsplicing yes, −-split-output. Only reads in the files
concordant_uniq, and concordant_mult, halfmapping_uniq, unpaired_uniq and unpaired_mult were combined for the downstream analysis. During this process,
the translocation, scramble and inversion reads were excluded from downstream analysis. PICARD (http://picard.
sourceforge.net/) was used to remove the duplicate reads
in the combined alignment for each sample.
Final cleaned alignments were assembled using CUFFLINKS [49] with parameters –multi-read-correct, −-maxintron-length 8000, −-min-intron-length 20, −-GTF
ZmB73_5a_WGS-chr1-10.gff, −b ZmB73_5b-chr1-10.
fasta. Expression levels measured by FPKM (fragments
per kilobase of exon per million fragments mapped)
[49] were extracted for each member identified as being
in the Meg gene family based on the CUFFLINKS results. For imprinting analyses, datasets from Xin et al.
[39], Waters et al. [38], and Zhang et al. [40] were obtained from the Plant Cell website and each Meg gene
was searched for its expression ratio from reciprocal
crosses.
Sequence annotation
Gene density in maize inbred line B73 was estimated based
on the size of the maize genomic assembly (version
AGPv2) and the total number of filtered genes (version 5b)
( Transposable elements
(TEs) were identified by searching the Maize transposable element (TE) database ( using
BLASTN program with an E-value cutoff of 1E-20.
Phylogenetic reconstructions
The translated amino acids of Meg genes were aligned in
MUSCLE [50], followed by manual corrections, and the
protein-based alignment was then used to construct
DNA alignments. Maximum likelihood phylogenies were
constructed using Phyml v3.0 [51], with the evolutionary
model selected by Akaike information criterion (AIC)
[52]. Best-fit evolutionary models were JTT + G + F for
protein sequences and HKY + G for nucleotide alignments. Clade support was inferred using SH-like approximate likelihood ratio tests (aLRTs) [28].
Protein-coding adaptation
We inferred protein-coding adaptation using a branchspecific model to infer branches with an excess of
Xiong et al. BMC Plant Biology 2014, 14:204
/>
positive selection, implemented in PAML v4.5 [30,53].
Model M2a (positive selection) was applied to each branch
on the phylogeny and compared to model M1a (nearly
neutral) to identify specific branches undergoing positive
protein-coding adaptation. Significance was assessed using
a chi-square test with 2 degrees of freedom [54]. We corrected for multiple testing using a Bonferroni correction;
we report only those results identified as adaptive at p <
0.05, after correcting for multiple tests. Adaptation was further localized to specific positions using branch-sites analysis (Zhang et al) [30], with positions having posterior
probability >0.95 being inferred as adaptive.
Secondary structure prediction
Consensus secondary structure was predicted and generated
on the Network sequence analysis server [55] (NPS@, Network Protein Sequence Analysis, />Many algorithms for predicting protein secondary structures, such as hierarchical neural network, double prediction method, discrimination of protein secondary
structure class, Garnier, Gibrat, multivariate linear regression combination, PHD, Predator, and SOPM on
the NPS@ server were utilized.
Identification of selective sweeps
Selective sweeps were identified using single nucleotide
polymorphism (SNP) data from the maize HapMap database () (Chia et al; Hufford et al)
[35,36]. We excised the 30-Mb region of genomic DNA
surrounding the Meg gene cluster and assessed support
for an adaptive sweep using a composite likelihood ratio
test (CLRT) (Nielsen et al) [37]. The CLRT calculates
the likelihood of the local site frequency spectrum (SFS)
at a specific location in the genome under two models:
1) the background SFS calculated across the entire region and 2) a one-parameter model that induces a characteristic sweep-like skew in the background SFS.
Support for the sweep model is reported as the loglikelihood ratio of the sweep model to the background
SFS. We scanned the 30-Mb genomic region for adaptive sweeps sampling every 100 bp.
Significance was assessed using 100,000 coalescent
simulations under a standard-neutral model, simulated
conditional on the observed number of segregating sites
and pattern of sequencing coverage in each region. For
each simulated replicate dataset, we calculated the loglikelihood ratio in favor of an adaptive sweep using the
CLRT, producing a null distribution from which to estimate the P-value of the observed log-likelihood ratio.
This approach has been shown to be robust to changes
in demographic history such as population bottlenecks
(Nielsen et al. [37]).
Page 12 of 14
Additional files
Additional file 1: Table S1. Members of the Meg gene family.
Additional file 2: Table S2. Locally duplicated gene families in Maize.
Additional file 3: Syntenic relationship of the Meg region with
homologous regions of sorghum chromosome 2, rice chromosome
7, and maize chromosomes 2 and 7. Homologous and homeologous
regions of the Meg cluster were identified by the GEvo analysis (Lyons
and Freeling, 2008). Meg gene models are depicted by red bars while all
other genes are indicated with green bars. Both the sorghum chromosome
2 and maize chromosome 7 contain many copies of F-box genes in this
region. The F-box genes in the two regions are connected with blue
lines. All other anchor genes are connected with gray lines. All gene
models and intervals were drawn to scale according to their physical
sizes. The figure was adapted from the GEvo analysis results.
Competing interests
The authors declare that they have no competing interest.
Authors’ contribution
YX and B-HK designed this study. YX acquired most of data. YX, WM, EK, HH,
BB, SB, and B-HK analyzed the Meg loci, their genomic region, and expression
data. YX, KM, BK, and B-HK performed evolutionary analyses. YX, BK, and B-HK
wrote the manuscript. All authors read and approved the final manuscript.
Acknowledgments
This work was supported by the Agriculture and Food Research Initiative
Competitive Grant 2010–0496 from the USDA’s National Institute of Food
and Agriculture, Plant Biology Program and the National Science Foundation
grant ISO 1025976 to B.-H.K.
Author details
1
Department of Microbiology and Cell Science, University of Florida,
Gainesville, FL 32611, USA. 2Department of Biology, University of Florida,
Gainesville, FL 32611, USA. 3Department of Molecular Biosciences and
Institute for Cellular and Molecular Biology, University of Texas at Austin,
Austin, TX 78712, USA.
Received: 16 April 2014 Accepted: 22 July 2014
Published: 1 August 2014
References
1. Talbot MJ, Offler CE, McCurdy DW: Transfer cell wall architecture: a
contribution towards understanding localized wall deposition.
Protoplasma 2002, 219(3–4):197–209.
2. Offler CE, McCurdy DW, Patrick JW, Talbot MJ: Transfer cells: Cells
specialized for a special purpose. Annu Rev Plant Biol 2003, 54:431–454.
3. Marshall E, Costa LM, Gutierrez-Marcos J: Cysteine-rich peptides (CRPs)
mediate diverse aspects of cell-cell communication in plant reproduction
and development. J Exp Bot 2011, 62(5):1677–1686.
4. Silverstein KA, Moskal WA Jr, Wu HC, Underwood BA, Graham MA,
Town CD, VandenBosch KA: Small cysteine-rich peptides resembling
antimicrobial peptides have been under-predicted in plants. Plant J 2007,
51(2):262–280.
5. Wheeler MJ, Vatovec S, Franklin-Tong VE: The pollen S-determinant in
Papaver: comparisons with known plant receptors and protein ligand
partners. J Exp Bot 2010, 61(7):2015–2025.
6. Spelbrink RG, Dilmac N, Allen A, Smith TJ, Shah DM, Hockerman GH:
Differential antifungal and calcium channel-blocking activity among
structurally related plant defensins. Plant Physiol 2004, 135(4):2055–2067.
7. Tailor RH, Acland DP, Attenborough S, Cammue BP, Evans IJ, Osborn RW,
Ray JA, Rees SB, Broekaert WF: A novel family of small cysteine-rich
antimicrobial peptides from seed of Impatiens balsamina is derived
from a single precursor protein. J Biol Chem 1997, 272(39):24480–24487.
8. Sugano SS, Shimada T, Imai Y, Okawa K, Tamai A, Mori M, Hara-Nishimura I:
Stomagen positively regulates stomatal density in Arabidopsis. Nature
2010, 463(7278):241–244.
9. Okuda S, Tsutsui H, Shiina K, Sprunck S, Takeuchi H, Yui R, Kasahara RD,
Hamamura Y, Mizukami A, Susaki D, Kawano N, Sakakibara T, Namiki S, Itoh
Xiong et al. BMC Plant Biology 2014, 14:204
/>
10.
11.
12.
13.
14.
15.
16.
17.
18.
19.
20.
21.
22.
23.
24.
25.
26.
27.
28.
K, Otsuka K, Matsuzaki M, Nozaki H, Kuroiwa T, Nakano A, Kanaoka MM,
Dresselhaus T, Sasaki N, Higashiyama T: Defensin-like polypeptide LUREs
are pollen tube attractants secreted from synergid cells. Nature 2009,
458(7236):357–361.
Wheeler MJ, de Graaf BH, Hadjiosif N, Perry RM, Poulter NS, Osman K,
Vatovec S, Harper A, Franklin FC, Franklin-Tong VE: Identification of the
pollen self-incompatibility determinant in Papaver rhoeas. Nature 2009,
459(7249):992–995.
Costa LM, Marshall E, Tesfaye M, Silverstein KA, Mori M, Umetsu Y, Otterbach
SL, Papareddy R, Dickinson HG, Boutiller K, VandenBosch KA, Ohki S,
Gutierrez-Marcos JF: Central cell-derived peptides regulate early embryo
patterning in flowering plants. Science 2014, 344(6180):168–172.
Cai G, Faleri C, Del Casino C, Hueros G, Thompson RD, Cresti M: Subcellular
localisation of BETL-1, −2 and −4 in Zea mays L. endosperm. Sex Plant
Reprod 2002, 15(2):85–98.
Serna A, Maitz M, O'Connell T, Santandrea G, Thevissen K, Tienens K, Hueros
G, Faleri C, Cai G, Lottspeich F, Thompson RD: Maize endosperm secretes
a novel antifungal protein into adjacent maternal tissue. Plant J 2001,
25(6):687–698.
Gutierrez-Marcos JF, Costa LM, Biderre-Petit C, Khbaya B, O'Sullivan DM,
Wormald M, Perez P, Dickinson HG: Maternally expressed gene1 is a
novel maize endosperm transfer cell-specific gene with a maternal
parent-of-origin pattern of expression. Plant cell 2004, 16(5):1288–1301.
Gomez E, Royo J, Guo Y, Thompson R, Hueros G: Establishment of cereal
endosperm expression domains: identification and properties of a
maize transfer cell-specific transcription factor, ZmMRP-1. Plant cell 2002,
14(3):599–610.
Barrero C, Royo J, Grijota-Martinez C, Faye C, Paul W, Sanz S, Steinbiss HH,
Hueros G: The promoter of ZmMRP-1, a maize transfer cell-specific
transcriptional activator, is induced at solute exchange surfaces and
responds to transport demands. Planta 2009, 229(2):235–247.
Royo J, Gómez E, Barrero C, Muñiz LM, Sanz Y, Hueros G: Transcriptional
activation of the maize endosperm transfer cell-specific gene BETL1
by ZmMRP-1 is enhanced by two C2H2 zinc finger-containing proteins.
Planta 2009, 230(4):807–818.
Sabelli PA, Larkins BA: The development of endosperm in grasses. Plant
Physiol 2009, 149(1):14–26.
Becraft PW: Endosperm imprinting: a child custody battle? Curr Biol 2012,
22(3):R93–R95.
Costa LM, Yuan J, Rouster J, Paul W, Dickinson H, Gutiérrez-Marcos JF:
Maternal control of nutrient allocation in plant seeds by genomic
imprinting. Curr Biol 2012, 22:160–165.
Xiong YQ, Li QB, Kang BH, Chourey PS: Discovery of genes expressed in
basal endosperm transfer cells in maize using 454 transcriptome
sequencing. Plant Mol Biol Report 2011, 29(4):835–847.
Fu H, Park W, Yan X, Zheng Z, Shen B, Dooner HK: The highly
recombinogenic bz locus lies in an unusually gene-rich region of the
maize genome. Proc Natl Acad Sci U S A 2001, 98(15):8903–8908.
Schnable PS, Ware D, Fulton RS, Stein JC, Wei F, Pasternak S, Liang C, Zhang
J, Fulton L, Graves TA, Minx P, Reily AD, Courtney L, Kruchowski SS,
Tomlinson C, Strong C, Delehaunty K, Fronick C, Courtney B, Rock SM, Belter
E, Du F, Kim K, Abbott RM, Cotton M, Levy A, Marchetto P, Ochoa K, Jackson
SM, Gillam B, et al: The B73 maize genome: complexity, diversity, and
dynamics. Science 2009, 326(5956):1112–1115.
Liu S, Yeh C-T, Ji T, Ying K, Wu H, Tang HM, Fu Y, Nettleton D, Schnable PS:
Mu transposon insertion sites and meiotic recombination events
co-localize with epigenetic marks for open chromatin across the
maize genome. PLoS Genet 2009, 5(11):e1000733.
Gaut BS, Wright SI, Rizzon C, Dvorak J, Anderson LK: Recombination: an
underappreciated factor in the evolution of plant genomes. Nat Rev
Genet 2007, 8(1):77–84.
Swigonová Z, Lai J, Ma J, Ramakrishna W, Llaca V, Bennetzen JL, Messing J:
Close split of sorghum and maize genome progenitors. Genome Res 2004,
14(10A):1916–1923.
Gaut BS, Doebley JF: DNA sequence evidence for the segmental
allotetraploid origin of maize. Proc Natl Acad Sci U S A 1997,
94(13):6809–6814.
Anisimova M, Gil M, Dufayard JF, Dessimoz C, Gascuel O: Survey of
branch support methods demonstrates accuracy, power, and
robustness of fast likelihood-based approximation schemes. Syst Biol
2011, 60(5):685–699.
Page 13 of 14
29. Castresana J: Selection of conserved blocks from multiple alignments for
their use in phylogenetic analysis. Mol Biol Evol 2000, 17(4):540–552.
30. Zhang J, Nielsen R, Yang Z: Evaluation of an improved branch-site
likelihood method for detecting positive selection at the molecular level.
Mol Biol Evol 2005, 22(12):2472–2479.
31. Chen K, Durand D, Farach-Colton M: NOTUNG: a program for dating
gene duplications and optimizing gene family trees. J Comput Biol 2000,
7(3–4):429–447.
32. Radhakrishnan Y, Hamil KG, Yenugu S, Young SL, French FS, Hall SH:
Identification, characterization, and evolution of a primate beta-defensin
gene cluster. Genes Immun 2005, 6(3):203–210.
33. Graham MA, Silverstein KAT, Vandenbosch KA: Defensin-like genes:
genomic perspectives on a diverse superfamily in plants. Crop Sci 2008,
48(Supplement 1):S3–S11.
34. Silverstein KAT, Graham MA, Paape TD, VandenBosch KA: Genome
organization of more than 300 defensin-like genes in Arabidopsis.
Plant Physiol 2005, 138:600–610.
35. Chia JM, Song C, Bradbury PJ, Costich D, de Leon N, Doebley J, Elshire RJ,
Gaut B, Geller L, Glaubitz JC, Gore M, Guill KE, Holland J, Hufford MB, Lai J, Li
M, Liu X, Lu Y, McCombie R, Nelson R, Poland J, Prasanna BM, Pyhajarvi T,
Rong T, Sekhon RS, Sun Q, Tenaillon MI, Tian F, Wang J, Xu X, et al: Maize
HapMap2 identifies extant variation from a genome in flux. Nat Genet
2012, 44(7):803–807.
36. Hufford MB, Xu X, van Heerwaarden J, Pyhajarvi T, Chia JM, Cartwright RA,
Elshire RJ, Glaubitz JC, Guill KE, Kaeppler SM, Lai J, Morrell PL, Shannon LM,
Song C, Springer NM, Swanson-Wagner RA, Tiffin P, Wang J, Zhang G,
Doebley J, McMullen MD, Ware D, Buckler ES, Yang S, Ross-Ibarra J:
Comparative population genomics of maize domestication and
improvement. Nat Genet 2012, 44(7):808–811.
37. Nielsen R, Williamson S, Kim Y, Hubisz MJ, Clark AG, Bustamante C:
Genomic scans for selective sweeps using SNP data. Genome Res 2005,
15(11):1566–1575.
38. Waters AJ, Makarevitch I, Eichten SR, Swanson-Wagner RA, Yeh C-T, Xu W,
Schnable PS, Vaughn MW, Gehring M, Springer NM: Parent-of-origin effects
on gene expression and DNA methylation in the maize endosperm. Plant
cell 2011, 23(12):4221–4233.
39. Xin M, Yang R, Li G, Chen H, Laurie J, Ma C, Wang D, Yao Y, Larkins BA,
Sun Q, Yadegari R, Wang X, Ni Z: Dynamic expression of imprinted genes
associates with maternally controlled nutrient allocation during maize
endosperm development. Plant cell 2013, 25(9):3212–3227.
40. Zhang M, Zhao H, Xie S, Chen J, Xu Y, Wang K, Zhao H, Guan H, Hu X,
Jiao Y, Song W, Lai J: Extensive, clustered parental imprinting of
protein-coding and noncoding RNAs in developing maize endosperm.
PNAS 2011, 108(50):20042–20047.
41. Kang BH, Xiong YQ, Williams DS, Pozueta-Romero D, Chourey PS:
Miniature1-Encoded cell wall invertase is essential for assembly and
function of wall-in-growth in the maize endosperm transfer cell. Plant
Physiol 2009, 151(3):1366–1376.
42. Wang H-H, Wang Z, Wang F, Gu Y-J, Liu Z: Development of basal
endosperm transfer cells in Sorghum bicolor (L.) Moench and its
relationship with caryopsis growth. Protoplasma 2011, 249(2):309–321.
43. Zhong S, Joung J-G, Zheng Y, Chen Y-R, Liu B, Shao Y, Xiang JZ, Fei Z,
Giovannoni JJ: High-throughput illumina strand-specific RNA sequencing
library preparation. Cold Spring Harb Protoc 2011, doi:10.1101/pdb.prot5652(8).
44. Lee KH, Park J, Williams DS, Xiong Y, Hwang I, Kang BH: Defective
chloroplast development inhibits maintenance of normal levels of
abscisic acid in a mutant of the Arabidopsis RH3 DEAD-box protein
during early post-germination growth. Plant J 2013, 73(5):720–732.
45. Shimodaira H, Hasegawa M: Multiple comparisons of log-likelihoods
with applications to phylogenetic inference. Mol Biol Evol 1999,
16(8):1114–1116.
46. Martin M: Cutadapt removes adapter sequences from high-throughput
sequencing reads. EMBnet J 2011, 17(1):10–12.
47. Langmead B, Salzberg SL: Fast gapped-read alignment with Bowtie 2.
Nat Methods 2012, 9(4):357–359.
48. Wu TD, Nacu S: Fast and SNP-tolerant detection of complex variants and
splicing in short reads. Bioinformatics 2010, 26(7):873–881.
49. Trapnell C, Roberts A, Goff L, Pertea G, Kim D, Kelley DR, Pimentel H,
Salzberg SL, Rinn JL, Pachter L: Differential gene and transcript expression
analysis of RNA-seq experiments with TopHat and Cufflinks. Nat Protoc
2012, 7(3):562–578.
Xiong et al. BMC Plant Biology 2014, 14:204
/>
Page 14 of 14
50. Edgar RC: MUSCLE: multiple sequence alignment with high accuracy and
high throughput. Nucleic Acids Res 2004, 32(5):1792–1797.
51. Guindon S, Dufayard J-F, Lefort V, Anisimova M, Hordijk W, Gascuel O: New
algorithms and methods to estimate maximum-likelihood phylogenies:
assessing the performance of PhyML 3.0. Syst Biol 2010, 59(3):307–321.
52. Darriba D, Taboada GL, Doallo R, Posada D: ProtTest 3: fast selection of
best-fit models of protein evolution. Bioinformatics 2011, 27(8):1164–1165.
53. Yang Z: PAML 4: phylogenetic analysis by maximum likelihood. Mol Biol
Evol 2007, 24(8):1586–1591.
54. Wong WSW, Yang Z, Goldman N, Nielsen R: Accuracy and power of
statistical methods for detecting adaptive evolution in protein coding
sequences and for identifying positively selected sites. Genetics 2004,
168(2):1041–1051.
55. Combet C, Blanchet C, Geourjon C, Deleage G: NPS@: network protein
sequence analysis. Trends Biochem Sci 2000, 25(3):147–150.
doi:10.1186/s12870-014-0204-8
Cite this article as: Xiong et al.: Adaptive expansion of the maize
maternally expressed gene (Meg) family involves changes in expression
patterns and protein secondary structures of its members. BMC Plant
Biology 2014 14:204.
Submit your next manuscript to BioMed Central
and take full advantage of:
• Convenient online submission
• Thorough peer review
• No space constraints or color figure charges
• Immediate publication on acceptance
• Inclusion in PubMed, CAS, Scopus and Google Scholar
• Research which is freely available for redistribution
Submit your manuscript at
www.biomedcentral.com/submit