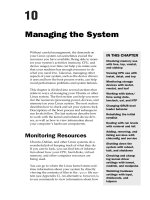
Managing the System
Bạn đang xem bản rút gọn của tài liệu. Xem và tải ngay bản đầy đủ của tài liệu tại đây (275.12 KB, 24 trang )
Managing the System
Without careful management, the demands on
your Linux system can sometimes exceed the
resources you have available. Being able to moni-
tor your system’s activities (memory, CPU, and
device usage) over time can help you make sure
that your machine has enough resources to do
what you need it to. Likewise, managing other
aspects of your system, such as the device drivers
it uses and how the boot process works, can help
avoid performance problems and system failures.
This chapter is divided into several sections that
relate to ways of managing your Ubuntu or other
Linux system. The first section can help you mon-
itor the resources (processing power, devices, and
memory) on your Linux system. The next section
describes how to check and set your system clock.
Descriptions of the boot process and subsequent
run levels follow. The last sections describe how
to work with the kernel and related device driv-
ers, as well as how to view information about
your computer’s hardware components.
Monitoring Resources
Ubuntu, Debian, and other Linux systems do a
wonderful job of keeping track of what they do.
If you care to look, you can find lots of informa-
tion about how your CPU, hard disks, virtual
memory, and other computer resources are
being used.
You can go to where the Linux kernel stores real-
time information about your system by directly
viewing the contents of files in the
/proc
file sys-
tem (see Appendix C). An alternative, however, is
to use commands to view information about how
IN THIS CHAPTER
Checking memory use
with free, top, vmstat,
and slabtop
Viewing CPU use with
iostat, dstat, and top
Monitoring storage
devices with iostat,
vmstat, and lsof
Working with dates/
time using date,
hwclock, cal, and NTP
Changing GRUB boot
loader behavior
Rebuilding the initial
ramdisk
Dealing with run levels
with runlevel and init
Adding, removing, and
listing services with
chkconfig and service
Shutting down the
system with reboot,
halt, and shutdown
Checking and chang-
ing kernel driver
settings with lsmod,
modinfo, and modprobe
Watching hardware
settings with lspci,
dmidecode, and
hdparm
82935c10.qxd:Toolbox 10/29/07 1:35 PM Page 187
your computer’s virtual memory, processor, storage devices, and network interfaces
are being used on your system.
There are commands that can monitor several different aspects of your system’s
resources. Because this book is not just a man page, however, we have divided the
following sections by topic (monitoring memory, CPU, and storage devices) rather
than by the commands that do them (
top
,
vmstat
, and
iostat
).
NOTE Some of the applications described in this section are installed by default in
Ubuntu, in packages such as the procps package. To use
iostat
or
sar
, however,
you need to install the sysstat package. Install the sysstat package with the follow-
ing command:
$ sudo apt-get install sysstat
Monitoring Memory Use
Few things will kill system performance faster than running out of memory. Commands
such as
free
and
top
let you see basic information about how your RAM and swap are
being used. The
vmstat
command gives detailed information about memory use and
can run continuously. The
slabtop
command can show how much memory the kernel
(slab cache) is consuming.
The
free
command provides the quickest way to see how much memory is being used on
your system. It shows the total amount of RAM (
Mem:
) and swap space (
Swap:
), along
with the amount currently being used. Here are examples of the
free
command:
$ free List memory usage in kilobytes (-k default)
total used free shared buffers cached
Mem: 742476 725108 17368 0 153388 342544
-/+ buffers/cache: 229176 513300
Swap: 1020116 72 1020044
$ free -m List memory usage in megabytes
total used free shared buffers cached
Mem: 725 706 18 0 148 333
-/+ buffers/cache: 223 501
Swap: 996 0 996
$ free -b List memory usage in blocks
total used free shared buffers cached
Mem: 760295424 742510592 17784832 0 157114368 350765056
-/+ buffers/cache: 234631168 525664256
Swap: 1044598784 73728 1044525056
$ free -mt List memory usage with totals displayed (Swap + Mem)
total used free shared buffers cached
Mem: 725 708 16 0 149 334
-/+ buffers/cache: 223 501
Swap: 996 0 996
Total: 1721 708 1013
$ free -g List memory usage in gigabytes
$ free -s 5 Continuously display memory usage every 5 seconds
Chapter 10: Managing the System
188
82935c10.qxd:Toolbox 10/29/07 1:15 PM Page 188
To avoid wasting RAM and speed up applications, Linux uses as much otherwise
unused RAM as possible for the disc cache. For that reason, the first line of output
from
free
that often shows little free RAM can be misleading. We recommend you
pay closer attention to the second line of output, which shows the amount of RAM
actually available for applications. That amount is 501MB in this example:
-/+ buffers/cache: 223 501
One way to guess how much memory you need on a system is to go to another com-
puter running Ubuntu, then open every application you think you may be running
at once. Run
free
with the total option (
free -t
) to see how much memory is being
used. Then make sure that your new system has at least that much total memory (with
most or all of it preferably being available in RAM).
The
top
command provides a means of watching the currently running processes, with
those processes sorted by CPU usage or memory (see Chapter 9 for a description of
top
for watching running processes). However, you can also use
top
to watch your mem-
ory usage in a screen-oriented way. Here is an example:
$ top
top - 14:14:59 up 3 days, 18:26, 1 user, load average: 0.11, 0.04, 0.01
Tasks: 114 total, 3 running, 111 sleeping, 0 stopped, 0 zombie
Cpu(s): 0.0%us, 0.0%sy, 0.0%ni,100.0%id, 0.0%wa, 0.0%hi, 0.0%si, 0.0%st
Mem: 742476k total, 727232k used, 15244k free, 153708k buffers
Swap: 1020116k total, 72k used, 1020044k free, 343924k cached
PID USER PR NI VIRT RES SHR S %CPU %MEM TIME+ COMMAND
2347 root 34 19 89552 77m 5636 S 0.0 10.7 6:05.75 yum-updatesd
2797 chris 18 0 80612 27m 18m S 0.0 3.8 0:01.29 nautilus
2814 chris 15 0 44420 22m 20m S 0.0 3.1 0:00.17 nm-applet
To exit
top
, press q. Like the output for
free
,
top
shows total of memory usage for
RAM (
Mem:
) and swap space (
Swap:
). However, because
top
is screen oriented and
provides ongoing monitoring, you can watch memory usage change every three sec-
onds (by default). With
top
running, press Shift+m and the running processes will be
displayed in memory-use order (so you can watch which processes are consuming the
most memory). The most useful column to analyze a process’ memory usage is
RES
,
which shows the process’ actual physical RAM usage, also known as resident size.
The
%MEM
column is based on this resident size.
For a more detailed view of your virtual memory statistics, use the
vmstat
command.
With
vmstat
you can view memory use over a given time period, such as since the previous
reboot or using a sample period. The following example shows
vmstat
redisplaying
statistics every three seconds:
$ vmstat 3
procs -----------memory--------- --swap-- ----io---- --system-- -----cpu-----
r b swpd free buff cache si so bi bo in cs us sy id wa st
1 0 97740 32488 3196 148360 0 0 0 1 26 3876 85 15 0 0 0
1 1 98388 7428 3204 151472 0 216 0 333 30 3200 82 18 0 0 0
1 0 113316 8148 2980 146968 0 4980 4 5121 79 3846 77 23 0 0 0
189
Chapter 10: Managing the System
82935c10.qxd:Toolbox 10/29/07 1:15 PM Page 189
2 0 132648 7472 2904 148488 0 6455 3 6455 90 3644 83 17 0 0 0
2 0 147892 8088 2732 144208 0 5085 9 5220 79 3468 84 16 0 0 0
1 0 157948 7680 2308 134812 0 3272 12 3296 69 3174 77 23 0 0 0
3 0 158348 7944 1100 123888 21 144 25 275 26 3178 86 14 0 1 0
2 0 166116 7320 568 120280 11 2401 20 2403 51 3175 84 16 0 0 0
3 0 181048 7708 648 119452 53 4852 796 4984 123 1783 86 13 0 1 0
To exit
vmstat
, press Ctrl+c. The
vmstat
example shows a 30-second time period
where more than 100 applications are started. Notice that when the free space goes
from 32488 kilobytes to 7428 kilobytes (RAM is filling up), data begins being moved
to the swap area (see the 216 under the so column). Because the swap area resides on
the hard disk, you can see that the block written to disk device (
bo
) increases as the
swap out increases. You can see the amount of swap space being used increasing
under the
swpd
column.
The CPU is also straining in the example, with no idle time showing (
id 0
). Notice
also that when some of the applications need to be swapped back in (see the last
three lines of output), the processor has to wait on two occasions for input/output
to complete (
wa 1
).
Here are some other options for using
vmstat
:
$ vmstat -S m Display output in 1000k megabytes
$ vmstat -S M Display output in 1024k megabytes
$ vmstat -S k Display output in 1000-byte kilobytes
$ vmstat -S K Display output in 1024-byte kilobytes
$ vmstat -n 2 10 Output every two seconds, repeat 10 times
$ vmstat -s | less Display event counters and memory statistics
$ vmstat -S M -s | less Display statistics in megabytes
725 M total memory
717 M used memory
486 M active memory
175 M inactive memory
7 M free memory
1 M buffer memory
120 M swap cache
996 M total swap
802 M used swap
193 M free swap
...
The previous example shows various memory statistics (
-s
) output in megabytes
(
-S M
), which we find more convenient to get a general view of memory usage. The
other examples show how to display
vmstat
output in megabytes and kilobytes (in
both marketing and technical terms). After that, the
-n 2 10
option tells
vmstat
to
repeat every set number of seconds (
2
) for a limited number of times (
10
).
With commands such as
ps
and
top
, you can see how much memory each application
is consuming on your system. The kernel itself, however, has its own memory cache to
190
Chapter 10: Managing the System
82935c10.qxd:Toolbox 10/29/07 1:15 PM Page 190
keep track of its resources, called the kernel slab. You can use the
vmstat
command to
display kernel slab memory cache statistics (from
/proc/slabinfo
) as follows:
$ vmstat -m | less Page through kernel slab memory cache
Cache Num Total Size Pages
nf_nat:help 2 13 308 13
nf_nat:base 0 0 276 14
bridge_fdb_cache 0 0 64 59
...
ext3_inode_cache 1236 2928 488 8
ext3_xattr 29 156 48 78
...
The slab memory cache information shows each cache name, the number of objects
active for that cache type, the total number of objects available for that cache type, the
size of the cache (in bytes), and the number of pages for each cache. You can display ker-
nel slab memory cache information in a screen-oriented view (similar to the
top
command) using
slabtop
:
$ slabtop
Active / Total Objects (% used) : 49127 / 70942 (69.2%)
Active / Total Slabs (% used) : 3094 / 3094 (100.0%)
Active / Total Caches (% used) : 101 / 145 (69.7%)
Active / Total Size (% used) : 8830.29K / 12013.73K (73.5%)
Minimum / Average / Maximum Object : 0.01K / 0.17K / 128.00K
OBJS ACTIVE USE OBJ SIZE SLABS OBJ/SLAB CACHE SIZE NAME
11600 4303 37% 0.13K 400 29 1600K dentry_cache
2928 1246 42% 0.48K 366 8 1464K ext3_inode_cache
4355 2535 58% 0.28K 335 13 1340K radix_tree_node
219 219 100% 4.00K 219 1 876K size-4096
4128 3485 84% 0.16K 172 24 688K filp
The
slabtop
output updates every three seconds. By default, slab caches are sorted
by the number of objects (first column) in each cache. By pressing c you can sort by
cache size instead (as shown in the previous example).
Monitoring CPU Usage
An overburdened CPU is another obvious place to look for performance problems
on your system. The
vmstat
command, shown earlier, can produce basic statistics
relating to CPU usage (user activity, system activity, idle time, I/O wait time, and
time stolen from a virtual machine). The
iostat
command (from the sysstat pack-
age), however, can generate more detailed reports of CPU utilization.
Here are two examples of using
iostat
to display a CPU utilization report:
$ iostat -c 3 CPU stats every 3 seconds (starting apps)
Linux 2.6.21-1.3194.fc7 (davinci) 08/10/2007
191
Chapter 10: Managing the System
82935c10.qxd:Toolbox 10/29/07 1:15 PM Page 191
avg-cpu: %user %nice %system %iowait %steal %idle
0.50 0.00 0.00 0.00 0.00 99.50
avg-cpu: %user %nice %system %iowait %steal %idle
28.71 0.00 5.45 18.32 0.00 47.52
avg-cpu: %user %nice %system %iowait %steal %idle
98.99 0.00 1.01 0.00 0.00 0.00
avg-cpu: %user %nice %system %iowait %steal %idle
99.50 0.00 0.50 0.00 0.00 0.00
$ iostat -c 3 CPU stats every 3 seconds (copying files)
Linux 2.6.21-1.3194.fc7 (davinci) 08/10/2007
avg-cpu: %user %nice %system %iowait %steal %idle
0.50 0.00 0.00 0.00 0.00 0.00
avg-cpu: %user %nice %system %iowait %steal %idle
0.50 0.00 24.88 74.63 0.00 0.00
avg-cpu: %user %nice %system %iowait %steal %idle
0.50 0.00 10.00 89.50 0.00 0.00
avg-cpu: %user %nice %system %iowait %steal %idle
0.50 0.00 17.41 82.09 0.00 0.00
avg-cpu: %user %nice %system %iowait %steal %idle
0.00 0.00 14.65 85.35 0.00 0.00
The first
iostat
example above starts with a quiet system, then several applications
started up. You can see that most of the processing to start the applications is being
done in user space. The second
iostat
example shows a case where several large
files are copied from one hard disk to another. The result is a high percentage of time
being spent at the system level, also known as kernel space (in this case, reading from
and writing to disk partitions). Note that the file copies also result in a higher amount
of time waiting for I/O requests to complete (%
iowait
).
Here are examples using
iostat
to print CPU utilization reports with timestamps:
$ iostat -c -t Print time stamp with CPU report
Linux 2.6.21-1.3194.fc7 (davinci) 08/10/2007
Time: 9:28:03 AM
avg-cpu: %user %nice %system %iowait %steal %idle
0.50 0.00 0.00 0.00 0.00 99.50
$ iostat -c -t 2 10 Repeat every 2 seconds for 10 times
The
dstat
command (dstat package) is available as an alternative to
iostat
for viewing
information about your CPU usage (as well as other performance-related items). One advan-
tage of
dstat
over other tools is that it more precisely shows the units of measurement
it is displaying (such as kilobytes or megabytes) and also uses colors to differentiate the
data. Here is an example of
dstat
for displaying CPU information:
$ dstat -t -c 3 View CPU usage continuously with time stamps
---time--- ----total-cpu-usage----
__epoch___|usr sys idl wai hiq siq
1189727284| 0 0 100 0 0 0
1189727287| 1 0 99 0 0 0
192
Chapter 10: Managing the System
82935c10.qxd:Toolbox 10/29/07 1:15 PM Page 192
1189727290| 3 0 97 0 0 0
1189727293| 0 0 100 0 0 0
1189727296| 5 0 95 0 0 0
1189727299| 1 0 99 0 0 0
1189727302| 3 0 97 0 0 0
1189727305| 0 0 100 0 0 0
1189727308| 3 0 96 0 1 0
1189727311| 1 0 99 0 0 0
1189727314| 0 0 100 0 0 0
1189727317| 0 0 100 0 0 0
1189727320| 1 0 99 0 0 0
1189727323| 5 0 95 0 0 0
1189727326| 3 0 97 0 0 0
1189727329| 3 0 97 0 0 0
1189727332| 2 0 98 0 0 0
1189727335| 5 0 95 0 0 0
In this example, the output includes a date/time values based on the start of the
epoch (
-t
) for the CPU report (
-c
) that is produced every three seconds (
3
). This
report runs continuously until you stop it (Ctrl+c).
If you want to find out specifically which processes are consuming the most process-
ing time, you can use the
top
command. Type
top
, then press Shift+p to sort by CPU
usage (this is the default sorting order):
$ top Display running processes and sort by CPU usage
Tasks: 120 total, 3 running, 116 sleeping, 0 stopped, 1 zombie
Cpu(s): 86.8% us, 6.0% sy, 0.0% ni, 3.3% id, 4.0% wa, 0.0% hi, 0.0% si
Mem: 482992k total, 476884k used, 6108k free, 1220k buffers
Swap: 5863716k total, 1166252k used, 4697464k free, 52984k cached
PID USER PR NI VIRT RES SHR S %CPU %MEM TIME+ COMMAND
9648 chris 16 0 309m 123m 16m R 72.6 26.1 287:55.22 firefox-bin
552 root 15 0 762m 65m 5732 S 15.6 14.0 4388:27 X
The full output would show many more processes, all sorted by current CPU usage
(
%CPU
column). In this example, Firefox web browser (72.6%) and the X display server
(15.6%) are consuming most of the CPU. If you decided you wanted to kill the Firefox
process, you could type k followed by the process ID of Firefox (9648) and the number
9 signal (if for some reason you couldn’t just close the Firefox window normally).
If you want information about the processor itself, you can view information directly from
the
/proc/cpuinfo
file. Here is an example:
$ cat /proc/cpuinfo View CPU information from /proc
processor : 0
vendor_id : AuthenticAMD
cpu family : 6
model : 4
model name : AMD Athlon(tm) processor
stepping : 4
193
Chapter 10: Managing the System
82935c10.qxd:Toolbox 10/29/07 1:16 PM Page 193
cpu MHz : 1340.080
cache size : 256 KB
...
flags : fpu vme de pse tsc msr pae mce cx8 apic mtrr pge mca cmov pat
pse36 mmx fxsr syscall mmxext 3dnowext 3dnow up
bogomips : 2680.91
clflush size : 32
An interesting thing to note about your CPU are the flags that represent features that
it supports. Some features in Ubuntu require that particular CPU extensions associ-
ated with those flags be on for the Ubuntu feature to work. For example, to use the
Xen virtualization para-virtualized guests, the
pae
flag must be set. To run fully vir-
tualized guests, the CPU must have either the
vmx
flag (for Intel processors) or
svm
flag (for AMD processors) extension support.
Similar information about your processor(s) is collected by the system at the very
beginning of the boot process, and can be obtained by looking at the beginning of
the output of the
dmesg
command.
Monitoring Storage Devices
Basic information about storage space available to your Linux file systems can be seen
using commands such as
du
and
df
(as described in Chapter 7). If you want details
about how your storage devices are performing, however, commands such as
vmstat
and
iostat
can be useful.
Some of the same kind of output from the
iostat
command shown earlier can be
used to tell if bottlenecks occur while doing disk reads and writes. Here’s an example:
$ iostat 3 Check disk reads and writes per disk
Linux 2.6.21-1.3194.fc7 (davinci) 08/11/2007
avg-cpu: %user %nice %system %iowait %steal %idle
13.15 0.60 0.59 0.16 0.00 85.49
Device: tps Blk_read/s Blk_wrtn/s Blk_read Blk_wrtn
sda 1.09 32.08 58.94 16086324 29554312
sdb 0.29 5.27 11.23 2644482 5631348
avg-cpu: %user %nice %system %iowait %steal %idle
1.00 0.00 42.14 45.15 0.00 11.71
Device: tps Blk_read/s Blk_wrtn/s Blk_read Blk_wrtn
sda 411.37 66515.05 2.68 198880 8
sdb 68.23 2.68 14696.99 8 43944
avg-cpu: %user %nice %system %iowait %steal %idle
0.67 0.00 41.00 58.33 0.00 0.00
Device: tps Blk_read/s Blk_wrtn/s Blk_read Blk_wrtn
sda 239.67 52530.67 106.67 157592 320
sdb 236.00 0.00 55077.33 0 165232
194
Chapter 10: Managing the System
82935c10.qxd:Toolbox 10/29/07 1:16 PM Page 194
The first part of the output of
iostat
shows averages of CPU usage since the last
reboot. The next part reflects processing that occurs when a large amount of data is
copied from the first disk (
sda
) to the second disk (
sdb
). High
iowait
values indicate
that disk input/output is the bottleneck on the system. In other words, faster disk
writing would improve performance more than a faster CPU.
The
vmstat
command can also list statistics about your disks. Here’s an example of
using
vmstat
to list information about disk reads and writes:
$ vmstat -d Display disk read, write, and input/output statistics
disk- -----------reads------------ ------------writes-------- ----IO---
total merged sectors ms total merged sectors ms cur sec
...
sda 332773 74844 19022380 2524211 245477 3473801 29758560 37140075 0 1372
sdb 79963 253716 2646922 2158000 76044 977122 8428140 12489809 0 506
The Linux system in this example has two hard disks (
sda
and
sdb
). You can see the
total number of sectors successfully read and written from those hard disks. You can
also see how many seconds were spent on input/output (
IO
) for those disks. Further -
more, you can see if there any I/O operations in progress, and you can also list read/
write information for selected disk partitions. Here is an example:
$ vmstat -p sda1 Display read/write stats for a disk partition
sda1 reads read sectors writes requested writes
174060 12993689 2778 22224
Unfortunately the preceding command does not work with softraid
md
partitions,
lvm
partitions, and some hardware RAID driver-specific devices.
If you want to find out what files and directories are currently open on your storage devices, you can
use the
lsof
command. This command can be particularly useful if you are trying to
unmount a file system that keeps telling you it is busy. You can check what open file
is preventing the unmount and decide if you want to kill the process holding that file
open and force an unmount of the file system. Here is an example of
lsof
:
$ lsof | less List processes holding files and directories open
COMMAND PID USER FD TYPE DEVICE SIZE NODE NAME
init 1 root cwd DIR 8,5 4096 2 /
init 1 root rtd DIR 8,5 4096 2 /
init 1 root txt REG 8,5 38620 2049530 /sbin/init
...
bash 23857 chris cwd DIR 8,1 4096 2719746 /mnt/sda1/dx
The first files shown as being open are those held open by the
init
process (the first
running process on the system). Files held open by system processes (such as
udevd
)
and daemons (such as
sshd
and
syslogd
) follow
init
. Eventually, you will see files
held open by individual users (which are probably the ones you are interested in if
you are unable to unmount a disk partition).
195
Chapter 10: Managing the System
82935c10.qxd:Toolbox 10/29/07 1:16 PM Page 195