Antioxidant activity of polyphenolic compounds isolated from ethyl-acetate fraction of Acacia hydaspica R. Parker
Bạn đang xem bản rút gọn của tài liệu. Xem và tải ngay bản đầy đủ của tài liệu tại đây (1.99 MB, 13 trang )
Afsar et al. Chemistry Central Journal (2018) 12:5
/>
Open Access
RESEARCH ARTICLE
Antioxidant activity of polyphenolic
compounds isolated from ethyl‑acetate fraction
of Acacia hydaspica R. Parker
Tayyaba Afsar1*, Suhail Razak2,3, Maria Shabbir1,4 and Muhammad Rashid Khan1
Abstract
Background: Acacia hydaspica belongs to family leguminosae possess antioxidant, anti-inflammatory and anticancer
activities. During our search for antioxidant compounds from A. hydaspica, we carried out bioassay guided fractionation and obtained antioxidant compounds with free radical scavenging activity.
Materials and methods: The polyphenol compounds in the plant extract of A. hydaspica were isolated by combination of different chromatographic techniques involving vacuum liquid chromatography and medium pressure liquid
chromatography. The structural heterogeneity of isolated compounds was characterized by high pressure liquid
chromatography, MS–ESI and NMR spectroscopic analyses. The antioxidant potential of isolated compounds has been
investigated by 1,1-diphenyl-2-picrylhydrazyl (DPPH), nitric oxide scavenging potential, hydroxyl radical scavenging
potential, ferric reducing/antioxidant power (FRAP) model systems and total antioxidant capacity measurement.
Results: The isolated compounds show the predominance of signals representative of 7-O-galloyl catechins,
catechins and methyl gallate. Flash chromatographic separation gives 750 mg of 7-O galloyl catechin, 400 mg of catechin and 150 mg of methyl gallate from 4 g loaded fraction on ISCO. Results revealed that C1 was the most potent
compound against DPPH (EC50 1.60 ± 0.035 µM), nitric oxide radical (EC50 6 ± 0.346 µM), showed highest antioxidant
index (1.710 ± 0.04) and FRAP [649.5 ± 1.5 µM Fe(II)/g] potency at 12.5 µM dose compared to C2, C3 and standard
reference, whereas C3 showed lower EC50 values (4.33 ± 0.618 µM) in OH radical scavenging assay.
Conclusion: Present research reports for the first time the antioxidant activity of polyphenolic compounds of A.
hydaspica. Result showed good resolution and separation from other constituents of extract and method was found
to be simple and precise. The isolation of catechin from this new species could provide a varied opportunity to obtain
large quantities of catechin and catechin isomers beside from green tea. Free radical scavenging properties of isolated
catechin isomers from A. hydaspica merit further investigations for consumption of this plant in oxidative stress related
disorders.
Keywords: Acacia hydaspica, Chromatographic techniques, Catechin isomers, Antioxidant potential
Background
Natural products from medicinal plants, either as pure
compounds or as standardized extracts, provide unlimited opportunities for new drug leads because of the
unmatched availability of chemical diversity. Due to
chemical diversity in screening programs, interest has
*Correspondence:
1
Department of Biochemistry, Faculty of Biological Sciences, Quaid-iAzam University, Islamabad, Pakistan
Full list of author information is available at the end of the article
now grown throughout the world for making therapeutic
drugs from natural products [1]. However, the isolation of
compounds remains a challenging and a mammoth task.
Conventionally, the isolation of bioactive compounds is
preceded by the determination of the presence of such
compounds within plant extracts through a number of
bioassays [2]. The phytochemicals have been found to
act as antioxidants by scavenging free radicals, and many
have therapeutic potential for the remedy of diseases
resulting from oxidative stress [3]. Within the antioxidant
© The Author(s) 2018. This article is distributed under the terms of the Creative Commons Attribution 4.0 International License
( which permits unrestricted use, distribution, and reproduction in any medium,
provided you give appropriate credit to the original author(s) and the source, provide a link to the Creative Commons license,
and indicate if changes were made. The Creative Commons Public Domain Dedication waiver ( />publicdomain/zero/1.0/) applies to the data made available in this article, unless otherwise stated.
Afsar et al. Chemistry Central Journal (2018) 12:5
compounds, considerable attention has been devoted to
plant derived flavonoids and phenolic. Due to the presence of the conjugated ring structures and hydroxyl
groups, many phenolic compounds have the potential
to function as antioxidants by scavenging or stabilizing free radicals involved in oxidative processes through
hydrogenation or complexing with oxidizing species [3].
Moreover, naturally occurring agents with high effectiveness and fewer side effects are desirable as substitutes
for chemical therapeutics which have various and severe
adverse effects [4]. Plants comprising phenolic constituents, such as phenolic diterpenes, flavonoids, phenolic
acids, tannins and coumarins are possible sources of natural antioxidants. Numerous studies have revealed that
these natural antioxidants possess numerous pharmacological activities, including neuroprotective, anticancer,
and anti-inflammatory activities, and that these activities
may be related to properties of antioxidant compounds to
prevent diseases by scavenging free radicals and delaying
or preventing oxidation of biological molecules [5].
There are different methods to evaluate the in vitro
antioxidant capacity of isolated compounds, mixtures of
compounds, biological fluids and tissues which involve
different mechanisms of determination of antioxidant
activity, for example: chemical methods based on scavenging of ROS or RNS, such as nitric oxide (NO∙) radical,
DPPH radical and the hydroxyl radical (OH∙) radical [5,
6]. Other assays to determine the total antioxidant power
include techniques such as phosphomolybdenum assay
(TAC) [6], the ferric reducing/antioxidant power method
[7]. Various reaction mechanisms are usually involved in
measuring the antioxidant capacity of a complex samples
and there is no single broad-spectrum system which can
give an inclusive, precise and quantitative prediction of
antioxidant efficacy and antiradical efficiency [6], hence,
more than one technique is suggested to evaluate the
antioxidant capacities [8].
Acacia is a diverse genus comprising range of bioactive constituent such as phenolic acids [9], alkaloids [10],
terpenes [11], tannins [12] and flavonoids [13], which
are responsible for various biological and pharmacological properties like hypoglycaemic, anti-inflammatory,
antibacterial, antiplatelet, antihypertensive, analgesic,
anticancer, and anti-atherosclerotic due to their strong
antioxidant and free radical scavenging activities [14].
Acacia hydaspica R. Parker belongs to family “Fabaceae
(Leguminosae)”. This species is reported to be common
in Iran, India and Pakistan, commonly used as fodder,
fuel and wood [15]. The bark and seeds are the source
of tannins. The plant is locally used as antiseptic. The
traditional healers use various parts of the plant for the
treatment of diarrhea; the leaves and the bark are useful in arresting secretion or bleeding. Acacia hydaspica
Page 2 of 13
possesses antioxidant, anticancer, anti-hemolytic, antiinflammatory, antipyretic, analgesic and antidepressant
potentials [16–18]. Anticancer activity of A. hydaspica
polyphenols has been determined against breast and
prostate cancer [19].
In present study we determined the antioxidant activity
of purified compounds from A. hydaspica by using five
in vitro methods based on different mechanisms of determination of the antioxidant capacity in comparison with
reference compounds. The inter-relationships between
these methods were also examined for all the tested compounds to check the linearity of activity against different
oxidants. Compounds showed linear activity in different
antioxidant assays.
Materials and methods
Experimental
Plant collection
The aerial parts (bark, twigs, and leaves) of A. hydaspica
were collected from Kirpa charah area Islamabad, Pakistan. Plant specimen was identified by Dr. Sumaira Sahreen (Curator at Herbarium of Pakistan, Museum of
Natural History, Islamabad). A voucher specimen with
Accession No. 0642531 was deposited at the Herbarium
of Pakistan, Museum of Natural History, Islamabad for
future reference.
Preparation and extraction of plant material
Partial purification or separation of crude methanol
extract was done by solvent–solvent extraction. Briefly
12 g of crude methanol extract was suspended in 500 ml
distilled water in separator funnel (1000 ml) and successively partitioned with n-hexane, ethyl-acetate, chloroform and n-butanol. Each extraction process was
repeated three times with 500 ml of each solvent same
process was repeated to get enough mass of each fraction to use for chromatographic separation. These solvents with varying polarities theoretically partitioned
different plant constituents. The filtrate was concentrated using rotary evaporator (Buchi, R114, Switzerland)
and weigh to determine the resultant mass. After this
initial partitioning we got four soluble extracts beside
crude methanol extract and remaining aqueous extract.
The ethyl-acetate (AHE) and butanol (AHB) fractions
revealed significant antioxidant potential in various
in vitro antioxidant enzyme assays. Estimation of total
phenolic content (TPC) and total flavonoid content
(TFC) indicate that these AHE and AHB possess high
TPC (120.3 ± 1.15,129 ± 2.98 mg Gallic acid equivalent/g
dry sample) and TFC (89 ± 1.32, 119 ± 1.04 mg rutin
equivalent/g dry sample) respectively [18]. These results
prompted us to choose these two extracts for further
fractionation and purification of active compounds. Here
Afsar et al. Chemistry Central Journal (2018) 12:5
Page 3 of 13
we report only the isolation and fractionation of ethylacetate extract. The scheme of fractionation is summarized in Fig. 1.
from sigma chemicals. All organic solvents were of HPLC
grade. Water was purified by a Milli-Q plus system from
Millipore (Milford, MA).
General procedure and reagents
Vacuum liquid chromatography
Mass spectrometer with both ESI and APCI spectra
were obtained using a TSQ Quantum Triple Quadrupole
(Thermo Scientific) ion sources. TLC was conducted on
pre-coated silica gel 6OF254 plates (MERCK) spots were
visualized by UV detection at 254 and 365 nm and Vanillin-HCL reagent followed by heating Semi-preparative
HPLC was carried out using a agilent 1260 affinity LC
system UV array detection system using a semi-preparative column (Vision H
T™ classic; 10 μm, 250 × 10 mm).
Flash liquid chromatography was carried on Combi-flash
Teledyn ISCO (using Redisep column 40 g silica, mobile
phase was dichloromethane:methanol (DCM:MeOH),
flow rate 15 ml/min) with an ISCO fraction collector. Silica gel (230–400 mesh; Davisil, W. R. Grace) was used for
open-column chromatography or vacuum liquid chromatography (VLC). All pure chemicals were purchased
The ethyl-acetate acetate extract (AHE) was fractionated
with DCM:MeOH of increasing gradient polarity starting with 100% DCM (dichloromethane) to 100% MeOH
(methanol) using vacuum liquid chromatographic (VLC)
separation. Briefly 10 g of ethyl-acetate extract was dissolve in DCM, mixed with neutral acid wash (super cell
NF) and dried down completely with rotavap. Pack 3/4
volume of glass column used for VLC with silica gel and
load dried extract sample over the silica layer. After VLC
separation, ethyl acetate extract sample was fractionated
into 12 fractions of DCM:MeOH in the following gradients; 1:0, 9:1, 8:2, 7:3, 6:4, 5:5, 4.5:5.5, 4:6, 3.5:6.5, 3:7, 2:8,
1:9, 0:1 (v/v). The 7:3 to 5:5 (DCM:MeOH) eluents (VLCAHE/F3–F4) were mingled according to their TLC and
1
H-NMR spectra similarity subjected to flash chromatography for further purification of the target compounds.
Fig. 1 Schematic representation of extraction and isolation of antioxidant compounds from A. hydaspica ethyl acetate extract
Afsar et al. Chemistry Central Journal (2018) 12:5
Flash liquid chromatography
VLC-AHE/F4–F6 (4 g/mixed in acid wash/dried) was
loaded on Combi-flash Teledyn ISCO. Specifications of
run are as follow.
Redisep column: 40 g silica, flow rate: 15 ml/ml, solvent A: dichloromethane (DCM), solvent B: methanol
(MeOH), wavelength 1 (red): 205 nm, wavelength 2 (purple): 254 nm all wavelength (orange 200–780 nm) was
monitored at all wavelengths (200–780 nm) with Peak
width 2 min, and Thresh hold 0.02 AU. Air purge was set
at 1 min peak tube volume: 5 ml, nonpeak tube volume
15 ml and loading type solid. 146 fractions collected with
ISCO were pooled into 27 fractions according to their
TLC and ISCO chromatogram spectral peaks. 1HNMR
fraction indicated the presence of three pure compounds
(C1, C2 and C3).
High performance liquid chromatography
Chromatographic analysis was carried out to check the
purity of isolated compounds by using HPLC–DAD (Agilent USA) attached with Grace Vision Ht C18 column
(Agilent USA) analytical column. Compounds stock solutions were prepared in methanol, at a concentration of
0.5 mg/ml. Samples were filtered through 0.45 μm membrane filter. Briefly, mobile phase A was H
2O (prepared
by a Milli-Q water purification system (Millipore, MA,
USA) and mobile phase B was acetonitrile. A gradient of
time was set as; 0–5 min (isocratic run) for 85% A in 15%
B, 5–25 min for 15–100% B, and then isocratic 100% B till
30 min was used. The flow rate was 1 ml/min and injection volume was 20 μl. All the samples were analyzed at
220, 254, 280, 330, and 360 nm wavelengths. Every time
column was reconditioned for 10 min before the next
analysis. All chromatographic operations were carried
out at ambient temperature.
% content of isolated compounds
The total content of each isolated compound was
expressed as a percentage by mass of the sample.
Nuclear magnetic resonance spectroscopy (NMR)
1
H- and 13C-NMR spectrum for all compounds was
recorded on a CDD NMR instrument: Varian 600 MHz
(1H and 13C frequencies of 599.664 and 150.785 MHz,
respectively) at 25 °C using triple resonance HCN probe:
for 1-D proton spectra and proton-detected experiments
such as COSY, NOESY, and HMQC. Probe signal-tonoise specifications: 1H 1257:1 and broadband switchable probe was used for 13C. Chemical shifts were given
in δ value Spectra of all compounds were obtained in
methanol-d4 and DMSO-d6, typically 3–10 mg in 0.4 ml.
Conventional 1D and 2D Fourier transform techniques
were employed as necessary to achieve unequivocal
Page 4 of 13
signal assignments and structure proof for all compounds
independently. In addition to 2D shift-correlation experiments (H–H COSY with long-range connectivity’s; C–H
correlation via 1
JCH), extensive use was made of 1H-cou13
pled C spectra and selective 1H-decoupling to determine long range JCH coupling constants and to assign
all quaternary carbons unambiguously (DEPTH). Where
necessary, stereo-chemical assignments were made with
2D ROESY and NOESY experiments. Detailed analysis
of resolution enhanced spectra (Peak picking, integration, multiplet analysis) was performed using ACD/NMR
processor (Advanced Chemistry Development, Inc). 1H
and 13C chemical shifts are reported in ppm relative to
DMSO-d6 (δ 2.5 and δ 39.5 for 1H and 13C respectively),
CD3OD (δ 3.31, 4.78 for 1H and δ 49.2 for 13C) or internal
standard Me4Si (TMS, δ = 0.0). The NMR spectra and
chemical shifts of isolated compounds are matched with
published data.
Antioxidant capacity determination assays
An amount of 10 mM stock solution of each compound
and positive controls [Ascorbic acid, butylated hydroxytoluene (BHT) and Gallic acid] were prepared in 1 ml of
solvent according to the assay protocol. These solutions
were further diluted to get (0–100 µM) concentration.
Positive control varied according to assay requirement.
Radical scavenging activity
DPPH radical scavenging activity assay
The DPPH assay was done according to the method previously describe with slight modifications [20]. The stock
solution was prepared by dissolving 24 mg DPPH with
100 ml methanol (80%) and then stored at 20 °C until
needed. The working solution was obtained by diluting
DPPH solution with methanol to obtain an absorbance
of about 0.751 ± 0.02 at 517 nm using the spectrophotometer. An aliquot of 1 ml aliquot of this solution was
mixed with 100 μl of the samples at varying concentrations (0–100 µM). The mixture was mixed vigorously
and allowed to stand at room temperature in the dark for
10 min. The absorbance of the solution was measured at
517 nm using a UV-1601 spectrophotometer (Shimadzu,
Kyoto, Japan). Ascorbic acid was used as a reference compound. The decrease in absorbance was correlated with
the radical scavenging potential of test samples. The percentage of inhibition was calculated as follow
DPPH scavenging (%) =
A0 − (A1 − As)
× 100.
A0
where 0 is the absorbance of the DPPH solution, 1 is
the absorbance of the test compound in the presence of
DPPH solution, and is the absorbance of the compound
solution without DPPH. Each sample was analyzed in
Afsar et al. Chemistry Central Journal (2018) 12:5
triplicate. The EC50 value was calculated by a graphical
method as the effective concentration that results in 50%
inhibition of radical formation [35].
Non site‑specific hydroxyl radical scavenging activity
The hydroxyl radical-scavenging activity was monitored
using 2-deoxyribose method of Halliwell et al. [21]. Phosphate buffer saline (0.2 M, PH 7.4) was used as a solvent
in this assay. Sample solution (0–100 µM) was mixed with
assay mixture containing 2.8 mM 2-deoxyribose, 20 mM
ferrous ammonium sulphate solution, 100 µM EDTA in
a total volume of 1 ml of solvent buffer (0.2 M phosphate
buffer saline, PH 7.4). Ferrous ion solution and EDTA were
premixed before adding to the assay mixture. The reaction
was initiated by the addition of 100 µl of 20 mM H2O2 and
100 µl of 2 mM Ascorbic acid and incubated at 37 °C for
15 min. Then, thiobarbituric acid solution (1 ml, 1%, w/v)
and trichloroacetic acid solution (1 ml, 2%, w/v) were added.
The mixture was boiled in water bath for 15 min and cooled
in ice, and its absorbance was measured at 532 nm. All
experiments involving these samples were triplicated. The
scavenging activity were calculated by following formula.
Radical − scavenging capacity (%)
Control absorbance − sample absorbance
=
control absorbance
× 100
EC50 values, which represent the concentration of
sample that caused 50% hydroxyl radical-scavenging
activity, were calculated from the plot of inhibition percentage against sample concentration. BHT was used as a
positive control.
Nitric oxide radical scavenging activity
The interaction of isolated compounds with nitric oxide
was accessed by nitrite detection method as previously
describe [22]. Nitric oxide was generated with Sodiumnitroprusside previously bubbled with and measured
by the Greiss reaction. 0.25 ml of sodium-nitroprusside
(10 mM) in phosphate buffer saline was mixed with
0.25 ml of different concentrations (0–100 µM) of compounds and incubated at 30 °C in dark for 3 h. After incubation 0.25 ml of Greiss reagent A (1% sulphanilamide
in 5% phosphoric acid) was added and kept at 30 °C for
10 min. After incubation, 0.25 ml of Greiss reagent B
(0.1% N 1-naphthylethylenediamine di-hydrochloride)
was added mixed and incubated for 20 min. The absorbance of chromophore form during the diazotization of
nitrite with sulphanilamide and subsequent coupling
with naphthyl-ethylenediamine was read at 546 nm. The
same reaction mixture without extract was served as
control
Page 5 of 13
% inhibition = 1 −
sample absorbance
control absorbance
× 100.
Rutin was used as a positive control.
Determination of antioxidant activity
Total antioxidant capacity (TAC) (phosphomolybdate assay)
The total antioxidant capacity of compounds was investigated by phosphomolybdate method of Afsar et al. [18].
An aliquot of 100 µl of each sample was mixed with 1 ml
of reagent (0.6 M H2SO4, 0.028 M sodium phosphate,
and 0.004 M ammonium molybdate) and incubated for
90 min at 95 °C in a water bath. Absorbance was recorded
at 765 nm after the mixture cooled to room temperature.
Ascorbic acid served as positive control.
Ferric reducing antioxidant power (FRAP)
A slightly modified method of Benzei and Strain [7] was
adopted to estimate the ferric reducing ability of compounds isolated from A. hydaspica. Ferric-TPTZ reagent (FRAP) was prepared by mixing 300 mM acetate
buffer, pH 3.6, 10 mM TPTZ in 40 mM HCl and 20 mM
FeCl3·6H2O at a ratio of 10:1:1 (v/v/v). Compounds or
reference were allowed to react with FRAP reagent in the
dark for 30 min. In order to calculate FRAP values (µM
Fe(II)/g) for compounds, linear regression equation for
standard (FeSO4·7H2O) was plotted. The standard curve
was linear between 100 and 1000 µM F
eSO4. Results are
expressed as μM (Fe(II)/g) dry mass.
Statistical analysis
All values are mean of triplicates. The Graph Pad Prism
was used for One-way ANOVA analysis to assess the difference between various groups and calculation of E
C50
values. Difference at p < 0.05 were considered significant.
In addition, simple regression analysis on Microsoft excel
was performed to seek relationship between different
tests.
Chemistry
Compound 1: 7‑O‑galloyl‑(+)‑catechin
Light green shine crystals (H2O), C22 H 18 O10. MS/ESI(−)
m/z 441.0977 [M−H], 1H-NMR (600 MHz, DMSO-d6),
δ 7.04 (H-7, s, galloyl), δ 6.17 (H-8, J = 2.2 Hz), δ 6.11
(H-6, d, J = 2.2 Hz), δ 4.61 (H-2, d, J = 7.6 Hz), δ 3.88–
3.93 (H-3, m), δ 2.52 (H-4a, dd, J = 16.7 Hz, J = 7.9 Hz),
δ 2.71 (H-4b, dd, J = 16.3 Hz, J = 5.3 Hz). 13C NMR
(methanol-d4-150.79 MHz): δ 27.21 (t, C-4), δ 66.941 (d,
C-3), δ 81.975 (d, C-2), δ 100.946, δ 104.52 (each d, C-6
and C-8), δ 105.957 (s, C-4a), δ 109.179 (d, galloyl C-2
and C-6), δ 113.832, δ 114.548 (each d, C-2′ and C-5′), δ
119.201 (s, galloyl C-1), δ 130.656 (s, C-1′), δ 138.88 (s,
Afsar et al. Chemistry Central Journal (2018) 12:5
galloyl, C-4), δ 144.973 (s, galloyl, C3 and C-5), δ 150.343
(s, C-7), δ 155.354, δ 156.070 (each s, C-5 and C-8a),
δ165.734 (s, COO–).
Compound 2: Catechin
Light yellow amorphous powder, (H2O) (C15H14O6). MS/
ESI(−) m/z [M−H]. 1H-NMR (DMSO-d6, 600 MHz): δ
5.67 (H-8 d, J = 2.3 Hz), δ 5.87 (H-6, d, J = 1.8 Hz), δ 4.46
(H-2, d, J = 7.6 Hz), δ 3.76–3.82 (H-3, m), δ 2.33 (H-4α,
dd, J = 16.1 Hz, J = 7.9 Hz), δ 2.64 (H-4β, dd, J = 16.4 Hz,
J = 5.3 Hz), δ 6.7 (H-2′, d, J = 1.8 Hz), δ 6.66 (H-5′,
d, = 8.2 Hz), δ 6.57 (H-6′, dd, J = 8.2 Hz, J = 1.8 Hz). 13CNMR (DMSO-d6-150.79 MHz). δ 28.01 (C-4), δ 66.717
(C-3), δ 81.411 (C-2), δ 94.314 (C-8), δ 95.389 (C-6), δ
99.331 (C-4a), δ 114.026 (C-2′), δ 115.10 (C-5′), δ 118.685
(C-6′), δ 130.870 (C-1′), δ 145.206 (C-4′), δ 146.281
(C-3′), δ 156.317 (C-5), δ 156.317 (C-8a), δ 156.317 (C-7).
Compound 3: Methyl gallate
White needle crystals.
(C8H8O5). MS/ESI(−) m/z
183.0534 [M−H]. 1H-NMR (acetone-D6, 600 MHz),:
δ3.79 (3H, s, OCH3), δ 7.11 (2H, s, H-2, H-6); 13C NMR
(acetone-D6, 150.80 MHz) δ 51.0 (OCH3), δ 108.90 (C-2,
C-6), δ 120.91 (C-1), δ 137.76 (C-4), δ 145.12 (C-3, C5), δ
166.27 (C=O).
Results and discussion
The ethyl-acetate fraction of A. hydaspica whole plant
was fractionated by VLC chromatography and flash
chromatography using silica to give several fractions and
three pure compounds C1, C2 and C3. ISCO chromatogram showed the peaks and pattern of collection of isolated compounds (Additional file 1: Figure S1). Isolated
compounds were identified as 7-O galloyl catechin (C1),
Page 6 of 13
catechin (C2) [23, 24] and methyl gallate (C3) [25] by
comparison of their 1D and 2D NMR spectral data with
the reported data in the literature (Tables 1, 2; Additional
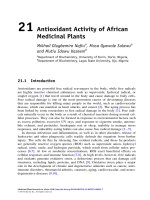
file 2: Figure S2). Figure 2 indicated the Purity of the
compounds analyzed by analytical HPLC.
Compound 1
The 1HNMR spectrum of C1 was similar to 1HNMR of
(+)-catechin except for the additional signal at δ 7.04
(2H, s) due to a galloyl group. The location of the galloyl
group was initially deduced to be at either C-5′ OH or
C-7′ OH, C-4′ OH, C-3′ OH but not 3 of the catechins
moiety from the HMBC spectrum in methanol-d4. In
order to determine unequivocally the position of the galloyl group the HMBC was re-perform with DMSO and
NOESY data indicate that the stereochemistry of isolated
compound as 7-O-galloyl-(+)-catechin and which was
further authenticated by comparison of the physical data
with those reported previously [24, 26]. Consequently,
the structure of C1 was concluded to be 7-O-galloyl-(+)
catechin.
Compound 2
The 1HNMR spectrum and 13C-NMR of C2 was similar
to assignment of catechin signals of those reported in
previous literature [27, 28]. Consequently, the structure
of C2 was concluded to be (+) catechin.
Compound 3
The molecular formula was determined from the MS and
13C NMR. 8 Carbons and five protons attached to carbon were observed in the 13C and 1HNMR spectra. In
order to determine the position and number of hydroxyl
groups, the NMR solvent was shifted to DMSO-d6
Table 1 1H-NMR data of polyphenols isolated from Acacia hydaspica (Coupling constant J in Hertz)
Proton
7-O-galloyl catechin
δ in ppm
(C1)a
(+)-catechin
δ in ppm
(C2)a
Methyl gallate
δ in ppm
(C3)b
H-2
4.61 (d, J = 7.0 Hz)
4.46 (d, J = 7.6 Hz)
7.11 (s)
H-3
3.88–3.94 (m)
3.79–3.82 (m)
3.79 (s, OCH3)
H-4α
b
2.71 (dd, J = 16.3 Hz, J = 5.3 Hz)
2.45 (dd, J = 16.5, 7.9 Hz)
2.64 (dd, J = 16.4, 5.3 Hz)
2.33 (dd, J = 16.1, 7.9 Hz)
–
H-6
6.11 (d, J = 2.2 Hz)
5.67 (d, J = 2.3 Hz)
7.11 (s)
H-8
6.17 (d, J = 2.2 Hz
5.87 (d, J = 1.8 Hz)
–
H-2′
6.72 (d, J = 1.5 Hz)
6.70 (d, J = 1.8)
–
H-5′
6.68 (d, J = 8.1 Hz)
6.67 (d, J = 8.2 Hz)
–
H-6′
6.60 (dd, J = 8.1 Hz, J = 1.5 Hz)
6.57 (dd, J = 8.2 Hz, J = 1.8 Hz)
–
OH-3
5.01 (d, J = 5.1 Hz)
4.84 (d, J = 4.7 Hz)
–
Galloyl
7.04 (s)
–
–
Coupling constants (Hz) in parenthesis, a DMSO-d6 b indicates acetone–d6. Dashes indicate that given proton is absent the molecule
Afsar et al. Chemistry Central Journal (2018) 12:5
Page 7 of 13
Table 2 13C NMR data of polyphenols isolated from Acacia
hydaspica ethyl-acetate extract
Carbon
7-O-galloyl-catechins
δ in ppm
(GC; C1)a
(+)-catechins
δ in ppm
(C; C2)a
Methyl gallate
δ in ppm
(MG; C3)b
C-1
–
–
120.912
C-2
81.975
81.411
108.901
C-3
66.941
66.717
145.121
C-4
27.211
28.012
137.760
C-4a
105.957
99.331
–
C-6
100.946
94.314
108.901
C-8
104.521
95.389
–
C-5
155.354
156.317
145.120
C-7
150.343
156.317
–
C-8a
156.070
156.317
–
C-1′
130.656
130.870
–
C-2′
113.832
114.026
–
C-3′
–
146.281
–
C-4′
–
145.206
–
C-5′
114.548
115.101
–
C-6′
–
118.685
–
C-1 galloyl
119.201
–
–
C-2 galloyl
109.179
–
–
C-3 galloyl
144.973
–
–
C-4 galloyl
138.881
–
–
C-5 galloyl
144.973
–
–
C-6 galloyl
109.179
–
–
COO–
165.734
–
–
C=O
–
–
166.270
Methyl
–
–
51.012
a
b
DMSO-d6 and indicates acetone–d6. Dashes indicate that given carbon is
not present in the molecule
as hydroxyl were not seen with acetone-d6. 1H-NMR
(DMSO-d6, 600 MHz) clearly reveal the presence two
hydroxyls at δ9.44 and one hydroxyl at δ9.11. Close
examination of the 1H and 13C NMR spectrum showed
a symmetrical molecule with two aromatic protons, δ
7.11 (2H, s, H-2, H-6), three hydroxyl, two hydroxyl at
δ C 145.12 (C-3, C-5), and one hydroxyl at δ C 137.76
(C-4), a methyl δ3.79 (3H, s, OCH3) and a ester carbonyl
δ 166.27 (C=O). It is consistent with-NMR data have
been reported from the literature [14, 15]. The structure
(C3) revealed to be methyl 3, 4, 5-trihydroxybenzoate or
methyl gallate.
Extractable compound yield
Acacia hydaspica ethyl-acetate extract (AHE) yields
187.5 mg/g of C1, 100 mg/g of C2 and 37.5 mg/g of C3.
Determination of anti‑radical activity
DPPH radical scavenging
The first method, DPPH radical scavenging activity indicates the hydrogen donating ability of compounds. The
DPPH free organic nitrogen radical is very stable; contain an odd electron which reacts with compounds that
can donate hydrogen atoms. DPPH on accepting electron
donated by an antioxidant compound reduces and the
purple color is change to yellow. The degree of reduction in absorbance measurement is indicative of scavenging potential of compounds [29]. Thus, we evaluated
the free radical-scavenging activity of three polyphenols from A. hydaspica. All test compounds exhibited
dose dependent quenching of DPPH radical. C1, C2,
and C3 exhibited the similar antioxidant activities. At a
concentration of 100 μM, the scavenging activity of C1,
C2 and C3 reached 96.174 ± 1.95, 93.83 ± 0.85 and
94.527 ± 1.170% respectively, while at the same concentration that of Ascorbic acid and rutin were 87.97 ± 2.654
and 92.160 ± 3.2% respectively. All compounds showed
better antioxidant activity than the positive controls
(Ascorbic acid and Gallic acid), and the highest DPPHscavenging activity was shown by compound C1, followed by compounds C3, and C2 (Fig. 3a, Table 3). The
EC50 value for C1 was 1.60 ± 0.035 μM which is fivefold
more potent than Gallic acid (9.1 ± 0.42 μM) and 22 fold
more potent then Ascorbic acid (36.3 ± 0.569 µM). The
relative potencies of the compounds were in the order:
C1 > C3 > C2 > rutin > Ascorbic acid. Compounds C2
and C3 had been investigated on DPPH-scavenging
activities previously. The E
C50 value for catechin (2) was
6.24 ± 0.254 µM in the DPPH assay was similar to that
reported in Hsu et al. study (EC50 value 6.38) [5, 30]. The
EC50 value for methyl gallate (C3) was 2.92 μM in the
DPPH assay, and this data indicate slightly lower EC50
value to that reported in Pfundstein’s study (EC50 value
4.28 μM) [31]. From these results, it was also possible to
make a number of correlations regarding the relationship
between the structure of isolated compounds and their
DPPH-scavenging activities. Methyl gallate (C3) which is
the methyl ester of Gallic acid appeared to enhance the
bioactivity of Gallic acid (reference compound). It was
found that the antioxidant activity of flavan-3-ols isolated
from A. hydaspica decreased in the following sequence:
C1 > C2 (i.e., 7-O-gallate, 5′-OH > 3-OH, 5′-OH) which
is also in good agreement with previously reported data
[5]. It appears that as far as the antioxidant activity is
concerned, a galloyl group is essential for bioactivity
and additional insertion of the hydroxyl group at the 7′
position in the B ring also contributes to the scavenging
Afsar et al. Chemistry Central Journal (2018) 12:5
Page 8 of 13
C3
3
Fig. 2 Analytical HPLC chromatogram of C1, C2 and C3 showing single peaks at 10.487, 8.644 and 10.994 min, and compound structures. Chromatographic conditions: Vision Ht C18 column (5 μm; 10 × 250 mm, Agilent USA). Mobile phase A (Millipore H2O) and mobile phase B (acetonitrile)
in gradients: 0–5 min; 15% B in A (isocratic run), 5–27 min; 15–100% B (gradient mode), 27–32 min; 15% B in A (for column equilibration). Flow rate;
1 ml/min, injection volume 20 µl. All compounds showed UV maxima at 280 nm (characteristic of polyphenolic compounds). 7-O-galloyl catechin
(C1), catechin (C2), and methyl gallate (C3)
activities. Comparing the DPPH-scavenging activity of
flavan-3-ols (C1 and C2) proven that more phenol groups
are central to an intensification of antioxidant activity [5].
Hydroxyl radical‑scavenging activity
ROS constitute a major pathological factor causing
many serious diseases, including cancer and neurodegenerative disorders [32]. The generally formed ROS
are oxygen radicals, such as hydroxyl radicals and
superoxide, and non-free radicals, such as hydrogen
peroxide and singlet oxygen. The hydroxyl radical is
the most reactive and induces severe damage to adjacent biological molecules [33]. The hydroxyl radical
scavenging assay is based on ability of antioxidant to
inhibit the formation of the hydroxyl radicals, malondialdehyde (MDA) formation and to prevent the degradation of 2-deoxyribose. Result demonstrated that
all tested compounds inhibit hydroxyl radical generation in a dose dependent fashion. The respective EC50
values for isolated compounds C1, C2 and C3 were
4.33 ± 0.635, 8.00 ± 0.577 and 6.25 ± 0.618 μM respectively, exhibited greater potency to scavenge hydroxyl
radical then Gallic acid (EC50 9.67 ± 0.577 µM) (Fig. 3b,
Table 3). However none of tested compound showed
better scavenging potential than standard BHT (EC50
0.781 ± 0.115). To our knowledge, the abilities of the
compounds C2, and C3 to showed similar potency
to scavenge hydroxyl radical to reported in previous
Afsar et al. Chemistry Central Journal (2018) 12:5
Page 9 of 13
Fig. 3 a Dose dependent DPPH radical scavenging activity. Ascorbic acid and Gallic acid used as a standard reference. b Hydroxyl radical scavenging activity. Butylated hydroxytoluene (BHT) and gallic acid. c Dose dependent inhibition of RNS derived from nitric oxide by isolated compounds
(C1–C3) in comparison with standard reference Rutin. d Dose dependent increase in total antioxidant capacity (TAC) of isolated compounds. Gallic
acid used as standard reference. Values are expressed as mean ± SEM (n = 3). C1: 7-O-galloyl catechins, C2: catechins and C3: methyl gallate (C3)
studies [5]. From our results, it was also possible to
make a number of correlations regarding the relationships between the structures of isolated compounds and
their hydroxyl radical-scavenging activities. Methyl gallate (C3) seemed to augment the bioactivity of Gallic
acid (Reference compound). It was found that the antioxidant activities of flavan-3-ols decreased in the following sequence: C2 > C1 (i.e., 3-OH, 5′-OH > 7-O-gallate,
5′-OH). This suggests that a galloyl group and O-dihydroxy (i.e., catechol) is essential, and 5′-OH is not an
important group in antioxidant activity. Comparing
the hydroxyl radical-scavenging activities of isolated
compounds revealed that the bioactivity decreased
in the following sequence: C1 > C3 > C2. The results
suggest that carbonyl, O-dihydroxy and galloyl group
increased the hydroxyl radical scavenging activity.
Inhibition of RNS derived from nitric oxide
Nitric oxide a potent oxidizing radical leads to tissue damage in a number of pathological conditions in
humans and experimental animals [34]. Herein, isolated
compounds from A. hydaspica were examined for their
ability to protect against NO-dependent oxidation. Thus,
the NO radical-scavenging activities of these isolated
Afsar et al. Chemistry Central Journal (2018) 12:5
Page 10 of 13
Table 3 EC50 values (concentration causing 50% inhibition) in various antioxidant assays and FRAP potential of Acacia
hydaspica polyphenols
Compounds
DPPH radical
EC50 (µM)
Hydroxyl radical
EC50 (µM)
Nitric oxide
EC50 (µM)
C1
1.60 ± 0.035a
4.33 ± 0.618b
6 ± 0.346a
C2
b
FRAP
µM Fe(II)/g
% (dry weight of AHE extract)
649.5 ± 1.511a
18.75
Flavan-3ols
a
b
6.24 ± 0.254
8.0 ± 0.635
12.3 ± 0.376
432.9 ± 0.94b
10.01
2.9 ± 0.318a
6.25 ± 0.577a
7.67 ± 0.577a
505.5 ± 2.512c
3.75
Phenol compound
C3
Standard reference
BHT
–
Ascorbic acid
36.3 ± 0.569
Rutin
–
Gallic acid
9.1 ± 0.421
d
0.781 ± 0.115c
–
–
–
–
–
–
–
53 ± 1.155c
–
–
–
49.5 ± 2.211c
–
–
c
a,d
9.67 ± 0.577
Values are expressed as mean ± SEM (n = 3); means with superscript with different letters
analyzed by using one way ANOVA followed by Tukeys multiple comparison tests
compounds were investigated by examining the oxidation of sodium nitroprusside. Figure 3c shows that exposure of nitric oxide generated by sodium nitroprusside to
oxygen in the presence of the polyphenols isolated from
A. hydaspica resulted in a significant inhibition of nitrite
ion formation in a dose-dependent manner. The relative
EC50 values of compound C1, C2 and C3 against RNS
derived from nitric oxide are summarized in Table 3,
which ranged from 6 to 12.3 µM compared to that of
rutin (53.00 ± 1.155 µM). The bioactivity decrease in the
following order: GG > MG > C > rutin. The addition of
polyphenols significantly inhibited nitric oxide formation even at lower concentrations. Compounds at 25 µM
dose showed inhibitory activity, ranging from 85.817±,
83.023± to 72.864± % for MG, GC and C respectively
compared to rutin at same dose (39.845 ± 1.48%) as positive control. At a concentration of 100 μM, the scavenging activity of GC, C, and MG reached 97.34 ± 0.982%
(p < 0.001), 93.825 ± 1.5 (p < 0.001) and 96.823 ± 1.501%
(p < 0.01) respectively indicating significant difference
from standard reference rutin (83.163 ± 2.79). These
results reveal that the presence of hydroxyl and-carbonyl
group in the flavonoid skeleton resulted in high nitric
oxide inhibition of compounds. From these results, it was
also possible to make a number of correlations regarding the relationship between the structures of isolated
compounds and their NO radical-scavenging activities. Methyl gallate (C3) appeared to have enhanced the
bioactivity then Gallic acid. It appeared that as far as
the antioxidant activity was concerned, a galloyl group
was essential, while C3 showed greater bioactivity. It
was found that the antioxidant activities of flavan-3-ols
decreased in the following sequence: C1 > C2 (i.e.,
7-O-gallate, 5′-OH > 3-OH, 5′-OH). It is well known that
(a–d)
in the row are significantly (p < 0.01) different from each other. Data
nitric oxide has an important role in various inflammatory processes. Sustained levels of production of this
radical are directly toxic to tissues and contribute to the
vascular collapse associated with septic shock, whereas
chronic expression of nitric oxide radical is associated
with various carcinomas and inflammatory conditions
including juvenile diabetes, multiple sclerosis, arthritis,
and ulcerative colitis [35]. The present study showed that
GC, C and MG have good nitric oxide scavenging activity
then rutin and gallic acid.
Total antioxidant capacity (TAC)
Phosphomolybdenum assay principal follows the chemistry of conversion of Mo (VI) to Mo (V) by compounds
having antioxidant potential and resulting in the formation of green phosphate/Mo (V) having absorption maxima at 695 nm at acidic PH. TAC assay was used to assess
the capacity total antioxidant capacity of isolated compounds compared Gallic acid [36]. Isolated compounds
showed good antioxidant index. Total antioxidant capacity (TAC) of compounds increase with increasing concentration of compounds. TAC order of A. hydaspica
compounds TAC values were in following order; C1
(1.71 ± 0.040 µM) > C3 (1.54 ± 0.025 µM) > Gallic acid (1.39 ± 0.004) ~ C2 (1.379 ± 0.021) at 12.5 µM
dose (Fig. 3d). To the best of our knowledge literature is
scarce about the total antioxidant activity of 7-O-galloyl
catechin (C1) by phosphomolybedate method. C1 significantly reduce Mo (VI) to Mo (V) and form a green
colored complex of Mo (v) that gives absorbance at
695 nm. Antioxidant index of C2 is shown to be comparable with Gallic acid (p > 0.05), Methyl ester in C3
might responsible for significant (p < 0.01) enhancement
in TAC capacity as compared to standard Gallic acid.
Afsar et al. Chemistry Central Journal (2018) 12:5
From these results, it was also possible to make a number
of correlations regarding the relationship between the
structures of isolated compounds, their antioxidant activities and antioxidant index. The transfer of electron or
hydrogen depends on the structure of compounds. These
results reveal that the presence of hydroxyl and-carbonyl
group in the flavonoid skeleton resulted in enhancement of total antioxidant capacity and moreover antioxidant index tested polyphenol compounds isolated from
A. hydaspica correlated with the number of aromatic
hydroxyl groups in the antioxidant assays [37]. It was
found that the antioxidant index of isolated compounds
decreased in the following sequence: C1 > C3 > C2 (i.e.,
7-O-gallate, 5′-OH > 3-OH, 5′-OH). The present study
showed that C1, C2 and C3 have good TAC comparable
to Gallic acid.
FRAP assay
FRAP assay, based on the reduction of ferric tripyridyltriazine complex to its ferrous colored form. The antioxidant activities were measured three times to test
the reproducibility of the assays. The Frap assay which
measures the ability of isolated compounds to reduce
TPTZ-Fe(III) complex to TPTZ-Fe(II) was used to assess
the total reducing power of antioxidants [37]. when a
Fe3+-TPTZ complex is reduced by electron donating antioxidants under acidic conditions, change of absorbance
of colorless less F
e3+ to blue colored F
e2+ form was measured at 593 nm [7]. A higher value indicates higher ferric
reducing power. The addition of polyphenols significantly
reduces ferric ions to ferrous ions. Tested compounds
C1, C2 and C3 at 12.5 µM dose showed FRAP values of
649.50 ± 1.501, 432.90 ± 0.949 and 505.5 ± 2.500 (µM
Fe(II)/g) (Table 3). Results showed that 7-O-galloyl catechin (C1) has more significant (p < 0.001) FRAP values
than catechin (C2), methyl gallate (C3) and standard
reference Gallic acid at same dose; indicating significant
Page 11 of 13
electron donating capacity of C1 in comparison to C2,
C3 and Gallic acid. C2 was less potent then Gallic acid,
whereas methyl gallate (C3) showed bioactivity slightly
but non-significantly enhanced than Gallic acid. Methyl
gallate (C3) showed bioactivity slightly enhanced than
Gallic acid. From these results, it was also possible to
make a number of correlations regarding the relationship
between the structures of isolated compounds and their
FRAP activity. These results reveal that the presence of
hydroxyl and-carbonyl group in the flavonoid skeleton
resulted in high FRAP potential and reducing ability was
concerned the number of aromatic hydroxyl and galloyl
group. It was found that the antioxidant activities of isolated compounds decreased in the following sequence:
C1 > C3 > C2 (i.e., 7-O-gallate, 5′-OH > 3-OH, 5′-OH).
The present study showed that 7-O-galloyl catechin (C1),
catechin (C2) and methyl gallate (C3) have good FRAP
reducing potential comparable to Gallic acid.
Relationship between different antioxidant variables
Correlation analysis was used to explore the relationships amongst different antioxidant variables measured
for compounds. On the basis of simple regression testing,
correlation coefficients were calculated among antioxidant assays used in study. Significant linear relationship
or high correlation was observed between different
antioxidant assay i.e., TAC, FRAP, DPPH, OH and NO
radical scavenging assay (Table 4). These results could
explained that despite different hydrophilic properties
of the substratum used in the different methods, compounds showed a linear activity between different antioxidant assays.
Although catechin and methyl gallate were evaluated
previously for antioxidant potential by various methods [37]. Nevertheless, the present work provides more
information about these features, since five different antioxidant methods were used to analyze the antioxidant
Table 4 Relation between antioxidant activity measurements of 3 AH polyphenols using different methods to evaluate
the antioxidant activities of isolated compounds from Acacia hydaspica
DPPH·
NO·
OH·
DPPH·
NA
–
–
NO·
y = 1.3736x + 3.7351
R2 = 0.9993
NA
–
OH·
y = 0.7411x + 3.5321
R2 = 0.9301
y = 0.5354x + 1.5528
R2 = 0.9165
NA
TAC
y = − 0.0666x + 1.7807
R2 = 0.9264, p < 0.01
y = − 0.0481x + 1.9586
R2 = 0.9124
y = − 0.0901x + 2.0993
R2 = 0.9999
FRAP
y = − 41.969x + 680.02
R2 = 0.8271
y = − 30.177x + 790.87
R2 = 0.8073
y = − 59.277x + 896.42
R2 = 0.9742
NA indicates same assay no correlation done, Y indicates the regression equation, and R
2 shows the coefficient of correlation between assays mentioned. – Indicate
the same value. Regression analysis done by graph pad prism
Afsar et al. Chemistry Central Journal (2018) 12:5
capacity of these compounds in comparison with standards i.e., Ascorbic acid, gallic acid, BHT and rutin. In
A. hydaspica ethyl-acetate extract 7-O-galloyl catechin
appears to be the major antioxidant compound both in
term of yield and activity. These results are in good agreement with the previous report of Zhao et al. [38], which
showed that galloyl catechins contributes to the main
antioxidant capacity of tea.
Conclusion
Antioxidant screening of active compounds from unexplored species of Acacia genus pave the way for the
possible development of natural essences to substitute
synthetic ones. There for further investigation for the
isolation of compounds from other fractions and their
pharmacological evaluations are still required. Moreover
the isolation of catechin this new species could provide a
new opportunity to obtained catechin beside from green
tea. Acacia hydaspica provide a source of natural, significantly potent antioxidant constituents that might leads to
the prevention of ROS mediated diseases by scavenging
free radicals or preventing the oxidation of biomolecules.
Additional files
Additional file 1: Figure S1. ISCO chromatogram showing the peaks
of fractions. Arrows indicate the pooling of fractions which leads to pure
compounds.
Additional file 2: Figure S2. 1H-NMR spectrum of A. hydaspica
compounds.
Authors’ contributions
TA made significant contributions to conception, design, experimentation,
acquisition and interpretation of data and writing of manuscript. SR and MS
revised the manuscript for important intellectual content. MRK supervised the
study and reviewed the manuscript. All authors read and approved the final
manuscript.
Author details
1
Department of Biochemistry, Faculty of Biological Sciences, Quaid-i-Azam
University, Islamabad, Pakistan. 2 Department of Animal Sciences, Faculty of Biological Sciences, Quaid-i-Azam University, Islamabad, Pakistan.
3
Department of Community Health Sciences, College of Applied Medical
Sciences, King Saud University, Riyadh, Saudi Arabia. 4 Atta-ur-Rahman School
of Applied Biosciences, NUST, Islamabad, Pakistan.
Acknowledgements
We acknowledge Higher Education Commission (HEC) of Pakistan for awarding IRSP scholarship for PHD research to the first author. We acknowledge Dr.
Christine Salomon, Assistant Professor and Assistant Director Center for Drug
Design, University of Minnesota, Minneapolis, MN 55455 for their help in purification of compounds and NMR data interpretation for structure elucidation.
The authors would like to extend their sincere appreciation to the Deanship
of Scientific Research at King Saud University, KSA for its funding the research
group no (RGP- 193).
Competing interests
The authors declare that they have no competing interests.
Page 12 of 13
Availability of data and materials
All relevant data are within the paper and in supporting Additional information files.
Consent to publication
Not applicable.
Ethics approval and consent to participate
Not applicable.
Funding
The project was partially funded by the Higher Education Commission (HEC)
of Pakistan by awarding indigenous scholarship to the first author. We are
grateful to the Deanship of Scientific Research, College of Applied Medical
Sciences Research Center at King Saud University.
Publisher’s Note
Springer Nature remains neutral with regard to jurisdictional claims in published maps and institutional affiliations.
Received: 19 October 2017 Accepted: 8 January 2018
References
1. Sasidharan S, Chen Y, Saravanan D, Sundram K, Latha LY (2011) Extraction,
isolation and characterization of bioactive compounds from plants’
extracts. Afr J Tradit Complement Altern Med 8(1):1–10
2. Mendonça-Filho RR (2006) Bioactive phytocompounds: new approaches
in the phytosciences. In: Ahmad I, Aqil F, Owais M (eds) Modern phytomedicine: turning medicinal plants into drugs. Wiley, Weinheim
3. Shahidi F, Janitha P, Wanasundara P (1992) Phenolic antioxidants. Crit Rev
Food Sci Nutr 32(1):67–103
4. Sak K (2012) Chemotherapy and dietary phytochemical agents. Chemother Res Pract 2012:282570
5. Hsu F-L, Huang W-J, Wu T-H, Lee M-H, Chen L-C, Lu H-J, Hou W-C, Lin M-H
(2012) Evaluation of antioxidant and free radical scavenging capacities
of polyphenolics from pods of Caesalpinia pulcherrima. Int J Mol Sci
13(5):6073–6088
6. Shah NA, Khan MR, Naz K, Khan MA (2014) Antioxidant potential, DNA
protection, and HPLC-DAD analysis of neglected medicinal Jurinea dolomiaea roots. Biomed Res Int 2014:726241
7. Benzie IF, Strain J (1996) The ferric reducing ability of plasma (FRAP)
as a measure of “antioxidant power”: the FRAP assay. Anal Biochem
239(1):70–76
8. Aruoma OI (2003) Methodological considerations for characterizing
potential antioxidant actions of bioactive components in plant foods.
Mutat Res Fundam Mol Mech Mutagen 523:9–20
9. Singh BN, Singh B, Singh R, Prakash D, Sarma B, Singh H (2009) Antioxidant and anti-quorum sensing activities of green pod of Acacia nilotica L.
Food Chem Toxicol 47(4):778–786
10. Clement BA, Goff CM, Forbes TDA (1997) Toxic amines and alkaloids from
Acacia berlandieri. Phytochemistry 46(2):249–254
11. Haridas V, Higuchi M, Jayatilake GS, Bailey D, Mujoo K, Blake ME, Arntzen
CJ, Gutterman JU (2001) Avicins: triterpenoid saponins from Acacia victoriae (Bentham) induce apoptosis by mitochondrial perturbation. Proc
Natl Acad Sci 98(10):5821–5826
12. Readel K, Seigler D, Hwang K, Keesy J, Seilheimer S (2001) Tannins from
mimosoid legumes of Texas and Mexico. Econ Bot 55(2):212–222
13. Seigler DS (2003) Phytochemistry of Acacia—sensu lato. Biochem Syst
Ecol 31(8):845–873
14. Singh R, Singh S, Kumar S, Arora S (2007) Evaluation of antioxidant potential of ethyl acetate extract/fractions of Acacia auriculiformis A. Cunn.
Food Chem Toxicol 45(7):1216–1223
15. Zargari A (1997) Iranian medicinal plants. Tehran University Publications,
Tehran
Afsar et al. Chemistry Central Journal (2018) 12:5
16. Afsar T, Khan MR, Razak S, Ullah S, Mirza B (2015) Antipyretic, antiinflammatory and analgesic activity of Acacia hydaspica R. Parker and its
phytochemical analysis. BMC Complement Altern Med 15:136
17. Afsar T, Razak S, Khan MR, Almajwal A (2017) Anti-depressant and anxiolytic potential of Acacia hydaspica R. Parker aerial parts extract: modulation of brain antioxidant enzyme status. BMC Complement Altern Med
17(1):228
18. Afsar T, Razak S, Khan MR, Mawash S, Almajwal A, Shabir M, Haq IU (2016)
Evaluation of antioxidant, anti-hemolytic and anticancer activity of
various solvent extracts of Acacia hydaspica R. Parker aerial parts. BMC
Complement Altern Med 16(1):258
19. Afsar T, Trembley JH, Salomon CE, Razak S, Khan MR, Ahmed K (2016)
Growth inhibition and apoptosis in cancer cells induced by polyphenolic
compounds of Acacia hydaspica: involvement of multiple signal transduction pathways. Sci Rep 6:23077
20. Brand-Williams W, Cuvelier ME, Berset CLWT (1995) Use of a free
radical method to evaluate antioxidant activity. LWT-Food Sci Technol
28(1):25–30
21. Gutteridge J, Halliwell B (2000) Free radicals and antioxidants in the year
2000: a historical look to the future. Ann N Y Acad Sci 899(1):136–147
22. Rao M (1997) Nitric oxide scavenging by curcuminoids. J Pharm Pharmacol 49(1):105–107
23. Malan E, Pienaar DH (1987) (+)-catechin-galloyl esters from the bark of
Acacia gerrardii. Phytochemistry 26(7):2049–2051
24. El-toumy SA, Mohamed SM, Hassan EM, Mossa A-TH (2011) Phenolic
metabolites from Acacia nilotica flowers and evaluation of its free radical
scavenging activity. J Am Sci. 7(3):287–295
25. Kane CJ, Menna JH, Yeh Y-C (1988) Methyl gallate, methyl-3, 4,
5-trihydroxy-benzoate, is a potent and highly specific inhibitor of herpes
simplex virusin vitro. I. Purification and characterization of methyl gallate
from Sapium sebiferum. Biosci Rep 8(1):85–94
26. Tanaka T, Nonaka G-I, Nishioka I (1983) 7-O-galloyl-(+)-catechin and
3-O-galloylprocyanidin B-3 from Sanguisorba officinalis. Phytochemistry
22(11):2575–2578
Page 13 of 13
27. Shen C-C, Chang Y-S, Hott L-K (1993) Nuclear magnetic resonance studies
of 5, 7-dihydroxyflavonoids. Phytochemistry 34(3):843–845
28. Davis AL, Cai Y, Davies AP, Lewis J (1996) 1H and 13C NMR assignments of
some green tea polyphenols. Magn Reson Chem 34(11):887–890
29. Bokhari J, Khan MR, Shabbir M, Rashid U, Jan S, Zai JA (2013) Evaluation of
diverse antioxidant activities of Galium aparine. Spectrochim Acta Part A
Mol Biomol Spectrosc 102:24–29
30. Yokozawa T, Chen CP, Dong E, Tanaka T, Nonaka G-I, Nishioka I (1998)
Study on the inhibitory effect of tannins and flavonoids against the 1,
1-diphenyl-2-picrylhydrazyl radical. Biochem Pharmacol 56(2):213–222
31. Pfundstein B, El Desouky SK, Hull WE, Haubner R, Erben G, Owen RW
(2010) Polyphenolic compounds in the fruits of Egyptian medicinal plants
(Terminalia bellerica, Terminalia chebula and Terminalia horrida): characterization, quantitation and determination of antioxidant capacities.
Phytochemistry 71(10):1132–1148
32. Zlokovic BV (2011) Neurovascular pathways to neurodegeneration in
Alzheimer’s disease and other disorders. Nat Rev Neurosci 12(12):723–738
33. Ak T, Gülçin İ (2008) Antioxidant and radical scavenging properties of
curcumin. Chem Biol Interact 174(1):27–37
34. Valko M, Leibfritz D, Moncol J, Cronin MT, Mazur M, Telser J (2007) Free
radicals and antioxidants in normal physiological functions and human
disease. Int J Biochem Cell Biol 39(1):44–84
35. Kanwar JR, Kanwar RK, Burrow H, Baratchi S (2009) Recent advances on
the roles of NO in cancer and chronic inflammatory disorders. Curr Med
Chem 16(19):2373–2394
36. Lohr KN (ed) (1990) Breast cancer: setting priorities for effectiveness
research. National Academy Press, Washington (DC)
37. Muselík J, García-Alonso M, Martín-López MP, Žemlička M, Rivas-Gonzalo
JC (2007) Measurement of antioxidant activity of wine catechins, procyanidins, anthocyanins and pyranoanthocyanins. Int J Mol Sci 8(8):797–809
38. Zhao C, Li C, Liu S, Yang L (2014) The galloyl catechins contributing to
main antioxidant capacity of tea made from Camellia sinensis in China. Sci
World J 2014:863984