Optimal partner wavelength combination method applied to NIR spectroscopic analysis of human serum globulin
Bạn đang xem bản rút gọn của tài liệu. Xem và tải ngay bản đầy đủ của tài liệu tại đây (1.35 MB, 7 trang )
BMC Chemistry
(2020) 14:37
Han et al. BMC Chemistry
/>
Open Access
RESEARCH ARTICLE
Optimal partner wavelength combination
method applied to NIR spectroscopic analysis
of human serum globulin
Yun Han1, Yun Zhong2, Huihui Zhou1 and Xuesong Kuang1*
Abstract
Human serum globulin (GLB), which contains various antibodies in healthy human serum, is of great significance for
clinical trials and disease diagnosis. In this study, the GLB in human serum was rapidly analyzed by near infrared (NIR)
spectroscopy without chemical reagents. Optimal partner wavelength combination (OPWC) method was employed
for selecting discrete information wavelength. For the OPWC, the redundant wavelengths were removed by repeated
projection iteration based on binary linear regression, and the result converged to stable number of wavelengths. By
the way, the convergence of algorithm was proved theoretically. Moving window partial least squares (MW-PLS) and
Monte Carlo uninformative variable elimination PLS (MC-UVE-PLS) methods, which are two well-performed wavelength selection methods, were also performed for comparison. The optimal models were obtained by the three
methods, and the corresponding root-mean-square error of cross validation and correlation coefficient of prediction
(SECV, RP,CV) were 0.813 g L−1 and 0.978 with OPWC combined with PLS (OPWC-PLS), and 0.804 g L−1 and 0.979 with
MW-PLS, and 1.153 g L −1 and 0.948 with MC-UVE-PLS, respectively. The OPWC-PLS and MW-PLS methods achieved
almost the same good results. However, the OPWC only contained 28 wavelengths, so it had obvious lower model
complexity. Thus it can be seen that the OPWC-PLS has great prediction performance for GLB and its algorithm is
convergent and rapid. The results provide important technical support for the rapid detection of serum.
Keywords: Optimal partner wavelength combination, Near-infrared spectroscopy, Human serum globulin
Introduction
Near infrared (NIR) spectroscopy is a green and developing analytical technique, which has been widely used in
life sciences [1–7], agricultural products and food [8–11],
soil [12–14], and other fields [15, 16]. For NIR spectroscopic analysis of complex system, wavelength selection
is necessary and difficult. So far, many methods including
continuous mode and discrete mode of wavelength selection have been successfully used in NIR spectroscopy
analysis, but a general and effective method has not been
found. Moving window partial least squares (MW-PLS)
*Correspondence: ;
1
Department of Data Science, Guangdong Ocean University, Haida Road
1, Mazhang District, Zhanjiang 524088, China
Full list of author information is available at the end of the article
is a widely used and well performed wavelength selection
method, which uses a moving window whose position
and size can be changed to identify and select continuous wavebands in terms of the prediction effect, and such
waveband can correspond to absorption of specific functional groups [13, 15, 16]. This method can achieve high
prediction effect on most spectral data sets, so it often
presents as the comparison method of new method to
evaluate the performance of the new method. However, it
can be seen from the papers [16–18], as a traversal algorithm for continuous wavebands, all possible continuous
bands are screened, this method is time-consuming when
encountering a large dataset. Monte Carlo uninformative
variable elimination by PLS (MC-UVE-PLS) is a popular method for discrete wavelength selection [19], which
creatively introduced noise to eliminate uninformative
© The Author(s) 2020. This article is licensed under a Creative Commons Attribution 4.0 International License, which permits use, sharing,
adaptation, distribution and reproduction in any medium or format, as long as you give appropriate credit to the original author(s) and
the source, provide a link to the Creative Commons licence, and indicate if changes were made. The images or other third party material
in this article are included in the article’s Creative Commons licence, unless indicated otherwise in a credit line to the material. If material
is not included in the article’s Creative Commons licence and your intended use is not permitted by statutory regulation or exceeds
the permitted use, you will need to obtain permission directly from the copyright holder. To view a copy of this licence, visit The Creative Commons Public Domain Dedication waiver ( applies to the data made available in this article, unless otherwise stated in a credit line to the data.
Han et al. BMC Chemistry
(2020) 14:37
variables, but it cannot achieve satisfactory prediction
results for some data sets.
Serum globulin (GLB), which is synthesized by
human monocyte-phagocyte system, contains various
antibodies in the serum of healthy people, so it can
enhance the body’s resistance to prevent infection. It is
mainly used for immunodeficiency diseases as well as
prevention and treatment of viral infections and bacterial infections such as infectious hepatitis, measles,
chickenpox, mumps and herpes zoster. In addition, it
can also be used in asthma, allergic rhinitis, eczema
and other endogenous allergic diseases. Therefore,
the GLB in human serum is very important for clinical trials and disease diagnosis. In previous studies [20,
21], FTIR/ATR spectroscopy was used for determination of GLB. The study found that for blood index, the
NIR has higher quantitative analysis accuracy than
the FTIR/ATR spectroscopy [6, 22]. The experimental results show that the molecular absorption information of GLB can be captured by NIR spectroscopy
without reagent.
Optimal partner wavelength combination (OPWC) is a
method of selecting discrete information wavelength by
iteration. For the method, the best partner of each wavelength in a predetermined wavelength region was determined based on binary linear regression (BLR), and a
partner wavelength subset (PWS) was obtained; then the
best partner of each wavelength in the PWS was obtained
with the same method. The iterative process may be continued until convergence was met, and the last obtained
wavelength subset was called OPWC. On the basis of the
OPWC, PLS model was established. In order to make full
use of the samples, the leave-one-out cross validation
(LOOCV) was adopted.
Because human serum is a complex multi-component
system and the absorption interference of other components is very complex, it is difficult to extract the characteristic information of GLB. Therefore, OPWC-PLS
method was employed to remove redundant wavelength
and establish a high precision quantitative model. MWPLS and MC-UVE-PLS methods were also performed
for comparison. Experimental results showed that the
OPWC-PLS has great prediction performance and the
algorithm is convergent and rapid.
Page 2 of 7
informed consent. The study protocol was performed in
accordance with relevant laws and institutional guidelines and was approved by local medical institutions and
ethics committee. The obtained results were used as reference values in NIR spectroscopy analysis. The statistical analysis of the measured GLB values of 230 samples is
given in Table 1.
The spectroscopy instrument was an XDS Rapid Content™ Liquid Grating Spectrometer (FOSS, Denmark)
equipped with a transmission accessory and a 2 mm
cuvette. The spectral scanning range was 780-2498 nm
with a 2 nm wavelength gap; the detector were Si (780–
1100 nm) and Pbs (1100–2498 nm). The temperature
and relative humidity of the laboratory were 25 ± 1 °C
and 46 ± 1% RH, respectively. Each sample was measured
three times, and the mean value of the three measurements was used for modeling.
Modeling process
Leave-one-out cross validation (LOOCV) is commonly
used as the object function for model selection, which
aims to make full use of the samples information. In
this study, LOOCV was conducted for modeling process, as described below. Only one sample was left out
from modeling samples for the prediction, and the other
samples were used as calibration set. This process was
repeated until the prediction value of every modeling
sample was obtained. The measured and predicted values of ith sample in modeling set were denoted as CM, i ,
C˜ M, i , i = 1, 2, . . . , nM ,nM was the number of modeling
samples. For all samples, the mean measured value was
denoted as CM, Ave , and the mean predicted value was
denoted as C˜ M, Ave . The prediction accuracy was evaluated by the root-mean-square errors of cross validation
and the predicted correlation coefficients, and denoted
as SECV and RP,CV, respectively. The calculation formulas
were as the follows:
SECV =
RP, CV =
nM ˜
i=1 (CM, i
− CM, i )2
nM
(1)
,
nM
i=1 (CM, i
− CM,
Ave )(CM, i
nM
i=1 (CM, i
− CM,
2 ˜
Ave ) (CM, i
˜
− C˜ M,
Ave )
− C˜ M,
2
Ave )
(2)
Materials and methods
Experiment
A total of 230 human serum samples were collected in
this experiment and their GLB values were determined
using routine clinical biochemical tests. This work was
supported by Youth Innovation Talents Project of Colleges and Universities in Guangdong Province (No.
Q18285), and all individual participants provided written
Table 1 Statistical analysis of measured GLB values of 230
samples
Indicator
−1
GLB(g L )
Number
Min
Max
Mean
SD
230
18.70
41.60
27.477
3.953
Han et al. BMC Chemistry
(2020) 14:37
The model parameters were selected to achieve minimum SECV.
Page 3 of 7
identified and denoted as f ( i ) based on minimum
SECV( i , k ) . The formula is as follows,
SECV( i , f ( i )) =
MW‑PLS method
MW-PLS is a time-tested and popular method for
screening continuous wavebands. This method uses several continuous wavelengths as a window, the size and
position of which can be changed, and the PLS models
are established for all possible windows in a predetermined search region of the spectrum. The information
waveband was selected according to the minimum SECV.
In this study, the search range of the MW-PLS was
full spectrum region (780–2498 nm) with 860 wavelengths, and the initial wavelength (I) and number of
wavelengths (N) of window as well as the number of
PLS factors (F) were set as I ∈ {780, 782, . . . , 2498} ,
N ∈ {1, 2, . . . , 200} ∪ {210, 220, . . . , 860} ,
and
F ∈ {1, 2, . . . , 20} . The LOOCV for PLS models was performed in each combination of (I, N, F), and the corresponding SECV and RP,CV were calculated. The optimal
waveband with minimum SECV was selected to achieve
the best prediction accuracy.
MC‑UVE‑PLS method
min
k=1,2,··· ,N
k� =i
SECV( i ,
k)
The f (�) was partner wavelength subset (PWS(1)) of ,
and its number of wavelengths was denoted by N(1). Theoretically, the best partner f ( i ) for each wavelength i is
unique, but several different wavelengths may have the
same best partner. If some was not a best partner of any
/ PWS(1), and N(1) < N.
wavelength, then ∈
Step 2 According to the projection f defined above, the
partner wavelength subset (PWS(2)) of PWS(1) could be
obtained. It will be proved later that PWS converges to
stable number of wavelengths after finite projection iterations. Suppose that PWS converges after s-times iterations, N(s) = N(s+1). And the P
WS(s) was called optimal
partner wavelength combination (OPWC). For OPWC,
each wavelength was the best partner of some other
wavelength.
The proof of convergence of algorithm
Proof (1) If ∀ i, j, i � = j, i � = j , f ( i ) = f ( j ) , then the
projection f is a one-to-one mapping function defined
on , f (�) = � , i.e. the PWS stop shrinking after this
projection.
MC-UVE-PLS is a representative method for screening discrete wavelengths. For the method, lots of models are established with randomly selected calibration
samples, then the coefficient stability of these models
is calculated, and each variable is evaluated with the
stability of the corresponding coefficient [19]. In this
study, MC-UVE method was performed based on the
full spectrum region, and Monte Carlo sampling operation 500 times. The number of variables was determined
using the method in Ref. [19]. MC-UVE-PLS was rerun
for 50 times and the best result was recorded for further analysis. The number of PLS factors F was set to be
F ∈ {1, 2, . . . , 30}.
(2) If ∃ i, j, i � = j, i � = j , f ( i ) = f ( j ) , then f (�) is a
proper subset of , which is set as f (�) = f ( i )| i ∈ � }
(1) (1)
(1)
= { 1 , 1 , . . . N (1) , N(1) < N. Next further consider the
OPWC‑PLS method
=
Based on BLR, the best partner of each wavelength was
screened for entire scanning region and a partner wavelength subset (PWS) is determined. Then, a new PWS
of all wavelengths in the PWS are also determined
according to above obtained correspondence. The same
procedure was performed repeatedly until the results
converged to optimal partner wavelength combination
(OPWC). The specific steps are as follows:
Step 1 Assume that there are N wavelengths in the wavelength screening area , namely, � = { 1 , 2 , . . . , N } .
For any fixed i ∈ , and ∀ k ∈ , k � = i , LOOCV was
performed based on binary linear regression of wavelength combination ( i , k ) . The best partner of i was
Similarly considered the projection of f (s−1) (�) ,
(s−1)
(s−1)
i.e. f (s) (�) : (a) If ∀ i, j, i �= j, (s−1)
, f ( (s−1)
) ,
�= j
) �= f ( j
i
i
then the function f is a one-to-one mapping defined on
the f (s−1) (�) , f (s) (�) = f (s−1) (�)
, i.e. the PWS stop
shrinking after this projection. (b) If ∃ i, j, i �= j, i(s−1) �= j(s−1) ,
f ( (s−1)
) = f ( (s−1)
), then f (s) (�) is a proper subset of
i
j
(s−1)
(s−1)
f
(�) , which is set as f (s) (�) = {f ( (s−1)
∈ f (s−1) (�) }
) i
i
(s) (s)
(s)
(s)
(s−1)
= { 1 , 2 , . . . , N (s) },N < N
< · · · < N . Because
the total number of wavelengths (N) is limited, the number of projections needed is limited.
(1)
projection of f (�) , i.e. f (2) (�) : (a) If ∀ i, j, i �= j, (1)
i � = j ,
(1)
(1)
f ( i ) = f ( j ) , then function f is a one-to-one mapping defined on the f (�) , f (2) (�) = f (�) , i.e. the PWS
stop shrinking after this projection. b) If ∃ i, j, i � = j,
(1)
(1)
(1)
(1)
(2) (�) is a proper subset
i = j , f ( i ) = f ( j ), then f
(1)
(1)
of f (�) , which is set as f (2) (�) = f ( i ) i ∈ f (�)
(2)
1 ,
(2)
2 ,
...,
(2)
N (2)
, N(2) < N(1) < N.
Han et al. BMC Chemistry
(2020) 14:37
In this study, the wavelength screening region for GLB
spanned the entire scanning region (780–2498 nm), i.e.
� = {780, 782, . . . , 2498}
, with 860 wavelengths. The
number of PLS factors F was set to F ∈ {1, 2, . . . , 20}.
The computer algorithms for the three methods discussed above were designed using MATLAB version 7.6.
Results and discussion
Results with MW‑PLS
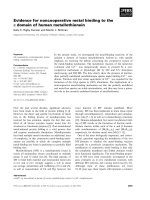
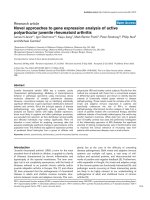
The NIR spectra of 230 human serum samples in the
scanning area (780–2498 nm) were shown in Fig. 1. As
can be seen from the figure, absorption at about 2000 nm
and 2400 nm has obviously strong noise. In order to
obtain satisfactory results, wavelength selection must
be carried out to overcome noise interference. For comparison, PLS model of the full spectrum region was first
established. The corresponding SECV and
RP,CV were
1.423 g L−1 and 0.935, respectively.
MW-PLS method was performed to optimize waveband and improve prediction accuracy. Depending on
minimum SECV value, the optimal MW-PLS model
was selected out. The corresponding waveband was
1504 to 1820 nm, located in the long-NIR region (1100
to 2498 nm). Prediction effects (SECV and R
P,CV) and
parameters of the above two methods were summarized
in Table 2. The results showed that the predicted values
were highly correlated with clinical measurements for the
two methods, and comparing with optimal PLS model
Fig. 1 NIR spectra of 230 human serum samples in the scanning area
(780–2498 nm)
Page 4 of 7
in full spectrum region, the optimal MW-PLS model
achieved better prediction effect with fewer wavelengths.
Results with MC‑UVE‑PLS
The MC-UVE method was performed for eliminating the
uninformative variables. Based on the parameter settings
in section “MC-UVE-PLS method”, 180 wavelengths were
selected, and the SECV and RP,CV for the corresponding PLS models were 1.153 g L−1 and 0.948, respectively.
Compared with the result of PLS in the full spectrum
range, the prediction ability of this method was not significantly improved, which may be because it only eliminates non information variables without considering the
influence of interference variables, while serum is a complex system with multiple interference variables.
Results with OPWC‑PLS
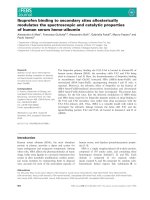
The OPWC method was performed for screening information wavelength based on the steps mentioned in section “OPWC-PLS method”. Firstly, 104 best partners for
all 860 wavelengths were determined according to the
results of LOOCV-BLR analysis, and P
WS(1) with 104
wavelengths was obtained. Thus, the number of wavelengths was greatly reduced after the first projection. The
correspondence between all 860 wavelengths and their
best partners was shown in Fig. 2. As shown in the figure, some wavelengths had the same best partner, such
as the 2156 nm and 2190 nm as best partners of other
wavelengths appeared 3 and 8 times, respectively, so
Fig. 2 Best partners of 860 wavelengths in the full spectrum region
Table 2 Prediction effects of three methods
Methods
Adopted wavelengths (nm)
N
F
SECV
RP,CV
PLS
780–2498
860
15
1.423
0.935
MW-PLS
1504–1820
159
10
0.804
0.979
OPWC-PLS
1410, 1534, 1536, 1538, 1542, 1676, 1678, 1698, 1732, 1734, 1738, 1742, 1744,
1746, 1750, 1870, 2128, 2132, 2218, 2220, 2222, 2228, 2254, 2258, 2306, 2310,
2318, 2340
28
7
0.813
0.978
Han et al. BMC Chemistry
(2020) 14:37
projection f was not a one-to-one mapping function in
the whole spectral region . Obviously, f (�) was a subset of and the projection continues.
Based on the corresponding relationship determined
(1)
above, the best partner of i was easy to be selected,
(2)
and the PWS was obtained. Repeated the same process
for PWS(2), and P
WS(3) was obtained. As the projection
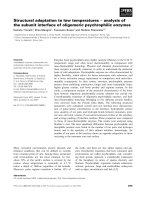
progresses, the number of wavelengths decreased gradually until the number of wavelengths for PWS(6) no longer
changed. The PWS(6) was the OPWC and it had only 28
wavelengths. Figure 3 showed the 28 wavelengths and
their best partners. As the figure showed, the 28 wavelengths are divided into 14 groups, and the two wavelengths in each group are the best partners for each other.
Based on PLS, the LOOCVs were performed for every
PWS, and the corresponding minimum SECV value and
number of wavelengths (N(s)) used are shown in Fig. 4. As
shown in the figure, the N(s) and minimum SECV values
have almost the same trend. After the first projection,
both of them decrease rapidly, and the remaining wavelengths are more important, so as the number of projections increases, they slowly decrease. This may be due to
the removal of a large amount of noise and background
information from the original spectrum after the first
projection, so both the N(s) and minimum SECV values
decrease rapidly. The partner wavelength subset of the
original spectrum contains less redundant information,
so the N(s) and minimum SECV values decrease slowly in
the later projection iteration.
Comparison of OPWC‑PLS and MW‑PLS methods
Screening the information wavelengths of GLB in the
human serum of a multi-component complex system is
difficult and complicated. The wavelengths selected by
the OPWC-PLS and MW-PLS methods, which correspond to the information of GLB, were shown in Fig. 5.
As indicated in Fig. 5, the wavelengths selected by the
OPWC method have a wider distribution range and
Fig. 3 Best partners of the selected 28 wavelengths
Page 5 of 7
Fig. 4 Number of wavelengths and minimum SECV value for each
projection
partially coincides with the wavelengths selected by
MW-PLS. This may be because the local characteristics
of MW-PLS method make some wavelengths cannot be
detected, which reflects the complexity of NIR model
optimization and the commonness and difference of different methods.
Figure 6 showed the relationship between the predicted
and measured GLB values based on the MW-PLS and
OPWC-PLS methods, respectively. The prediction effect
and corresponding parameters N and F were summarized
in Table 2. The SECV and RP,CV were 0.813 g L−1 and
0.978 with OPWC-PLS, and 0.804 g L−1 and 0.979 with
MW-PLS, respectively. The results show that, like MWPLS, the prediction effect of OPWC-PLS was also obviously better than that of the whole spectrum PLS, and the
OPWC is an effective method for screening wavelengths.
The phenomenon conveys that better prediction results
can be achieved with fewer wavelengths. Thus one can
conclude that it is very necessary to first perform wavelength selection before building a calibration model.
The two methods had achieved almost the same good
Fig. 5 Position of the selected wavelengths with MW-PLS and
OPWC-PLS located the average spectrum
Han et al. BMC Chemistry
(2020) 14:37
Page 6 of 7
were also employed for comparison. The results indicate that, OPWC-PLS and MW-PLS methods achieved
satisfactory prediction results, while the MC-UVEPLS method was not suitable for the data set of this
study, and the prediction effect of the model is not significantly improved. The optimal OPWC-PLS model
adopted 28 wavelengths, and corresponding SECV and
RP,CV were 0.813 g L
−1 and 0.978, respectively. The optimal MW-PLS model adopted 159 wavelengths, and corresponding SECV and RP,CV were 0.804 g L
−1 and 0.979,
respectively. The OPWC-PLS achieved almost the same
prediction effect as MW-PLS with faster speed and
fewer wavelengths. Therefore, OPWC is an efficient
approach for information wavelength selection.
The predicted GLB values obtained by MW-PLS and
OPWC-PLS were highly correlated with the reference
values. Compared with traditional method, the method
based on NIR spectroscopy has the merits of rapidity, simplicity and no chemical reagent. Therefore, the
results have important reference value for the rapid
determination of GLB. In addition, the wavelengths
selected by the two methods are partially the same,
reflecting the commonness and difference of different
methods.
Fig. 6 Relationship between the predicted values and measured
values of GLB based on a MW-PLS and b OPWC-PLS methods
prediction results (SECV and RP,CV). However, the optimal OPWC-PLS model adopted only 28 wavelengths,
while the other adopted 159 wavelengths. Therefore, the
OPWC method has great prediction performance for
wavelength selection.
The differences in prediction of the OPWC-PLS and
MW-PLS methods for GLB illustrate that MW-PLS can
achieve higher prediction accuracy, but it is time-consuming and employs more wavelengths, while OPWCPLS can achieve similar prediction results with MW-PLS
in less time. In addition, MW-PLS, as a continuous wavelength screening method, is more suitable for determining the object with relatively concentrated molecular
absorption bands; while OPWC-PLS, as a discrete wavelength screening method, may be more suitable for determining the object with relatively fragmented molecular
absorption bands.
Conclusion
The change of GLB content in human serum has
important reference value for clinical trial and disease diagnosis. In this study, the OPWC-PLS method
was employed for rapid analysis of GLB based on NIR
spectroscopy. MW-PLS and MC-UVE-PLS methods
Abbreviations
GLB: Globulin; NIR: Near infrared; OPWC: Optimal partner wavelength combination; MW-PLS: Moving window partial least squares; MC-UVE: Monte Carlo
uninformative variable elimination; SECV: Root-mean-square error of cross
validation of prediction; RP,CV: Correlation coefficient of prediction; BLR: Binary
linear regression; PWS: Partner wavelength subset; LOOCV: Leave-one-out
cross validation; SD: Standard deviation.
Acknowledgements
Not applicable.
Authors’ contributions
YH analyzed the spectral data of human serum samples and optimized the
wavelength model, and was a major contributor in writing the manuscript. YZ
and HZ carried out the spectrum experiment. XK performed model validation.
All authors read and approved the final manuscript.
Funding
This work was supported by Youth Innovation Talents Project of Colleges and
Universities in Guangdong Province (No. Q18285) and Guangdong Ocean
University Scientific Research Start-up Funding for the Doctoral Program (No.
R17057).
Availability of data and materials
The datasets used and/or analysed during the current study are available from
the corresponding author on reasonable request.
Consent statement
This study was approved by Experimental Animal Management Committee of
Guangdong Ocean University, and every individual participant provided written informed consent. All individual participants were voluntary and their all
information is confidential. The study protocol was performed in accordance
with relevant laws and institutional guidelines.
Competing interests
The authors declare that they have no competing interests.
Han et al. BMC Chemistry
(2020) 14:37
Author details
1
Department of Data Science, Guangdong Ocean University, Haida Road 1,
Mazhang District, Zhanjiang 524088, China. 2 Zhanjiang No. 2 High School Hai
Dong, Potou District, Zhanjiang 524057, China.
Received: 24 December 2019 Accepted: 16 May 2020
References
1. Chen JM, Peng LJ, Han Y et al (2018) A rapid quantification method for
the screening indicator for β-thalassemia with near-infrared spectroscopy. Spectrochim Acta A. 193:499–506
2. Han Y, Pan T, Zhou HH, Yuan R (2018) ATR-FTIR spectroscopy with
equidistant combination PLS method applied for rapid determination of
glycated hemoglobin. Anal Methods 10:3455–3461
3. Yao LJ, Tang Y, Yin ZW et al (2017) Repetition rate priority combination
method based on equidistant wavelengths screening with application to
NIR analysis of serum albumin. Chemom Inte Lab Syst. 162:191–196
4. Han Y, Chen JM, Pan T, Liu GS (2015) Determination of glycated hemoglobin using near-infrared spectroscopy combined with equidistant
combination partial least squares. Chemom Intell Lab Syst. 145:84–92
5. Lee Y, Lee S, In JY et al (2008) Prediction of plasma hemoglobin concentration by near-infrared spectroscopy. J Korean Med Sci 23:674–677
6. Pan T, Liu JM, Chen JM et al (2013) Rapid determination of preliminary
thalassaemia screening indicators based on near-infrared spectroscopy
with wavelength selection stability. Anal Methods 5(17):4355–4362
7. Yao LJ, Lyu N, Chen JM et al (2016) Joint analyses model for total cholesterol and triglyceride in human serum with near-infrared spectroscopy.
Spectrochim Acta A. 159:53–59
8. Lyu N, Chen JM, Pan T et al (2016) Near-infrared spectroscopy combined
with equidistant combination partial least squares applied to multi-index
analysis of corn. Infrared Phys Technol 76:648–654
9. Guo HS, Chen JM, Pan T et al (2014) Vis-NIR wavelength selection for
non-destructive discriminant analysis of breed screening of transgenic
sugarcane. Anal Methods 6(10):8810–8816
10. Chen JY, Iyo C, Kawano S (2002) Effect of multiplicative scatter correction
on wavelength selection for near infrared calibration to determine fat
content in raw milk. J Near Infrared Spec. 10(4):301–307
11. Liu ZY, Liu B, Pan T et al (2013) Determination of amino acid nitrogen in
tuber mustard using near-infrared spectroscopy with waveband selection stability. Spectrochim Acta A. 102:269–274
Page 7 of 7
12. Pan T, Li MM, Chen JM (2014) Selection method of quasi-continuous
wavelength combination with applications to the near-infrared spectroscopic analysis of soil organic matter. Appl Spectrosc 68(3):263–271
13. Pan T, Han Y, Chen JM et al (2016) Optimal partner wavelength combination method with application to near-infrared spectroscopic analysis.
Chemom Intell Lab Syst. 156:217–223
14. Chen JM, Pan T, Liu GS et al (2014) Selection of stable equivalent wavebands for near-infrared spectroscopic analysis of total nitrogen in soil. J
Innov Opt Health Sci. 7(4):1–9
15. Pan T, Chen ZH, Chen JM et al (2012) Near-infrared spectroscopy with
waveband selection stability for the determination of COD in sugar
refinery wastewater. Anal Methods 4(4):1046–1052
16. Li HD, Liang YZ, Xu QS et al (2009) Key wavelengths screening using
competitive adaptive reweighted sampling method for multivariate
calibration. Ana Chim Acta 648:77–84
17. Jiang JH, Berry RJ, Siesler HW et al (2002) Wavelength interval selection
in multicomponent spectral analysis by moving window partial leastsquares regression with applications to mid-infrared and near-infrared
spectroscopic data. Anal Chem 74:3555–3565
18. Du YP, Liang YZ, Jiang JH et al (2004) Spectral regions selection to
improve prediction ability of PLS models by changeable size moving window partial least squares and searching combination moving window
partial least squares. Anal Chim Acta 501(2):183–191
19. Cai WS, Li YK, Shao XG (2008) A variable selection method based on uninformative variable elimination for multivariate calibration of near-infrared
spectra. Chemometr Intell Lab. 90:188–194
20. Chen YF, Chen JM, Pan T et al (2015) Correlation coefficient optimization
in partial least squares regression with application to ATR-FTIR spectroscopic analysis. Anal Methods 7:5780–5786
21. Kim YJ, Yoon G (2002) Multicomponent assay for human serum using
mid-infrared transmission spectroscopy based on component-optimized
spectral region selected by a first loading vector analysis in partial leastsquares regression. Appl Spectrosc 56(5):625–632
22. Long XL, Liu GS, Pan T et al (2014) Waveband selection of reagent-free
determination for thalassemia screening indicators using Fourier transform infrared spectroscopy with attenuated total reflection. J Biomed Opt
19(8):087004
Publisher’s Note
Springer Nature remains neutral with regard to jurisdictional claims in published maps and institutional affiliations.
Ready to submit your research ? Choose BMC and benefit from:
• fast, convenient online submission
• thorough peer review by experienced researchers in your field
• rapid publication on acceptance
• support for research data, including large and complex data types
• gold Open Access which fosters wider collaboration and increased citations
• maximum visibility for your research: over 100M website views per year
At BMC, research is always in progress.
Learn more biomedcentral.com/submissions