Perioperative blood transfusion has distinct postsurgical oncologic impact on patients with different stage of hepatocellular carcinoma
Bạn đang xem bản rút gọn của tài liệu. Xem và tải ngay bản đầy đủ của tài liệu tại đây (845.63 KB, 12 trang )
Chen et al. BMC Cancer
(2020) 20:487
/>
RESEARCH ARTICLE
Open Access
Perioperative blood transfusion has distinct
postsurgical oncologic impact on patients
with different stage of hepatocellular
carcinoma
Gui-Xing Chen1†, Chao-Ying Qi2†, Wen-Jie Hu1, Xiao-Hui Wang1, Yun-Peng Hua1, Ming Kuang1,
Bao-Gang Peng1 and Shao-Qiang Li1*
Abstract
Background: The influence of perioperative blood transfusion (PBT) on postsurgical survival of patients with
different stage of hepatocellular carcinoma (HCC) is not well clarified. This study aimed to evaluate the impact of
PBT on survival outcomes of different stage of HCC patients.
Methods: Consecutive patients who underwent liver resection for HCC between January 2009 and November 2015
were identified from an HCC prospective database in authors’ center. The survival outcomes were compared
between patients receiving PBT and those without PBT before and after propensity score matching (PSM) in
different stage subsets. Cox regression analysis was performed to verify the impact of PBT on outcomes of HCC.
Results: Among 1255 patients included, 804 (64.1%) were Barcelona Clinic Liver Cancer (BCLC) stage 0-A, and 347
(27.6%) received PBT. Before PSM, patients with PBT had worse disease free survival (DFS) and overall survival (OS)
compared with those without PBT in both BCLC 0-A subset and BCLC B-C subset (all P < 0.05). After PSM, 288 pairs
of patients (with and without PBT) were created. In the subset of BCLC 0-A, the median DFS of patients with PBT
was shorter than those without PBT (12.0 months vs. 36.0 months, P = 0.001) Similar result was observed for OS
(36.0 months vs. 96.0 months, P = 0.001). In the subset of BCLC B-C, both DFS and OS were comparable between
patients with PBT and those without PBT. Cox regression analysis showed that PBT involved an increasing risk of
DFS (HR = 1.607; P < 0.001) and OS (HR = 1.756; P < 0.001) for this subset. However, PBT had no impact on DFS (P =
0.126) or OS (P = 0.139) for those with stage B-C HCC.
Conclusions: PBT negatively influenced oncologic outcomes of patient with BCLC stage 0-A HCC, but not those
with stage B-C after curative resection.
Keywords: Hepatocellular carcinoma, Blood transfusion, Outcomes, Hepatectomy
* Correspondence:
†
Gui-Xing Chen and Chao-Ying Qi contributed equally to this work.
1
Department of Liver Surgery, The First Affiliated Hospital of Sun Yat-sen
University, No. 58 Zhongshan Er Road, Guangzhou 510080, China
Full list of author information is available at the end of the article
© The Author(s). 2020 Open Access This article is licensed under a Creative Commons Attribution 4.0 International License,
which permits use, sharing, adaptation, distribution and reproduction in any medium or format, as long as you give
appropriate credit to the original author(s) and the source, provide a link to the Creative Commons licence, and indicate if
changes were made. The images or other third party material in this article are included in the article's Creative Commons
licence, unless indicated otherwise in a credit line to the material. If material is not included in the article's Creative Commons
licence and your intended use is not permitted by statutory regulation or exceeds the permitted use, you will need to obtain
permission directly from the copyright holder. To view a copy of this licence, visit />The Creative Commons Public Domain Dedication waiver ( applies to the
data made available in this article, unless otherwise stated in a credit line to the data.
Chen et al. BMC Cancer
(2020) 20:487
Background
Hepatocellular carcinoma (HCC) is the fifth most common tumor worldwide, and it is the second leading
cause of cancer-related death in China [1]. Liver resection is the mainstay curative treatment for early-stage
HCC and selected intermediate-stage or advanced-stage
HCC with preserved liver function [2]. As the resection
technique and perioperative management have improved, surgical morbidity and mortality following hepatectomy have substantially decreased [3, 4]. In particular,
refined surgical manipulation involves reduced blood
loss during liver resection; however, liver resection for
HCC involves a high risk of bleeding due to underlying
cirrhosis. The blood transfusion rate during liver resection has decreased from 66 to 22% in the past two decades [5].
Blood transfusion is still a life-saving therapy when excessive intraoperative bleeding occurs, but it involves the
risk of transfusion-related complications, such as transmission of hepatitis viruses, human immunodeficiency
virus, and allergic reactions [6]. Regarding oncologic
outcomes, although many studies had been reported, the
influence of perioperative blood transfusion (PBT) on
postoperative survival outcomes is controversial [7–12].
Furthermore, the influence of PBT on different stage of
resectable HCC has not been well investigated.
In this study, we focused on the impact of PBT on oncologic outcomes of patient with different stage of HCC
after curative resection by using propensity score matching (PSM) analysis and Cox regression analysis.
Methods
Patients
From January 2009 to November 2015, all consecutive
patients with HCC undergoing curative liver resection
(complete resection of gross tumors with a pathological
tumor free margin) in the authors’ department were
evaluated for this study. Clinical data were entered prospectively in an HCC database and reviewed retrospectively. Patients with HCC with bile duct tumor thrombus
or ruptured HCC treated with hepatectomy, those who
died within 30 days postoperatively (surgical mortality)
were excluded. This study was approved by the ethics
committee of The First Affiliated Hospital of Sun
Yat-sen University, and written informed consent was
obtained from all patients.
Perioperative assessment
Preoperative evaluation of and resection criteria for
HCC at our center were previously described [13]. The
treatment option was decided by the HCC multidisciplinary team. The Barcelona Clinic Liver Cancer (BCLC)
staging system was used for HCC staging [14]. Although
we used the Child-Pugh score to evaluate liver function
Page 2 of 12
in clinical practice in this cohort of patients, we used albumin to bilirubin (ALBI) scores for data analysis because it was reported that they are more accurate and
objective than conventional Child-Pugh scores [15, 16].
The neutrophil-to-lymphocyte ratio (NLR) was obtained
by dividing the neutrophil count by the lymphocyte
count. The platelet-to-lymphocyte ratio (PLR) referred
to the platelet count subtracted from the lymphocyte
count. The alanine transaminase (ALT)-to-platelet ratio
index (APRI) was calculated as follows: [ALT ÷ (upper
limit of ALT × platelet count)] × 100. These inflammatory parameters were transformed to binary variables in
the Cox regression analysis by using their median values
as the cutoff thresholds, respectively.
PBT referred to the transfusion of packed red blood
cells (RBCs) during excessive intraoperative bleeding or
postoperative bleeding complications. Transfusions of
platelets, fresh-frozen plasma, and albumin were not included. The PBT criteria were preoperative anemia
(hemoglobin ≤70 g/L) and excessive intraoperative or
postoperative intra-abdominal bleeding with unstable
hemodynamics or hemoglobin < 70 g/L. Postoperative
complications were graded by the Clavien-Dindo classification [17].
Surgical procedures
Liver resection included anatomical resection (AR) and
non-anatomical resection (NAR), which was introduced
in our previous report [13]. Briefly, AR was planned for
central tumors, tumors with ipsilateral satellite nodules,
or portal vein tumor thrombus (PVTT), and for patients
with a sufficient liver remnant after AR. NAR was preferred for peripheral tumors and for patients with an insufficient liver remnant after AR was performed. The
Pringle maneuver was applied if necessary. Major resection was defined as resection larger than three segments.
Propensity score matching analysis
To minimize the influence of patient selection bias and
confounding variables between groups in this retrospective study, a PSM analysis was used [18, 19]. In this study,
four levels of outcome-related variables, including patient and underlying liver disease-related [age, sex, preoperative hemoglobin level, platelet count, positive
HBsAg, cirrhosis, prothrombin time (PT), alanine transaminase (ALT) level, ALBI grade], tumor-related [tumor
size, tumor number, tumor capsule, microvascular invasion (MVI), portal vein tumor thrombus (PVTT), hepatic
vein tumor thrombus (HVTT), alpha fetoprotein (AFP)
level, tumor differentiation], systemic inflammation – related (NLR, PLR, APRI), and procedure-related variables
(extent of resection, resection type, resection margin,
and Pringle maneuver), were included in the propensity
score model to balance the baseline of groups as much
Chen et al. BMC Cancer
(2020) 20:487
Page 3 of 12
Table 1 Baseline characteristics of patients with PBT and those without PBT in different HCC stage subset in the entire cohort (n =
1255)
Variable
BCLC 0-A (n = 804)
BCLC B-C (n = 451)
PBT
n = 171)
Non-PBT
(n = 633)
52.9 ± 12.5
50.9 ± 12.1
Male
139 (81.3)
557 (88.0)
Female
32 (18.7)
76 (12.0)
Positive
143 (83.6)
545 (86.1)
Negative
28 (16.4)
88 (13.9)
Yes
123 (71.9)
427 (67.5)
No
PBT
(n = 176)
Non-PBT
(n = 275)
P-value
0.062
49.9 ± 12.2
49.1 ± 12.5
0.544
0.220
157 (89.2)
249 (90.5)
0.644
19 (10.8)
26 (9.5)
148 (84.1)
228 (82.9)
28 (15.9)
47 (17.1)
133 (75.6)
198 (72)
43 (24.4)
77 (28)
P-value
Demographic factors
Age, yr
Sex, n (%)
HBsAg, n (%)
0.415
0.743
Cirrhosis, n (%)
0.265
0.404
48 (28.1)
206 (32.5)
Hemoglobin, g/L
129.7 ± 22.8
141.6 ± 17.5
< 0.001
131.2 ± 23.1
140.3 ± 19.9
0.000
Platelet count, × 109 /L
185.0 ± 64.5
201.3 ± 92.9
0.008
215.4 ± 113.3
207.1 ± 71.3
0.338
Prothrombin time, s
13.0 ± 1.6
12.7 ± 0.9
0.001
13.1 ± 1.1
12.7 ± 1.3
0.001
ALT, U/L, median (range)
39 (6565)
33 (71428)
0.024
42.5(8237)
38.0(6522)
0.189
Grade 1
84 (49.1)
399 (63.0)
< 0.001
76 (43.2)
160 (58.2)
0.001
Grade 2
84 (49.1)
232 (36.7)
99 (56.3)
115 (41.8)
Grade 3
3 (1.8)
2 (0.3)
1 (0.5)
0
ALBI grade, n (%)
Inflammatory factors
NLR, median (range)
2.4 (0.5,13.0)
1.9 (0.3,24.9)
< 0.001
2.5 (0.9,24.4)
2.3 (0.6,18.3)
0.013
PLR, median (range)
121.1 (21.61432.1)
96.9 (19.4414.0)
< 0.001
133.9 (19.8751.0)
119.6 (20.6314.6)
< 0.001
APRI, median (range)
0.6 (0.1,12.2)
0.5 (0.1,21.1)
0.038
0.6 (0.1,3.8)
0.5 (0.1,5.7)
0.079
≥ 400
99 (42.1)
214 (33.8)
0.044
88 (50)
149 (54.2)
0.387
< 400
72 (57.9)
419 (66.2)
88 (50)
126 (45.8)
Tumor size, cm
9.2 ± 6.1
6.2 ± 3.1
< 0.001
10.7 ± 3.92
8.9 ± 3.5
< 0.001
Solitary
167 (97.7)
596 (94.2)
0.049
59 (33.5)
87 (31.6)
0.975
2
4 (2.3)
29 (4.6)
59 (33.5)
102 (37.1)
3
0 (0)
8 (1.2)
18 (10.2)
25 (9.1)
4
0 (0)
0 (0)
40 (22.8)
61 (22.2)
Complete
137 (80.1)
574 (90.7)
107 (60.8)
187 (68)
Incomplete
34 (19.9)
59 (9.3)
69 (39.2)
88 (32)
I+ II
115 (67.3)
465 (73.5)
119 (67.6)
193 (70.2)
III, IV
56 (32.7)
168 (26.5)
57 (32.4)
82 (29.8)
Tumor characteristics
AFP, ug/L
Tumor number, n (%)
Tumor capsule, n (%)
< 0.001
0.118
Differentiation, n (%)
0.108
0.566
MVI, n (%)
Yes
50 (29.2)
123 (19.4)
79 (44.9)
105 (38.2)
No
121 (70.8)
510 (80.6)
0.006
97 (55.1)
170 (61.8)
0.158
PVTT, n (%)
Yes
0
0
100 (56.8)
116 (42.2)
No
171 (100)
633 (100)
76 (43.2)
159 (57.8)
0.002
Chen et al. BMC Cancer
(2020) 20:487
Page 4 of 12
Table 1 Baseline characteristics of patients with PBT and those without PBT in different HCC stage subset in the entire cohort (n =
1255) (Continued)
Variable
BCLC 0-A (n = 804)
BCLC B-C (n = 451)
PBT
n = 171)
Non-PBT
(n = 633)
PBT
(n = 176)
Non-PBT
(n = 275)
Yes
0
0
21 (11.9)
7 (2.5)
No
171 (100)
633 (100)
155 (88.1)
268 (97.5)
Major
64 (37.4)
194 (30.6)
126 (71.6)
180 (65.5)
Minor
107 (62.6)
439 (69.4)
50 (28.4)
95 (34.5)
P-value
HVTT, n (%)
P-value
0.000
Surgical factors
Extent of resection, n (%)
0.092
0.174
Type of resection, n (%)
Anatomical
Nonanatomical
62 (36.3)
203 (32.1)
109 (63.7)
430 (67.9)
0.302
97 (55.1)
150 (54.5)
79 (44.9)
125 (45.5)
0.906
Resection margin
≤ 1 cm
32 (18.7)
58 (9.2)
> 1 cm
139 (81.3)
575 (90.8)
Yes
111 (64.9)
380 (60.0)
No
60 (35.1)
253 (40.0)
Blood loss, ml, median (range)
1484.7 (200,12,000)
200 (50,3000)
I
4 (2.3)
9 (1.4)
II
1 (0.6)
9 (1.4)
< 0.001
56 (31.8)
122 (44.4)
120 (68.2)
153 (55.6)
0.008
114 (64.8)
169 (61.4)
62 (35.2)
106 (38.6)
< 0.001
1000 (200,10,500)
300 (30,2500)
< 0.001
0.045
3 (1.7)
8 (2.9)
0.950
2 (1.1)
4 (1.5)
Pringle maneuver, n (%)
0.245
0.477
Clavien-Dindo grade
III
15 (8.8)
31 (4.9)
10 (5.7)
18 (6.5)
IV
2 (1.2)
3 (0.5)
3 (1.7)
2 (0.7)
Abbreviation: HBsAg Hepatitis B surface antigen, ABLI grade albumin to bilirubin grade, ALT anlanine transaminase, NLR neutrophil to lymphocyte ratio, PLR platelet
to lymphocyte ratio, APRI alanine transaminase to platelet ratio index, PVTT portal vein tumor thrombus, HVTT hepatic vein tumor thrombus, MVI microscopic
vascular invasion, AFP alpha fetoprotein
as possible. PSM was performed using R software (R
2.15.3; ). A one-to-one nearest
neighbor matching without replacement algorithm was
applied. To obtain the best trade-off between homogeneity and retained sample size, caliper widths of 0.20,
0.10, 0.050, and 0.010 were tested in our cohort of patients. We found that a caliper width of 0.1 met the
requirement.
Follow-up
The follow-up protocols for HCC and treatment of
recurrent HCC at our center were described previously [13]. The main outcomes of this study were disease free survival (DFS) and overall survival (OS).
DFS was calculated from the date of tumor resection
to the date of first tumor recurrence or the last
follow-up visit. The OS was calculated from the date
of tumor resection to the date of death or the date of
the last follow-up visit. The endpoint follow-up was
December 30, 2016. The median follow-up period was
51.0 months (range, 3–102 months). The treatments of
recurrent HCC including radiofrequency ablation, re-
hepatectomy, transarterial chemoembolization, or sorafenib alone or combined therapy based on the number, location of recurrent tumor and liver function
reserve.
Statistical analysis
The clinical database was established using SPSS for
Windows (version 22.0; IBM, Armonk, NY, USA). Continuous data are expressed as mean (standard deviation)
or median (range). The independent t test or MannWhitney U test was used to compare continuous data
between groups, and the χ2 test was used for discrete
data. Cumulative DFS and OS rates were calculated
using the Kaplan–Meier method and compared between
groups using the log rank test. A Cox regression model
involving univariable and multivariable analyses was
used to identify risk factors associated with DFS and OS.
All factors with statistical significance (P < 0.05) in the
univariable analysis were entered into the multivariable
analysis (forward method) to yield independent risk factors. P < 0.05 was considered statistically significant.
Chen et al. BMC Cancer
(2020) 20:487
Page 5 of 12
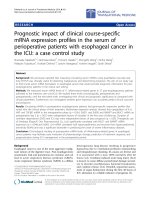
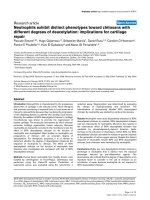
Fig. 1 Survival curves of patients with PBT and without PBT in the BCLC 0-A subset and the BCLC B-C subset in the entire cohort. a DFS in the
BCLC 0-A subset. b OS in the BCLC 0-A subset. c DFS in the BCLC B-C subset. d OS in the BCLC B-C subset (Log rank test)
Results
A total of 1336 patients had surgery for HCC in this
study period. Eighty-one patients were excluded from
this study: 17 patients with bile duct tumor thrombus;
53 patients with rupture HCC; and 11 (0.9%, 11/1266)
patients who died of postoperative liver failure. Finally,
1255 patients who underwent liver resection with curative intent were recruited in this study. Most patients
(84.8%) had underlying HBV infection. 27.6% (347/1255)
received PBT. The patients were classified into two subsets: the BCLC 0-A subset (n = 804, 64.1%) and the
BCLC B-C subset (n = 451, 35.9%) according to tumor
stage.
Survival impact of PBT on different stages of HCC in the
entire cohort
In the subset of BCLC 0-A, the median DFS was 12.0
months (95% confidence interval [CI]: 7.9–16.1) for PBT
group and 43.1 months (95% CI: 28.5–57.8) for the nonPBT group (P < 0.001) (Fig. 1a). The median OS was
36.0 months (95%CI: 25.0–47.0) for the PBT group and
96.0 months for the non-PBT group (P < 0.001) (Fig. 1b).
In the subset of BCLC B-C, the median DFS was 5.0
months (95% CI: 3.8–6.2) for PBT group and 7.0 months
(95% CI: 4.6–9.4) for the non-PBT group (P = 0.006)
(Fig. 1c). The median OS was 20.0 months (95%CI:
14.5–25.5) for the PBT group and 44.0 months for the
non-PBT group (P = 0.004) (Fig. 1d).
Patients’ clinicopathologic features in the entire cohort
Propensity score matching analysis
The baseline clinical data of patients with PBT and
those without PBT (non-PBT) within the BCLC 0-A
subset and the BCLC B-C subset were compared respectively and summarized in Table 1. Numerous variables were significantly different between patients
with PBT and those without PBT within each subset.
21.3% (171/804) of patients received PBT in the subset of BCLC 0-A, and 39.0% (176/451) in the BCLC
B-C subset.
Because numerous variables were different between the
PBT group and the non-PBT group in each subset of
patients, a large patient selection bias existed for the entire cohort. To overcome this selection bias, PSM was
used. Twenty-four variables, including patient and
underlying liver disease-related, tumor-related, systemic
inflammation-related, and procedure-related factors
were selected as the matched factors and entered in the
PSM model. After matching, 288 pairs of patients were
Chen et al. BMC Cancer
(2020) 20:487
Page 6 of 12
Table 2 Baseline characteristics of patients with PBT and those without PBT in different HCC stage subset in the matched cohort
(n = 576)
Variable
BCLC 0-A (n = 317)
BCLC B-C (n = 259)
PBT
n = 156)
Non-PBT
(n = 161)
P-value
PBT
(n = 132)
Non-PBT
(n = 127)
P-value
52.7 ± 12.3
53.1 ± 12.4
0.787
49.2 ± 12.6
51.4 ± 13.1
0.182
Male
127 (81.4)
126 (78.3)
0.487
0.758
Female
29 (18.6)
35 (21.7)
Positive
132 (84.6)
138 (85.7)
Negative
24 (15.4)
23 (14.3)
Yes
144 (73.1)
121 (75.2)
No
42 (26.9)
40 (24.8)
Hemoglobin, g/L
132.0 ± 21.5
133.4 ± 19.8
0.548
136.3 ± 21.1
133.4 ± 19.4
0.245
Platelet count, ×109 /L
201.8 ± 93.3
180.6 ± 71.3
0.023
197.8 ± 85.0
207.9 ± 73.4
0.307
Prothrombin time, s
12.9 ± 1.6
12.9 ± 0.1
0.705
13.0 ± 1.1
13.0 ± 1.1
0.894
ALT, U/L, median (range)
38 (6293)
34 (71428)
0.931
44 (8, 237)
38 (12,522)
0.541
Grade 1
82 (52.5)
77 (47.8)
0.486
64 (48.4)
53 (41.7)
0.341
Grade 2
72 (46.2)
83 (51.6)
67 (50.8)
74 (58.3)
Grade 3
2 (1.3)
1 (0.6)
1 (0.8)
0
Demographic factors
Age, yr
Sex, n (%)
118 (89.4)
115 (90.6)
14 (10.6)
12 (9.4)
112 (84.8)
103 (81.1)
20 (15.2)
24 (18.9)
101 (76.5)
93 (73.2)
31 (23.5)
34 (26.8)
HBsAg, n (%)
0.784
0.424
Cirrhosis, n (%)
0.674
0.544
ALBI grade, n (%)
Inflammatory factors
NLR, median (range)
2.2 (0.52,13.03)
2.1 (0.3, 24.9)
0.904
2.3 (0.9, 24.4)
2.5 (1.1, 15.8)
0.901
PLR, median (range)
117.8 (21.4, 405.4)
107.8 (19.4, 414.0)
0.379
118.4 (19.8, 460.3)
131.1 (20.6, 314.6)
0.440
APRI, median (range)
0.5 (0.1, 5.3)
0.5 (0.1, 21.1)
0.621
0.6 (0.1, 3.8)
0.5 (0.1, 5.7)
0.269
≥ 400
64 (41.0)
60 (37.3)
0.493
61 (46.2)
70 (55.1)
0.153
< 400
92 (59.0)
101 (68.9)
71 (53.8)
57 (44.9)
Tumor size, cm
8.4 ± 4.4
7.69 ± 3.86
0.110
9.8 ± 3.5
10.1 ± 3.5
0.441
Solitary
153 (98.1)
156 (96.7)
0.502
38 (28.8)
45 (35.4)
0.524
2
3 (1.9)
5 (3.1)
48 (36.4)
45 (35.4)
3
0
0
16 (12.1)
4 (3.2)
4
0
0
30 (22.7)
33 (26.0)
Complete
127 (81.4)
135 (83.9)
Incomplete
29 (18.6)
26 (16.1)
I+ II
108 (69.2)
111 (68.9)
III, IV
48 (30.8)
50 (16.1)
Tumor characteristics
AFP, ug/L
Tumor number, n (%)
Tumor capsule, n (%)
0.568
86 (65.2)
81 (63.8)
46 (34.8)
46 (36.2)
88 (66.7)
85 (66.9)
44 (33.3)
42 (33.1)
0.818
Differentiation, n (%)
0.956
0.964
MVI, n (%)
Yes
35 (22.4)
33 (20.5)
62 (47.0)
66 (52.0)
No
121 (77.6)
128 (79.5)
0.674
70 (53.0)
61 (48.0)
0.196
PVTT, n (%)
Yes
0
0
68 (51.5)
72 (56.7)
No
156 (100)
161 (100)
64 (48.5)
55 (43.3)
0.405
Chen et al. BMC Cancer
(2020) 20:487
Page 7 of 12
Table 2 Baseline characteristics of patients with PBT and those without PBT in different HCC stage subset in the matched cohort
(n = 576) (Continued)
Variable
BCLC 0-A (n = 317)
BCLC B-C (n = 259)
PBT
n = 156)
Non-PBT
(n = 161)
PBT
(n = 132)
Non-PBT
(n = 127)
P-value
Yes
0
0
9 (6.8)
5 (3.9)
0.307
No
156 (100)
161 (100)
123 (93.2)
122 (96.1)
Major
59 (37.8)
58 (36.0)
91 (68.9)
83 (65.4)
Minor
97 (62.2)
103 (64.0)
41 (31.1)
44 (34.6)
Anatomical
55 (35.3)
53 (32.9)
68 (51.5)
69 (54.3)
nonanatomical
101 (64.7)
108 (67.1)
64 (48.5)
58 (45.7)
≤1
51 (32.7)
45 (28.0)
99 (75.0)
100 (78.7)
>1
105 (67.3)
116 (72.0)
33 (25.0)
27 (21.3)
P-value
HVTT
Surgical factors
Extent of resection, n (%)
0.741
0.541
Type of resection, n (%)
0.662
0.651
Resection margin, cm
0.358
0.476
Pringle maneuver, n (%)
Yes
56 (35.9)
46 (28.6)
No
100 (64.1)
115 (71.4)
1000 (50, 12,000)
200 (50,3000)
< 0.001
I
3 (1.9)
3 (1.9)
0.923
II
1 (0.6)
3 (1.9)
Blood loss, ml, median (range)a
0.163
100 (75.7)
98 (77.2)
32 (24.3)
29 (22.7)
0.790
1000 (15,7000)
300 (50,2500)
< 0.001
1 (0.8)
4 (3.1)
0.689
1 (0.8)
2 (1.6)
Clavien-Dindo gradea
III
12 (7.7)
12 (7.5)
6 (4.5)
7 (5.5)
IV
2 (1.3)
1 (0.6)
2 (1.5)
1 (0.8)
a
Variables are not included in the matching model
Abbreviation: ABLI grade albumin to bilirubin grade, ALT anlanine transaminase, NLR neutrophil to lymphocyte ratio, PLR platelet to lymphocyte ratio, APRI alanine
transaminase to platelet ratio index, PVTT portal vein tumor thrombus, HVTT hepatic vein tumor thrombus, MVI microscopic vascular invasion, AFP alpha
fetoprotein, PLR platelet to lymphocyte ratio
generated from those with PBT and without PBT. In the
matched cohort, apart from blood loss, the confounding
variables of the matched groups in each subset were
similar (Table 2). The postsurgical complication rates
were comparable between patients with PBT and those
without PBT within the BCLC 0-A subset and the BCLC
B-C subset, respectively.
Survival impact of PBT on different stage of HCC in the
matched cohort
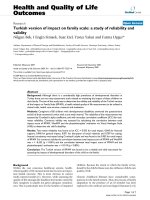
There were 317 (55.0%) patients with BCLC stage 0-A,
and 259 (45.0%) BCLC stage B-C in the matched cohort
(Table 2). The median DFS of patients with PBT was
significantly shorter than that without PBT in the BCLC
stage 0-A subset (12.0 months [95%CI, 7.4–16.6] vs.
36.0 months [95% CI: 10.6–61.4], P = 0.001, Fig. 2a).
Similar result was observed for OS (36.0 months [95%
CI, 23.9–48.0] vs. 96.0 months [95% CI: 14.6–177.4], P =
0.001, Fig. 2b). However, the median DFS and median
OS were comparable between patients with PBT and
those without PBT in the subset of BCLC stage B-C
HCC (both P > 0.05, Fig. 2c, d).
Risk factors affecting DFS and OS
To further investigate the role of PBT in survival outcomes of HCC, the Cox regression model was used to
identify the risk factors associated with DFS and OS of
the entire cohort. Twenty-three clinicopathologic variables were included in the univariable analysis (Table 3).
The variables with statistical significance (P < 0.05) were
selected and entered the multivariable analysis (Table 4).
The results revealed that PBT had an increased risk of
DFS (hazard ratio [HR], 1.607; 95% CI,1.272–2.031; P <
0.001) and OS (HR, 1.756, 95% CI,1.302–2.368; P <
0.001) for patients with stage 0-A HCC after curative resection. However, PBT was not a risk factor of DFS or
OS for patients with stage B-C HCC (both P > 0.05).
Discussion
The impact of PBT on survival outcomes for HCC has
been debated for more than two decades [7–12, 20–24].
Because an RCT is impossible on the issue of blood
transfusions in clinical practice, all evidences available
were based on retrospective study. In 2013, one metaanalysis involved 22 retrospective studies with 5635
Chen et al. BMC Cancer
(2020) 20:487
Page 8 of 12
Fig. 2 Survival curves of patients with PBT and without PBT in the BCLC 0-A subset and the BCLC B-C subset in the matched cohort. a DFS in the
BCLC 0-A subset. b OS in the BCLC 0-A subset. c DFS in the BCLC B-C subset. d OS in the BCLC B-C subset (Log rank test)
patients concluded that PBT had a negative effect on oncologic outcomes for HCC after resection [12]. However,
five studies published recently still yielded controversial
conclusions, although they all deliberately used a PSM
analysis to adjust patient selection bias [7–11].
Resectable HCC comprised of different stage of disease, from BCLC stage 0 to C, which had large heterogeneity among patients and tumors. The prominent
independent risk factors associated with recurrence or
OS should be various for different stage of tumor. In the
present study, we focused on the impact of PBT on
HCC patient with different tumor stage and demonstrated that both DFS and OS for patients with PBT
were significantly worse than those without PBT either
within the BCLC 0-A subset (Fig. 1a, b) or the BCLC BC subset (Fig. 1c, d) in the entire cohort.
Because the baseline variables of the PBT and nonPBT group within the BCLC 0-A subset or the BCLC BC subset were diverse, patient selection bias largely
existed. The patients with PBT had larger tumor burden
(i.e., large tumors, multiple tumors, incomplete tumor
capsules, PVTT, MVI, high levels of AFP) and higher
level of inflammatory indexes (NLR, PLR and APRI)
compared with those with non-PBT (Table 1). These are
all well-known risk factors associated with tumor recurrence and reduced survival [25–31], as partially
confirmed by the present Cox regression analysis (Table
4). This probably explains why the outcomes were worse
for the patients with PBT than for those without PBT in
the entire cohort.
Therefore, to overcome patient selection bias, PSM
that could mimic an RCT study [32] was used. Considering that HCC recurrence is induced cooperatively by
tumor-related, underlying liver disease-related, systemic
inflammation-related, and procedure-related factors, the
matched variables in the PSM model should comprehensively include these four outcome-related aspects to reduce selection bias as much as possible. Inclusion of
more outcome-related variables in PSM would potentially reduce selection bias [33, 34]. Notably, there were
24 variables that fully covered the four aspects of risk
factors described in our PSM model. The comprehensive
inclusion of matched variables would maximally reduce
patient selection bias in our study.
Cirrhosis, tumor size, macroscopic venous tumor
thrombus and intraopeative blood loss were reported to
be the risk factors associated with PBT [9, 11]. Excessive
blood loss is the most important cause of PBT. PBT or
blood loss, which one is the prominent factor affecting
oncologic outcome is clinically hard to define, although
a previous study showed that blood loss predicted recurrence and poor OS [35]. In the present study, Cox
Chen et al. BMC Cancer
(2020) 20:487
Page 9 of 12
Table 3 Risk factors associated with postoperative disease free survival and overall survival identified by univariate Cox regression
analysis in the entire cohort
Variables
Univariate Analysis
Overall survival
Disease-free survival
Hazard ratio
p-valule
Hazard ratio
p-value
0.991 (0.983–0.999)
0.025
0.715
(0.617–0.829)
< 0.001
0.953 (0.710–1.278)
0.746
0.789
(0.622–0.999)
0.049
1.013 (0.777–1.320)
0.924
1.049
(0.855–1.288)
0.646
1.230 (0.990–1.529)
0.062
1.325
(1.119–1.568)
0.001
1.561 (1.291–1.886)
< 0.0001
1.218
(1.052–1.409)
0.008
1.199 (0.987–1.457)
0.068
1.254
(1.082–1.455)
0.003
1.007 (0.690–1.469)
0.972
1.083(0.810–1.448)
0.590
1.102 (1.070–1.134)
< 0.001
1.058(1.030–1.087)
< 0.001
1.002 (1.000–1.003)
< 0.001
1.002
(1.001–1.002)
< 0.001
0.934 (0.724–1.206)
0.601
1.001
(0.847–1.184)
0.988
2.353 (1.792–3.090)
< 0.001
1.832(1.523–2.204)
1.906 (1.554–2.336)
< 0.001
1.768
(1.432–2.183)
< 0.001
0.474 (0.382–0.588)
< 0.001
0.587
(0.494–0.698)
< 0.001
1.170 (0.948–1.443)
0.145
1.183
(1.007–1.389)
0.041
3.295 (2.660–4.083)
< 0.001
2.411
(2.026–2.869)
< 0.001
2.347 (1.925–2.860)
< 0.001
1.944
(1.664–2.270)
< 0.001
1.841(1.516–2.236)
< 0.001
1.608
(1.386–1.864)
< 0.001
1.050 (0.998–1.521)
0.354
0.865 (0.775–1.211)
0.746
0.886 (0.815–0.956)
0.234
0.786 (0.705–0.898)
0.846
1.366 (1.125–1.660)
0.02
1.375 (1.185–1.595)
< 0.001
1.728 (1.422–2.099)
< 0.001
1.702 (1.468–1.974)
< 0.001
2.217(1.807–2.720)
< 0.001
1.761(1.494–2.075)
Age, year
≤ 50 vs > 50
Sex
Male vs female
HbsAg
Positive vs negative
Cirrhosis
Yes vs no
ALBI grade
2 + 3 vs 1
ALT, U/L
> 40 vs ≤ 40
Platelet. ×109 /L
≤ 100 vs > 100
NLR
> 2.3 vs ≤ 2.3
PLR
> 118.9 vs ≤ 118.9
APRI
> 0.55 vs ≤ 0.55
Tumor size, cm
> 5.0 vs ≤ 5.0
< 0.001
Tumor number
Multiple vs solitary
Tumor capsule
Incomplete vs complete
Differentiation
3 + 4 vs 1 + 2
Macro-VTT
Yes vs no
MVI
Yes vs no
AFP, μg/L
> 400 vs ≤ 400
Resection margin, cm
≤ 1.0 vs > 1.0
Pringle maneuver
Yes vs no
Resection type
Anatomic vs nonanatomic
Resection extent
Major vs minor
Blood loss, ml
> 800 vs ≤ 800
Blood transfusion
< 0.001
Chen et al. BMC Cancer
(2020) 20:487
Page 10 of 12
Table 3 Risk factors associated with postoperative disease free survival and overall survival identified by univariate Cox regression
analysis in the entire cohort (Continued)
Variables
Univariate Analysis
Overall survival
Yes vs no
Disease-free survival
Hazard ratio
p-valule
Hazard ratio
2.107 (1.726–2.571)
< 0.001
1.759 (1.503–2.058)
p-value
< 0.001
Abbreviation: HBsAg hepatitis B virus surface antigen, ALT anlanine transaminase, NLR indicates neutrophil to lymphocyte ratio, PLR platelet to lymphocyte ratio,
APRI alanine transaminase to platelet ratio index, AFP alpha fetoprotein, MVI microscopic vascular invasion, Macro-VTT macroscopic venous tumor thrombus,
including portal vein tumor thrombus and hepatic vein tumor thrombus
Table 4 Risk factors associated with postoperative disease free survival and overall survival identified by multivariate Cox regression
analysis
Variables
OS
DFS
HR (95% CI)
p-value
HR (95% CI)
p-value
The entire cohort (n = 1255)
Age, yr, ≤50 vs > 50
0.800 (0.688–0.931)
0.004
Cirrhosis, yes vs no
1.328 (1.117–1.578)
0.001
ALBI grade, 2 + 3 vs 1
1.225 (1.005–1.494)
0.044
NLR, > 2.3 vs ≤ 2.3
1.080 (1.041–1.121)
< 0.001
1.034 (1.002–1.068)
0.040
Tumor size, cm, > 5 vs ≤ 5
1.437 (1.077–1.916)
0.014
1.311 (1.073–1.602)
0.008
Tumor no., multiple vs solitary
1.489 (1.206–1.838)
< 0.001
1.583 (1.343–1.866)
< 0.001
Macro-VTT, yes vs no
1.662 (1.288–2.143)
< 0.001
1.377 (1.126–1.685)
0.002
MVI, yes vs no
1.581 (1.262–1.980)
< 0.001
1.541 (1.298–1.829)
< 0.001
AFP, μg/L, > 400 vs ≤ 400
1.412 (1.154–1.726)
0.001
1.267 (1.086–1.477)
0.003
PBT, yes vs no
1.623 (1.312–2.008)
< 0.001
1.365 (1.158–1.608)
< 0.001
0.986 (0.977–0.994)
0.001
1.325 (1.053–1.668)
0.016
BCLC 0-A subgroup (n = 804)
Age, yr, ≤50 vs > 50
Cirrhosis, yes vs no
ALBI grade, 2 + 3 vs 1
1.434 (1.094–1.879)
0.009
NLR, > 2.3 vs ≤ 2.3
1.105 (1.056–1.157)
< 0.001
1.054 (1.010–1.099)
0.016
MVI, yes vs no
1.643 (1.217–2.220)
0.001
1.578 (1.252–1.988)
< 0.001
AFP, μg/L, > 400 vs ≤ 400
1.832 (1.390–2.413)
< 0.001
1.445 (1.167–1.789)
0.001
PBT, yes vs no
1.756 (1.302–2.368)
< 0.001
1.607 (1.272–2.031)
< 0.001
0.989 (0.980–0.999)
0.025
1.826 (1.151–2.897)
0.011
1.568 (1.253–1.961)
< 0.001
BCLC B-C subgroup (n = 451)
Age, yr, ≤50 vs > 50
Tumor size, cm, > 5 vs ≤ 5
Tumor no., multiple vs solitary
1.546 (1.129–2.116)
0.007
PLR, > 118.9 vs ≤ 118.9
1.002 (1.000–1.003)
0.013
MVI, yes vs no
1.492 (1.059–2.102)
0.022
Macro-VTT, yes vs no
2.033 (1.411–2.929)
< 0.001
Cirrhosis, yes vs no
PBT, yes vs no
1.257 (0.929–1.700)
0.139
1.367 (1.067–1.752)
0.011
1.408 (1.083–1.830)
0.014
1.203 (0.950–1.525)
0.126
Abbreviation: OS overall survival, DFS disease free survival, HR hazard ratio, 95% CI 95% confident interval, ABLI grade albumin to bilirubin grade, NLR neutrophil to
lymphocyte ratio, Macro-VTT macroscopic venous tumor thrombus, MVI microscopic vascular invasion, AFP alpha fetoprotein, PBT perioperative blood transfusion,
PLR platelet to lymphocyte ratio
Chen et al. BMC Cancer
(2020) 20:487
univariable analysis showed that both blood loss and
PBT were significant risk factors of DFS and OS (Table
3). However, it was PBT rather than blood loss affecting
both DFS and OS in multivariable analysis (Table 4).
Therefore, we believed although blood loss was not adjusted as a selected factor for propensity matching, it
would not potentially affect the survival results derived
from the matched cohort.
After propensity matching, the baselines of patients
with PBT and those without PBT were comparable
(Table 2) within the BCLC 0-A subset or the BCLC B-C
subset. The survival results showed that PBT significantly reduced postoperative DFS and OS of HCC patients with BCLC stage 0-A (Fig. 2a, b), but it no longer
influence the postsurgical survival outcomes of those
with BCLC stage B-C (Fig. 2c, d). These were consistent
with an early study reported by Ashara et al. in 1999,
but our study had superiority in patient number and
statistical power. In that study, only 175 patients were
included and PSM was not applied to control patient
bias [36].
27.6% patients required blood transfusion in the entire
cohort, but they all achieved curative resection
(complete resection of gross tumors with a pathological
tumor free margin). Therefore, the volume of intraoperative blood loss does not correlate with the curativity of
resection for HCC. To further evaluate the impact of
PBT on survival outcomes of HCC, Cox univariable and
multivariable regression analyses were performed in the
matched cohort. The results showed that PBT, but not
blood loss was associated with a reduced DFS and OS
(Table 4). PBT was significantly associated with increased risks of poor DFS and OS for the subset of patients with BCLC stage 0-A HCC. However, in the
BCLC B-C subset, PBT was not a risk factor affecting
DFS and OS. Tumor-related factors (multiple tumor,
size, venous tumor thrombus, MVI) are the major risk
factors associated with tumor recurrence and OS. In the
subset with early tumor, patients with PBT had a shorter
DFS or OS may partially result from transfusion-related
immunomodulation (TRIM) [37]. Residual leukocyte or
apoptotic cells in the stored RBCs may stimulate TGFβ
and TNFα production, which in turn suppresses NK
cells and activate Treg cells. Furthermore, microparticles
derived from RBCs may contribute to neutrophil priming and activation and promotion of inflammation.
These collectively caused immunosuppression [38],
thereby promoting tumor recurrence.
This study had several limitations. First, it was a retrospective cohort study, not an RCT trial. However, the
large sample size and the combination of PSM (full inclusion of variables and appropriate calipers) and Cox
regression analyses strengthened the statistical data,
thereby yielding reliable results. Second, it was a single-
Page 11 of 12
center study, and most patients had hepatitis B virusrelated HCC. External validation by other independent
cohorts with different HCC etiologies is needed.
Conclusions
The present study demonstrated that PBT would significantly reduce DFS and OS of patients with BCLC stage
0-A HCC, but not those of patients with BCLC stage BC HCC after curative liver resection. Deliberate preoperative planning and refined intraoperative manipulation are required to minimize blood loss and
transfusion, thereby improving outcomes of HCC.
Abbreviations
AFP: Alpha fetal protein; ALBI: Albumin to bilirubin; APRI: Alanine
transaminase -to-platelet ratio index; ALT: Alanine transaminase;
AR: Anatomical resection; BCLC: Barcelona Clinic Liver Cancer; 95% CI: 95%
confidence interval; DFS: Disease free survival; HCC: Hepatocellular
carcinoma; HR: Hazard ratio; HVTT: Hepatic vein tumor thrombus;
MVI: Microscopic vascular invasion; NAR: Non-anatomical resection;
NLR: Neutrophil to lymphocyte ratio; OS: Overall survival; PBT: Perioperative
blood transfusion; PLR: Platelet to lymphocyte ratio; PSM: Propensity score
matching; PVTT: Portal vein tumor thrombus
Acknowledgements
We thank Prof. Fu-Tian Luo from the Department of Statistics of Sun Yat-sen
University for his statistic analysis.
Authors’ contributions
Study design, conception, manuscript drafting and revision: SQL, GXC. Data
collection, acquisition and analysis: GXC, CYQ, WJH, XHH, YPH. Administrative
support and manuscript review: MK, BGP and LJL. Final approval of
manuscript: all authors.
Funding
This work was supported by a grant from the National Natural Science
Foundation of China (No. 81472254), Science and Technology Planning
Project of Guangdong Province, China (No. 2016A020215064). The funding
sources were not involved in the design of this study, in the collection,
analysis, and interpretation of the data, or in writing of the manuscript.
Availability of data and materials
All data generated or analysed during this study are included in this
published article.
Ethics approval and consent to participate
This study was approved by the Ethics Committee of The First Affiliated
Hospital of Sun Yat-sen University, and written informed consent was obtained from all patients before treatment.
Competing interests
The authors declare there is no competing interests.
Author details
1
Department of Liver Surgery, The First Affiliated Hospital of Sun Yat-sen
University, No. 58 Zhongshan Er Road, Guangzhou 510080, China.
2
Department of Operating Center, The First Affiliated Hospital of Sun Yat-sen
University, No. 58 Zhongshan Er Road, Guangzhou 510080, China.
Received: 29 March 2019 Accepted: 20 May 2020
References
1. Chen W, Zheng R, Baade PD, Zhang S, Zeng H, Bray F, et al. Cancer statistics
in China, 2015. CA Cancer J Clin. 2016;66:115–32.
2. European Association for the Study of the Liver; European Organization for
Research and Treatment of Cancer. EASL-EORTC clinical practice guidelines:
management of hepatocellular carcinoma. J Hepatol. 2012;56:908–43.
Chen et al. BMC Cancer
3.
4.
5.
6.
7.
8.
9.
10.
11.
12.
13.
14.
15.
16.
17.
18.
19.
20.
21.
22.
23.
24.
25.
(2020) 20:487
Fan ST, Mau Lo C, Poon RT, Yeung C, Leung LC, Yuen WK, et al. Continuous
improvement of survival outcomes of resection of hepatocellular carcinoma:
a 20-year experience. Ann Surg. 2011;253:745–58.
Lim KC, Chow PK, Allen JC, Siddiqui FJ, Chan ES, Tan SB. Systematic review
of outcomes of liver resection for early hepatocellular carcinoma within the
Milan criteria. Br J Surg. 2012;99:1622–9.
Cescon M, Vetrone G, Grazi GL, Ramacciato G, Ercolani G, et al. Trends in
perioperative outcome after hepatic resection: analysis of 1500 consecutive
unselected cases over 20 years. Ann Surg. 2009;249:995–1002.
Carlos M, Caveh M, Donat RS. Allogeneic blood transfusions: benefit, risks
and clinical indications in countries with a low or high human development
index. Br Med Bull. 2004;70:15–28.
Kuroda S, Tashiro H, Kobayashi T, Oshita A, Amano H, Ohdan H. No impact
of perioperative blood transfusion on recurrence of hepatocellular
carcinoma after hepatectomy. World J Surg. 2012;36:651–8.
Peng T, Zhao G, Wang L, Wu J, Cui H, Liang Y, et al. No impact of
perioperative blood transfusion on prognosis after curative resection for
hepatocellular carcinoma: a propensity score matching analysis. Clin Transl
Oncol. 2018;20:719–28.
Yang T, Lu JH, Lau WY, Zhang TY, Zhang H, Shen YN, et al. Perioperative
blood transfusion does not influence recurrence-free and overall survivals
after curative resection for hepatocellular carcinoma. J Hepatol. 2016;64:
583–93.
Harada N, Shirabe K, Maeda T, Kayashima H, Ishida T, Maehara Y. Blood
transfusion is associated with recurrence of hepatocellular carcinoma after
hepatectomy in child-Pugh class a patients. World J Surg. 2015;39:1044–51.
Wada H, Eguchi H, Nagano H, Kubo S, Nakai T, Kaibori M, et al. Perioperative
allogenic blood transfusion is a poor prognostic factor after hepatocellular
carcinoma surgery: a multi-center analysis. Surg Today. 2018;48:73–9.
Liu L, Wang Z, Jiang S, Shao B, Liu J, Zhang S, et al. Perioperative
allogenenic blood transfusion is associated with worse clinical outcomes for
hepatocellular carcinoma: a meta-analysis. PLoS One. 2013;8:e64261.
Li SQ, Huang T, Shen SL, Hua YP, Hu WJ, Kuang M, et al. Anatomical versus
non-anatomical liver resection for hepatocellular carcinoma exceeding
Milan criteria. Br J Surg. 2017;104:118–27.
Bruix J, Reig M, Sherman M. Evidence-based diagnosis, staging, and
treatment of patients with hepatocellular carcinoma. Gastroenterology.
2016;150:835–53.
Johnson PJ, Berhane S, Kagebayashi C, Satomura S, Teng M, Reeves HL,
et al. Assessment of liver function in patients with hepatocellular carcinoma:
a new evidence-based approach—the ALBI grade. J Clin Oncol. 2015;33:
550–8.
Pinato DJ, Sharma R, Allara E, Yen C, Arizumi T, Kubota K, et al. The ALBI
grade provides objective hepatic reserve estimation across each BCLC stage
of hepatocellular carcinoma. J Hepatol. 2017;66:338–46.
Clavien PA, Barkun J, de Oliveira ML, Vauthey JN, Dindo D, Schulick RD, et al.
The Clavien-Dindo classification of surgical complications: five-year
experience. Ann Surg. 2009;250:187–96.
Rubin DB, Thomas N. Matching using estimated propensity score: relating
theory to practice. Biometrics. 1996;52:249–64.
Stuart EA. Matching methods for causal inference: a review and a look
forward. Stat Sci. 2010;25:1–21.
Margonis GA, Sasaki K, Andreatos N, Nishioka Y, Sugawara T, Amini N, et al.
Prognostic impact of complications after resection of early stage
hepatocellular carcinoma. J Surg Oncol. 2017;115:791–804.
You DD, Kim DG, Seo CH, Choi HJ, Yoo YK, Park YG. Prognostic factors after
curative resection hepatocellular carcinoma and the surgeon's role. Ann
Surg Treat Res. 2017;93:252–9.
Makino Y, Yamanoi A, Kimoto T, El-Assal ON, Kohno H, Nagasue N. The
influence of perioperative blood transfusion on intrahepatic recurrence after
curative resection of hepatocellular carcinoma. Am J Gastroenterol. 2000;95:
1294–300.
Yamamoto J, Kosuge T, Takayama T, Shimada K, Yamasaki S, Ozaki H, et al.
Perioperative blood transfusion promotes recurrence of hepatocellular
carcinoma after hepatectomy. Surgery. 1994;115:303–9.
Shiba H, Ishida Y, Wakiyama S, Iida T, Matsumoto M, Sakamoto T, et al.
Negative impact of blood transfusion on recurrence and prognosis of
hepatocellular carcinoma after hepatic resection. J Gastrointest Surg. 2009;
13:1636–42.
Hwang S, Lee YJ, Kim KH, Kim KH, Ahn CS, Moon DB, et al. The impact of
tumor size on long-term survival outcomes after resection of solitary
Page 12 of 12
26.
27.
28.
29.
30.
31.
32.
33.
34.
35.
36.
37.
38.
hepatocellular carcinoma: single-institution experience with 2558 patients. J
Gastrointest Surg. 2015;19:1281–90.
Goh BK, Teo JY, Chan CY, Lee SY, Jeyaraj P, Cheow PC, et al. Importance of
tumor size as a prognostic factor after partial liver resection for solitary
hepatocellular carcinoma: implications on the current AJCC staging system.
J Surg Oncol. 2016;113:89–93.
Sumie S, Nakashima O, Okuda K, Kuromatsu R, Kawaguchi A, Nakano M,
et al. The significance of classifying microvascular invasion in patients with
hepatocellular carcinoma. Ann Surg Oncol. 2014;21:1002–9.
Yang SL, Liu LP, Yang S, Liu L, Ren JW, Fang X, et al. Preoperative serum αfetoprotein and prognosis after hepatectomy for hepatocellular carcinoma.
Br J Surg. 2016;103:716–24.
Okamura Y, Sugiura T, Ito T, Yamamoto Y, Ashida R, Mori K, et al. Neutrophil
to lymphocyte ratio as an indicator of the malignant behaviour of
hepatocellular carcinoma. Br J Surg. 2016;103:891–8.
Yang T, Zhu J, Zhao L, Mai K, Ye J, Huang S, et al. Lymphocye to monocyte
ratio and neutrophil to lymphocyte ratio are superior inflammation-based
predictors of recurrence in patients with hepatocellular carcinoma after
hepatic resection. J Surg Oncol. 2016;115:718–28.
Shen SL, Fu SJ, Chen B, Kuang M, Li SQ, Hua YP, et al. Preoperative aspartate
aminotransferase to platelet ratio is an independent prognostic factor for
hepatitis B-induced hepatocellular carcinoma after hepatic resection. Ann
Surg Oncol. 2014;21:3802–9.
D’Agostino RB Jr. Propensity score methods for bias reduction in the
comparison of a treatment to a non-randomized control group. Stat Med.
1998;17:2265–81.
Brookhart MA, Schneeweiss S, Rothman KJ, Glynn RJ, Til ST. Variable
selection for propensity score models. Am J Epidemiol. 2006;163:1149–56.
Ali MS, Groenwold RH, Belitser SV, Pestman WR, Hoes AW, Roes KCB, et al.
Reporting of covariate selection and balance assessment in propensity
score analysis is suboptimal: a systematic review. J Clin Epidemiol. 2015;68:
122–31.
Katz SC, Shia J, Liau KH, Gonen M, Ruo L, Jarnagin WR, et al. Operative
blood loss independently predicts recurrence and survival after resection of
hepatocellular carcinoma. Ann Surg. 2009;249:617–23.
Asahara T, Katayama K, Itamoto T, Yano M, Hino H, Okamoto Y, et al.
Perioperative blood transfusion as a prognostic indicator in patients with
hepatocellular carcinoma. World J Surg. 1999;23:676–80.
Goubran H, Sheridan D, Radosevic J, Burnouf T, Seghatchian J. Transfusionrelated immunomodulation and cancer. Transfus Apheresis Sci. 2017.
/>Remy KE, Hall MW MW, Cholette J, Juffermans NP, Kathleen Nicol K, Doctor
A, et al. Mechanisms of red blood cell transfusion-related
immunomodulation. Transfusion. 2018;58:804–15.
Publisher’s Note
Springer Nature remains neutral with regard to jurisdictional claims in
published maps and institutional affiliations.