Reporting with ASP.NET Web Forms.
Bạn đang xem bản rút gọn của tài liệu. Xem và tải ngay bản đầy đủ của tài liệu tại đây (2.43 MB, 80 trang )
Reporting with ASP.NET
Web Forms
I
am confident that you had fun and enjoyed developing reports with Windows Forms in the
previous chapter. I promise to continue the same fun in this chapter. However, the reporting
host client will be different—now, we’ll develop reports for ASP.NET Web Forms.
Web Forms is a unique report delivery vehicle. By exposing your reports on the Web,
you’re reaching a far greater user base, in comparison to Windows Forms. All a user needs is
access to an Internet browser and authorization to access your report. Reporting for the Web
is always challenging for report developers, as the Web understands the language of HTML; for
report developers, rendering complex output in HTML format is constantly a challenge.
Well, the good news is that now developers can breathe a sigh of relief, as client-side RS
comes to the rescue. You just have to design the report; the ReportViewer takes care of every-
thing else! You can see the same rich report output with Web Forms as you have seen with
Windows Forms, and although Web Forms is a different report hosting client, developing
reports remains the same.
This chapter will cover
• “ASP.NET Web Sites 101”, a step-by-step tutorial for using web sites
• A variety of reporting projects
ASP.NET Web Sites 101
ASP.NET is a technology that developers can use to build dynamic web sites. It is a successor
to Microsoft’s Active Server Pages (ASP) technology. ASP.NET is part of .NET development plat-
form, starting from its first release with the .NET framework. Like Windows Forms, ASP.NET
Web Forms are built using the Common Language Runtime (CLR); therefore, they allow devel-
opers to code using their choice of any .NET scripting language. In this book, as usual, we’ll
use C#.
Similar to Windows Forms, ASP.NET helps you develop for the Web by making cool web
controls available with rich design-time support. You’ll be glad to see web controls such as
buttons or text boxes function the same way as you have experienced while developing
Windows Forms clients.
147
CHAPTER 5
8547ch05final.qxd 8/30/07 4:01 PM Page 147
These web controls are rendered into HTML when a web page is delivered to a user’s
b
rowser. You, as a developer, will also enjoy the event-driven GUI model to code against. Apart
from this, you’ll benefit from a lot of other cool stuff, such as view state management and sup-
port for AJAX.
■
Note
AJAX (Asynchronous JavaScript and XML) is a web development technique used for creating inter-
active web applications. Its ability to reduce postback trips to the server makes it popular among many
developers. You can learn more on ASP.NET AJAX here:
/>.
An ASP.NET web site needs Internet Information Services (IIS) as a host. The web site
can be hosted with local IIS or on a remote machine. For our reporting project, you’ll see the
reports in action using the integrated web server of the Visual Studio IDE. This internal web
server will act like IIS for use during the development phase. Covering everything offered by
ASP.NET technology is beyond the reach of this book, so in this chapter, we’ll use only the
facilities that are needed to develop and host RS with web forms. You can learn more details
about ASP.NET here:
/>Creating a Web Site Project
Please open Visual Studio, and use the following steps to create an ASP.NET web site project;
see Figure 5-1 for a graphical representation of these steps:
1. Click File
➤
New
➤
Web Site.
2. In the Templates pane of the New Web Site dialog box, select ASP.NET Web Site.
3. From the Language drop-down menu, select Visual C#.
4. Please give the application a name; I’ve called the web site RSWebSite101. You may
choose a different location for storing the application files according to your prefer-
ence.
5. Click the OK button to finish the process. Visual Studio will create a new ASP.NET web
site
. F
igur
e 5-2 shows the code that’s produced and the files inside Solution Explorer.
CHAPTER 5
■
REPORTING WITH ASP.NET WEB FORMS148
8547ch05final.qxd 8/30/07 4:01 PM Page 148
Figure 5-1. Creating a new ASP.NET web site
Figure 5-2. The newly created ASP.NET web site
As you can see in Figure 5-2, the project contains the App_Code folder and a blank web
page
Default.aspx. The generated code is a complete web site, ready to host with IIS. Does
the generated code looks familiar to you? I’m sure your answer is “yes” if you know HTML.
The HTML language makes use of tags to help the browser understand the pages’ content.
You can learn more about HTML here:
/>CHAPTER 5
■
REPORTING WITH ASP.NET WEB FORMS 149
8547ch05final.qxd 8/30/07 4:01 PM Page 149
Let’s assume we hosted this web site with the local IIS. Now, what do you think this site is
s
upposed to do? This site will appear as a blank page inside the user’s browser with nothing to
display. Therefore, before we build the site, let’s add ReportViewer to it.
Adding ReportViewer to Default.aspx
We know we need the ReportViewer to preview the report. Before adding the ReportViewer,
please make sure the
Default.aspx page is open in the designer in source view mode (similar
to the view in Figure 5-2). Let’s add the ReportViewer now by dragging Data
➤
ReportViewer
from the toolbox and dropping it between the
<div> </div> tags; please see Figure 5-3 for an
illustration of the process.
Figure 5-3. P
r
ocess to add the R
eportViewer to Default.aspx
■
Note
You can also add the ReportViewer to the
Default.aspx
page by switching to design view and
dragging and dropping the ReportViewer control onto the design surface.
As a result of this, a ReportViewer control will be added to the Default.aspx page with the
ID
reportViewer1. After y
ou add the
ReportViewer, your generated HTML code should be sim-
ilar to the following:
CHAPTER 5
■
REPORTING WITH ASP.NET WEB FORMS150
8547ch05final.qxd 8/30/07 4:01 PM Page 150
<%@ Page Language="C#" AutoEventWireup="true"
➥
CodeFile="Default.aspx.cs" Inherits="_Default" %>
<%@ Register Assembly="Microsoft.ReportViewer.WebForms,
➥
Version=8.0.0.0, Culture=neutral,
➥
PublicKeyToken=b03f5f7f11d50a3a"
Namespace="Microsoft.Reporting.WebForms" TagPrefix="rsweb" %>
<!DOCTYPE html PUBLIC "-//W3C//DTD XHTML 1.0 Transitional//EN"
➥
" /><html xmlns=" >
<head runat="server">
<title>Untitled Page</title>
</head>
<body>
<form id="form1" runat="server">
<div>
<rsweb:ReportViewer ID="ReportViewer1" runat="server">
</rsweb:ReportViewer>
</div>
</form>
</body>
</html>
After you add the ReportViewer, extra lines of code are added: the first lines contain the
registration information of the
Microsoft.ReportViewer.WebForms assembly. The second new
tag here, between the
<div> tags, refers to our newly added ReportViewer.
So, are you curious to see how the ReportViewer looks on a
Default.aspx page? Well, you
have seen the ReportViewer in Windows Forms; it will look very similar in a web form. You can
have a peek at it by making sure the
Default.aspx page is open and switching to design mode
from HTML source mode (see Figure 5-4). All right, we’re all set to build the web site now.
■
Note
Y
ou might be wondering why the Print button is missing in the ReportViewer! Well, the version with
Visual Studio 2005 doesn’t have it for web pages. However, the good news is that the ReportViewer that
ships with
Visual Studio 2008 has web pa
ge print functionality
.
To print from the Web in Visual Studio 2005,
you have to save the report as an image, Excel, or PDF file.
CHAPTER 5
■
REPORTING WITH ASP.NET WEB FORMS 151
8547ch05final.qxd 8/30/07 4:01 PM Page 151
Figure 5-4. ReportViewer in design mode on Default.aspx
Building the Project
I’m sure you are ready to pump life into your web site. Sure, why not? After all, this is the time
we can see our hard work in action. Building a web site is like any other project we build with
the Visual Studio IDE. As you know, you can build a project by clicking the small, green play
button in the main toolbox or pressing F5 on the keyboard to start the application in run-
time mode.
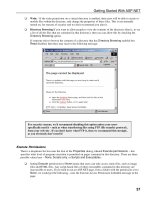
If the Visual Studio IDE presents you with the Debugging Not Enabled dialog box, select
the default choice of “Modify the Web.config file . . .” and click the OK button (see Figure 5-5).
Figure 5-5. Confirmation to enable debugging
If you don’t get any errors during the build, the web site will be automatically hosted with
the internal web server of Visual Studio’s IDE. Please see Figure 5-6 for the URL and port on
CHAPTER 5
■
REPORTING WITH ASP.NET WEB FORMS152
8547ch05final.qxd 8/30/07 4:01 PM Page 152
which our web site is hosted. When my site is hosted with the internal web server, it uses port
3
992 on my computer. However, if you build the site on your machine, you might get a differ-
ent port number.
Figure 5-6. The web site is hosted with the internal web server of the Visual Studio IDE.
After the web service is successfully launched, a browser window will appear with a blank
page, as in Figure 5-7 (which shows the page in Internet Explorer 7). Why still a blank page?
Well, we just added the ReportViewer but have not yet developed a report to output.
Figure 5-7. The web site launched in the browser window
All right, now it is time to move on to our reporting project. As our first reporting project,
let’s create the Aged Accounts Receivables report that I mentioned in Chapter 1.
Aged Accounts Receivables Report
Assume y
ou
’re working for Modern Packaging Incorporated as a developer. You have the task
of dev
eloping the Aged A
ccounts Receivables r
epor
t. The report should highlight, using bold
and italic font styles, any invoice that is 90 days old or older. The report should also provide
the user with the ability to mo
ve to invoice details of any customers while viewing the report.
The r
epor
t should meet all the char
acter
istics descr
ibed in the Table 5-1, and the report out-
put should match Figure 5-8.
CHAPTER 5
■
REPORTING WITH ASP.NET WEB FORMS 153
8547ch05final.qxd 8/30/07 4:01 PM Page 153
Table 5-1. Report Characteristics
Characteristics Value
R
eport title
A
ged Accounts Receivables
Company title Modern Packaging Inc.
Print date Yes
Data source
AgedAR
C
olumns to report
I
nvioceNo
, C
ustomerName
, A
mount
,
and
I
nvoiceAge
Page size Letter
Page orientation Portrait
Page number Yes (Page: n/n)
Layout design Header and Body section
Document map Yes (on Customer Name)
Figure 5-8. The Aged Accounts Receivables report
Business Case
We use a sales invoice once a product is sold or service is rendered to a customer. In a credit
sale
, it is a customer’s duty to pay the invoiced amount before the due date. Different busi-
nesses have v
ar
ious policies of cr
edit days that customers can enjo
y before settling the invoice
amount. The Aged Accounts Receivables report helps the collections department staff to look
for the age of all outstanding sales inv
oices. In our example, highlighting the invoices that are
o
v
er
due b
y 90 days or mor
e helps the collections department take action.
CHAPTER 5
■
REPORTING WITH ASP.NET WEB FORMS154
8547ch05final.qxd 8/30/07 4:01 PM Page 154
Getting the Web Site Ready
Let’s get the web site ready, similar to the way you have already learned earlier in this chapter.
You can make use of the solution RSWebSite101 as a template for this project or create it from
s
cratch. It is good idea to create the new project from scratch; you can always refer to steps
mentioned in the tutorial if you get stuck.
Please use the following steps to create a web site project:
1. Click File
➤
New
➤
Web Site.
2. In the Templates pane of the New Web Site dialog box, select ASP.NET Web Site.
3. From the Language drop-down menu, select Visual C#.
4. Please give the application a name; I’ve called the web site AgedAR. You may choose
a different location for storing the application files according to your preference.
5. Click the OK button to finish the process. Visual Studio will create a new ASP.NET
web site.
Let’s move on and add the dataset and ReportViewer to the project. Let’s start by selecting
the project in Solution Explorer. Right-click it, and select Add
➤
New Item
➤
DataSet. Please
name the dataset
dsAgedAR. You’ll notice that Visual Studio will ask you to put the dataset
inside the
App_Code folder; go ahead click the Yes button. Select Cancel on the Table Adapter
wizard dialog box; we’ll create the data table later.
Its time to add the ReportViewer now; please repeat the steps from our “ASP.NET Web
Sites101” tutorial earlier in this chapter to add the ReportViewer to the
Default.aspx page (see
Figure 5-3). Before continuing, please make sure the HTML code inside the
Default.aspx page
looks like the following:
<%@ Page Language="C#" AutoEventWireup="true"
➥
CodeFile="Default.aspx.cs" Inherits="_Default" %>
<%@ Register Assembly="Microsoft.ReportViewer.WebForms,
➥
Version=8.0.0.0, Culture=neutral, PublicKeyToken=b03f5f7f11d50a3a"
Namespace="Microsoft.Reporting.WebForms" TagPrefix="rsweb" %>
<!DOCTYPE html PUBLIC "-//W3C//DTD XHTML 1.0 Transitional//EN"
➥
" /><html xmlns=" >
<head runat="server">
<title>Untitled Page</title>
</head>
<body>
<form id="form1" runat="server">
<div>
<rsweb:ReportViewer ID="ReportViewer1" runat="server"
➥
Width="775px">
CHAPTER 5
■
REPORTING WITH ASP.NET WEB FORMS 155
8547ch05final.qxd 8/30/07 4:01 PM Page 155
</rsweb:ReportViewer>
</div>
</form>
</body>
</html>
If you switch to the design view of the Default.aspx page, it should look similar to
Figure 5-4, with the exception of the width of ReportViewer. In this example, we have set the
width to 775 pixels.
Step 1: Creating a Data Table
Since we already have the dataset in the project, it’s time to add a data table to it. Please use
the following steps to add a data table inside the dataset:
1. You can go to the dataset designer in two ways: double-click dsAgedAR inside Solution
Explorer, or right-click the
dsAgedAR node and select View Designer.
2. Let’s add the data table by right-clicking the design surface and selecting Add
➤
DataTable.
3. Click the header of the newly created data table, and name it dtAgedAR. Let’s start
adding columns to
dtAgedAR by right-clicking the data table and selecting Add
➤
Column.
4. Please add the following columns into the data table, which should then look similar
to Figure 5-9:
•
InvoiceNo (System.String)
•
CustomerName (System.String)
•
Amount (System.Double)
•
InvoiceAge (System.Int32)
Figure 5-9. Final look of the dtAgedAR data table
Step 2: Designing the Report Layout
Before we start with the layout design for the report, let’s take a look at the report layout in
Figure 5-8. What type of report items do you find in this report? Well, as you can see, the report
has a table item to display the inv
oice and receivables information. You’ll also see that we
need the data grouping on
CustomerName. We also need a group summary on total receivables
for each customer.
CHAPTER 5
■
REPORTING WITH ASP.NET WEB FORMS156
8547ch05final.qxd 8/30/07 4:01 PM Page 156
All right, we have our dataset in place, with the data table and all necessary columns.
W
e’re all set to start working on designing the report layout. Add the report by selecting the
project in Solution Explorer and right-clicking it; select Add
➤
New Item, and select Report
from the Add New Item dialog box. Please name the report
rptAgedAR.rdlc. Click the Add
button to complete the process and make the new report part of the project. You’ll also notice
that a new toolbox called Data Sources is available with our dataset information inside.
Adding a Header
Let’s add the header to the report. As usual, adding a header is simple: right-click the open
area inside the report designer and select Page Header. Your report design surface should look
similar to Figure 5-10.
Figure 5-10. The report design surface with header and body sections
Setting Up the Page
According to the report’s needs, let’s set up the page. We need to make sure the report is letter
sized and has a portrait page orientation. Right-click the open area inside the design surface,
and select Properties, where you may wish to put your name in the Author field and add any
information about the report in the Description field. I’d advise you to let all other choices stay
at the defaults.
■
Note
Please make sure to set the properties Page Width to 8.5 inches and Page Height to 11 inches for
a
letter
-sized,
portrait report.
CHAPTER 5
■
REPORTING WITH ASP.NET WEB FORMS 157
8547ch05final.qxd 8/30/07 4:01 PM Page 157
Designing the Page Header
Now, we have added the header and the body sections to our report. As we always do in this
b
ook, let’s work on the header first. Please drag and drop the following report items inside the
header section:
• A text box item for the report title
• A text box item for the report date
• A text box item for the company title
• A text box item for the page number
Report item properties are changed in one of the following two ways: by selecting the
report item, right-clicking it, and selecting Properties or by accessing the general properties
toolbox. Let’s change the properties; select each of the text box items in turn, and specify the
values for each report item’s properties according to Table 5-2.
Table 5-2. Report Item Properties for Header
Report Item Property Value
textbox1
Value Aged Accounts Receivables
Color Purple
textbox2
Value Modern Packaging Inc.
Color Blue
TextAlign Right
textbox3
Value ="Print Date: " & Today
textbox4
Value ="Page: " & Globals!PageNumber & "/" & Globals!TotalPages
TextAlign Right
Designing the Body Section
Let’s start working on this section by selecting dragging Report Items
➤
Table from the toolbox
and dropping it inside the body section in the report designer. A new table item is part of the
report now, and it has the default name of
table1. Since we have three columns to use with the
table, we’ll stick with the default three added automatically (we don’t need to add any more
columns to the table).
■
Note
If you face any difficulties working with the table report item, please refer to the first reporting
project from Cha
pter 4.
CHAPTER 5
■
REPORTING WITH ASP.NET WEB FORMS158
8547ch05final.qxd 8/30/07 4:01 PM Page 158
I’m sure you have a favorite method to map the data table’s columns to the text boxes by
n
ow. Is it drag and drop? Or the old-school way of typing the name of the column expression
inside the text box? Either way, you can map the text box items inside
table1 the way you
like best.
Select Data Source
➤
dsAgedAR
➤
InvoiceNo and drag and drop it inside the first column
of the table item’s detail section. Repeat this task for
InvoiceAge and Amount. For CustomerName,
hold off for now; we need to use it in the group header later. Make sure your report design sur-
face looks similar to the one shown in Figure 5-11.
You’ll notice in the figure that I’ve selected the first row of
table1. As you know, three rows
are added by default when you add a table item to a report. Rows are referred to as
TableRow1
to TableRow3 in sequence. We can add as many table rows as we need in addition to the default
three initial rows.
■
Note
Selecting an entire table row is useful to apply formatting to all the text boxes that the row con-
tains. For example, you can change the font of all text boxes in the selected row or apply top and bottom
border styles.
Figure 5-11. The report designer after adding the header and body
Even after adding the table item and mapping the text boxes, we haven’t quite finished
yet. We still need to work on the
CustomerName data group. If you recall, one of the require-
ments of this report is to provide users a way to quickly jump to information pertaining to
any customer. For this, we have to create a document map on
CustomerName. As you can see
in Figure 5-8, this document map will help the user to jump directly to records related to
any given customer.
So, now is the time to add the data group and document map. Let’s begin by adding a
group. Select the Detail row (
TableRow2), right-click it, and select Insert Group; the Grouping
and Sorting Properties dialog box will appear. Please make sure to select the General tab, and
type the follo
wing into the E
xpression field:
=LEFT(F
ields!C
ustomerName.Value,1)
. O
n the
CHAPTER 5
■
REPORTING WITH ASP.NET WEB FORMS 159
8547ch05final.qxd 8/30/07 4:01 PM Page 159
same tab, select or type the same expression for “Document map label”—yes, the same
e
xpression for both the group and document map. Please see Figure 5-12 for an illustration
of these steps.
Let me shed some light on the document map. What do you think a document map is?
If I put it simply, it is a feature built into RS to help users navigate the report output. It has
a familiar tree view UI; the information related to the document map appears on the left
side of the report.
You can treat the tree as a table of contents, and when you click on any of the items, the
report gets refreshed with the needed information. For example, in this case, all customers will
appear as the table of contents, and if you select any customer from the tree view, the result on
the right side will be refreshed with invoice information for that customer.
■
Note
A document map is only supported with Internet Explorer. For example, if you open this report with
Firefox, you will not see the document map. Please check the following link for browser compatibility with
the ReportViewer:
/>.
Figure 5-12. S
teps to add the CustomerName as a data group and document map
After you add the data grouping and document map, you’ll notice that two new rows have
become part of
table1 now. No matter if you add or remove row(s) from the table item, the
r
ow number is always assigned from top to bottom: if your table has five rows, the first row ref-
er
ence will be
TableRow1 and the last r
o
w r
eference will be
TableRow5. P
lease make sur
e y
our
r
epor
t design looks similar to F
igur
e 5-13 after
adding the data gr
oup and document map
.
CHAPTER 5
■
REPORTING WITH ASP.NET WEB FORMS160
8547ch05final.qxd 8/30/07 4:01 PM Page 160
Figure 5-13. Report design after adding data group and document map
Let’s take care of the data group header and footer now. For the header, we need to show
the customer name. For the group footer, we need to show the total receivables of each cus-
tomer. Before we add the customer name to the group header, let’s merge all the text boxes
(cells) in the group header row (
TableRow2). As you know, the table item is like a worksheet
with rows and columns; we can select two or more columns from the same row and merge
them to look like a single cell.
We’ll do this to
TableRow2; please select all three columns (referred to as cells), right-
click, and select Merge. After this, you can map the
CustomerName from dtAgedAR or type the
expression
Fields!CustomerName.Value. For the data group footer (TableRow4), select col-
umn 2, and type
Customer Total:. For column 3, we will use the SUM() function to calculate
the total receivables for the customer. Please make sure to use the following expression for
the calculation:
= SUM(Fields!Amount.Value). Please see Figure 5-14 for an illustration of the
steps.
Figure 5-14. Steps to merge cells and add the data group header
CHAPTER 5
■
REPORTING WITH ASP.NET WEB FORMS 161
8547ch05final.qxd 8/30/07 4:01 PM Page 161
We have one important step left; that is to highlight any invoice that is 90 or more days
o
ld. This is very simple to do. All we need to do is apply the FontStyle and FontWeight proper-
ties of the details row (
TableRow3) inside table1. Please use the following FontStyle expression:
=IIF(Fields!InvoiceAge.Value >= 90,"Italic","Normal")
Similarly, use the following expression for FontWeight:
=IIF(Fields!InvoiceAge.Value >= 90,"Bold","Normal").
One last step before we say the design for the body section is complete—let’s make the
report look pretty. The properties are applicable to any selected row or column. Please make
sure the report design properties for
table1 are set according to Table 5-3.
Table 5-3. Table Item Properties for the Body Section
Table Item Property Value
TableRow1 ➤ Column1 Value Invoice No
TableRow1
➤ Column2 Value Amount
TableRow1
➤ Column2 TextAlign Right
TableRow1
➤ Column3 Value Invoice Age
TableRow1
➤ Column3 TextAlign Right
TableRow1
BorderStyle None, , , Solid, Solid
TableRow2
➤ Column1 Value =Fields!CustomerName.Value
TableRow2
BorderStyle None, , , , Dotted
TableRow3
➤ Column1 Value =Fields!InvoiceNo.Value
TableRow3
➤ Column2 Value =Fields!Amount.Value
TableRow3
➤ Column2 Format N
TableRow3
➤ Column3 Value =Fields!InvoiceAge.Value
TableRow3
➤ Column3 Format N0 (=zero for no decimal)
TableRow3 F
ontStyle
=IIF(Fields!InvoiceAge.Value >= 90,"Italic",
"Normal")
TableRow3
FontWeight =IIF(Fields!InvoiceAge.Value >= 90,"Bold",
"Normal")
TableRow4
➤ Column2 Value Customer Total:
TableRow4
➤ Column2 Value =SUM(Fields!Amount.Value)
TableRow4 B
or
derStyle
None, , , Solid, Solid
That’
s it.
O
ur r
eport design is ready to test with some C# code now. Before we move to the
code section, make sure your final report design looks similar to the one shown in Figure 5-15.
CHAPTER 5
■
REPORTING WITH ASP.NET WEB FORMS162
8547ch05final.qxd 8/30/07 4:01 PM Page 162
Figure 5-15. The final look of the report design
Step 3:
Writing C# Code
Please make sure you have the following code inside the Default.aspx.cs file:
using System;
using System.Data;
using System.Configuration;
using System.Web;
using System.Web.Security;
using System.Web.UI;
using System.Web.UI.WebControls;
using System.Web.UI.WebControls.WebParts;
using System.Web.UI.HtmlControls;
using Microsoft.Reporting.WebForms;
using System.Data.SqlClient;
public partial class _Default : System.Web.UI.Page
{
protected void Page_Load(object sender, EventArgs e)
{
//Declare connection string
string cnString = "Data Source=(local);
➥
Initial Catalog=RealWorld;Integrated Security=SSPI;";
//Declare Connection, command, and other related objects
SqlConnection conReport = new SqlConnection(cnString);
SqlCommand cmdReport = new SqlCommand();
SqlDataReader drReport;
DataSet dsReport = new dsAgedAR();
CHAPTER 5
■
REPORTING WITH ASP.NET WEB FORMS 163
8547ch05final.qxd 8/30/07 4:01 PM Page 163
try
{
conReport.Open();
cmdReport.CommandType = CommandType.Text;
cmdReport.Connection = conReport;
cmdReport.CommandText = "Select * FROM dbo.AgedAR
➥
order by CustomerName, InvoiceNo";
drReport = cmdReport.ExecuteReader();
dsReport.Tables[0].Load(drReport);
drReport.Close();
conReport.Close();
//provide local report information to viewer
ReportViewer1.LocalReport.ReportPath = "rptAgedAR.rdlc";
//prepare report data source
ReportDataSource rds = new ReportDataSource();
rds.Name = "dsAgedAR_dtAgedAR";
rds.Value = dsReport.Tables[0];
ReportViewer1.LocalReport.DataSources.Add(rds);
}
catch (Exception ex)
{
//display generic error message back to user
Response.Write(ex.Message);
}
finally
{
//check if connection is still open then attempt to close
if (conReport.State == ConnectionState.Open)
{
conReport.Close();
}
}
}
}
The code here is a common ADO.NET interface similar to what you saw in Chapter 4. We
start with connecting to our
RealWorld database and gathering data from the table AgedAR.
After that, we bind the data to the reporting engine. You may want to revisit Chapter 3 for a
refresher on the C# ADO.NET interface code.
CHAPTER 5
■
REPORTING WITH ASP.NET WEB FORMS164
8547ch05final.qxd 8/30/07 4:01 PM Page 164
Building the Project
As usual, let’s build the project. You can click the small, green play button in the main tool-
box or press F5 on the keyboard to start the application in run-time mode. As you learned
e
arlier, click OK when you build it for the first time to enable the debug mode setting.
Assuming that you don’t encounter any issue during the build, your report output should
look similar to Figure 5-8.
As I mentioned in a note earlier, the document map is supported only by the Internet
Explorer browser. Figure 5-16 shows you how our report looks with the Firefox browser (note
the missing document map).
Figure 5-16. The report output in the Firefox browser
Let me ask you a question here. If we export this report to either Excel or PDF format,
is the document map supported? Well, the answer is “yes;” both Excel and PDF files can show
the document map.
In the case of Excel, the generated .xls file will have two sheets: one holds the document
map, and the other is the actual report. If you click any of the items in the document map, you
will be taken to the sheet that has the data for the selected customer. Please see Figure 5-17 for
the document map and Figure 5-18 for the report data after it is exported to Excel format.
CHAPTER 5
■
REPORTING WITH ASP.NET WEB FORMS 165
8547ch05final.qxd 8/30/07 4:01 PM Page 165
Figure 5-17. Excel file view of the document map
Figure 5-18. Excel report data after selecting a customer from the document map
I
n the case of expor
ting to PDF, the generated file will have the document map and
report data in the same page. The document map is treated as a bookmark inside the PDF
file. As you click customers, the report data is refreshed to reflect your customer selection.
P
lease see Figure 5-19 for a view of the report inside Acrobat Reader.
CHAPTER 5
■
REPORTING WITH ASP.NET WEB FORMS166
8547ch05final.qxd 8/30/07 4:01 PM Page 166
■
Note
I’m using Acrobat Reader version 8.1.0. If you are using another version, your view will be a little bit
different than what appears in Figure 5-19.
Figure 5-19. PDF file view of the document map and report data
I’m confident that you enjoyed this report and had fun with the document map feature.
All right, let’s move on to our next reporting project, where you will learn to make use of cus-
tom code and more conditional formatting.
Sales Profit Analysis Report
Assume you’re working for A1 Financial Services Incorporated as a developer. You have the
task of dev
eloping the S
ales Profit Analysis report. The report should show sales information
for individual inv
oices and determine the pr
ofit/loss ratio after taking cost into consider
ation.
The details of the invoices should appear in ledger format, and alternating rows should be
color
ed light yellow. The report should make use of icons (Sad, Happy, and Come See Me) to
r
eflect the position of each invoice
. I
f the inv
oiced transaction made less than 10 percent
profit, it should display the S
ad icon; if it made a pr
ofit of 10 per
cent or better
, it should dis-
play the H
appy icon, and a loss should display Come See Me. Further, reports should meet all
the character
istics descr
ibed in
T
able 5-4, and the report output should match Figure 5-20.
CHAPTER 5
■
REPORTING WITH ASP.NET WEB FORMS 167
8547ch05final.qxd 8/30/07 4:01 PM Page 167
Table 5-4. Report Characteristics
Characteristics Value
R
eport title
S
ales Profit Analysis
Company title A1 Financial Services Inc.
Print date Yes
Data source
SalesAnalysis
C
olumns to report
I
nvoiceNo
, C
ustomerName
, A
mount
,
and
C
ost
Page size Letter
Page orientation Portrait
Page number Yes (Page: n/n)
Layout design Header and body sections
Figure 5-20. Sales Profit Analysis report
Business Case
H
o
w does a business
determine if a profit was made on any given sale? The formula in simple:
take the invoice value and subtr
act the cost, and y
ou will end up with pr
ofit or loss. G
enerat-
ing more and more invoices is good for the business. However, each of those invoices should
meet the pr
ofit expectations (or at least should not incur a loss).
A sales pr
ofit analysis r
epor
t helps the sales depar
tment monitor the pr
ofit r
atio
. In this
example, we will list all invoices with their individual profit or loss figures. You’ll also see that
CHAPTER 5
■
REPORTING WITH ASP.NET WEB FORMS168
8547ch05final.qxd 8/30/07 4:01 PM Page 168
an icon next to each invoice’s details that will tell you how the profit looks. A happy face
m
eans all is good; a sad face means attention is required, and finally, the Come See Me icon
is a message from the sales boss to start the fact finding process to figure out how come the
transaction was a loss!
Getting the Web Site Ready
Please use the following steps to create a web site project:
1. Click File
➤
New
➤
Web Site.
2. In the Templates pane of the New Web Site dialog box, select ASP.NET Web Site.
3. From the Language drop-down menu, select Visual C#.
4. Please give the application a name; I’ve called the web site SalesAnalysis. You may
choose a different location for storing the application files according to your prefer-
ence.
5. Click the OK button to finish the process. Visual Studio will create a new ASP.NET
Web site.
As usual, it is time to add the dataset and ReportViewer to the project. Start by selecting
the project in Solution Explorer; right-click it, and select Add
➤
New Item
➤
dataset. Please
name the dataset as
dsSalesAnalysis. You’ll notice that Visual Studio will ask you to put the
dataset inside the
App_Code folder; go ahead and click the Yes button. Select Cancel on the
Table Adapter wizard dialog box; we’ll create the data table later.
Let’s take care of the ReportViewer now. Please repeat the steps from the Aged Accounts
Receivables example to add the ReportViewer; refer to Figure 5-3 if you need help adding the
ReportViewer. Before we move on, please make sure the HTML code inside the
Default.aspx
page looks like the following:
<%@ Page Language="C#" AutoEventWireup="true"
➥
CodeFile="Default.aspx.cs" Inherits="_Default" %>
<%@ Register Assembly="Microsoft.ReportViewer.WebForms, !CCC
Version=8.0.0.0, Culture=neutral,
➥
PublicKeyToken=b03f5f7f11d50a3a"
Namespace="Microsoft.Reporting.WebForms" TagPrefix="rsweb" %>
<!DOCTYPE html PUBLIC "-//W3C//DTD XHTML 1.0 Transitional//EN"
➥
" /><html xmlns=" >
<head runat="server">
<title>Untitled Page</title>
</head>
CHAPTER 5
■
REPORTING WITH ASP.NET WEB FORMS 169
8547ch05final.qxd 8/30/07 4:01 PM Page 169
<body>
<form id="form1" runat="server">
<div>
<rsweb:ReportViewer ID="ReportViewer1" runat="server" Width="775px">
</rsweb:ReportViewer>
</div>
</form>
</body>
</html>
Step 1: Creating a Data Table
Our usual, step number one is to add a data table to the dataset. Please use the following
steps:
1. You can go to the dataset designer in two ways: double-click dsSalesAnalysis inside
Solution Explorer, or right-click the
dsSalesAnalysis node and select View Designer.
2. Let’s add the data table by right-clicking the design surface and selecting Add
➤
DataTable.
3. Click the header of the newly created data table, and name it dtSalesAnalysis. Let’s
start adding columns to
dtSalesAnalysis by right-clicking the data table and selecting
Add
➤
Column.
4. Please add the following columns into the data table, which should then look similar to
Figure 5-21:
•
InvoiceNo (System.String)
•
CustomerName (System.String)
•
Amount (System.Double)
•
Cost (System.Double)
Figure 5-21. F
inal look of the dtSalesAnalysis data table
Step 2: Designing the Report Layout
B
efor
e we start with the layout design for the report, let’s take a look at the report layout in
Figure 5-20. What type of report items do you find in this report? Well, as you can see, the
report has table items to display the sales profit analysis of individual invoices, and the little
images ar
e a unique way to state the profit status. Another point that is unique to this report is
the ledger-style presentation; that means the background color alternates between white and
light yellow for each invoice row.
CHAPTER 5
■
REPORTING WITH ASP.NET WEB FORMS170
8547ch05final.qxd 8/30/07 4:01 PM Page 170
In the last step, we took care of our dataset. We’re all set to start working on designing
t
he report layout now. Add the report by selecting the project in Solution Explorer and right-
clicking it; select Add
➤
New Item, and select Report from the Add New Item dialog box.
Please name the report
rptSalesAnalysis.rdlc. Click the Add button to complete the pro-
cess and make the new report part of the project.
Adding a Header
Let’s add the header to the report. As usual, adding a header is simple: right-click the open
area inside the report designer and select Page Header.
Setting Up the Page
We need to make sure the report is letter sized and has a portrait page orientation. Right-click
the open area inside the design surface; select Properties, and set the page width to 8.5 inches
and the page height to 11 inches.
Designing the Page Header
Let’s begin to work on the page header now; please drag and drop the following report items
inside the header section:
• A text box item for the report title
• A text box item for the report date
• A text box item for the company title
• A text box item for the page number
The report item properties are changed in one of the following two ways: by selecting the
report item, right-clicking it, and selecting Properties; or by accessing the general properties
toolbox. Let’s change the properties; select each of the text box items in turn, and specify the
values for each report item’s properties according to Table 5-5.
Table 5-5. Report Item Properties for the Header
Report Item Property Value
textbox1
V
alue
Sales Profit Analysis
C
olor
Purple
textbox2
V
alue
A1 Financial Services Inc.
C
olor
Blue
T
extAlign
Right
textbox3
V
alue
="Print Date: " & Today
textbox4
V
alue
="Page: " & Globals!PageNumber & "/" & Globals!TotalPages
T
extAlign
Right
CHAPTER 5
■
REPORTING WITH ASP.NET WEB FORMS 171
8547ch05final.qxd 8/30/07 4:01 PM Page 171