Moving from Crystal Reports to Reporting Services
Bạn đang xem bản rút gọn của tài liệu. Xem và tải ngay bản đầy đủ của tài liệu tại đây (894.13 KB, 16 trang )
Moving from Crystal Reports
to Reporting Services
I
’m sure that you enjoyed the versatility of the client-side RS with various reporting projects
we’ve done so far. Now, my question to you is, “What was report development like before the
client-side RS in VS 2005?” Well, I’m sure the majority of developers would say that they
worked with Crystal Reports (CR). I’m also included in this majority; I’ve used CR extensively
with various commercial projects so far.
Although CR and RS are two different technologies, they produce the same result—a
report. My rationale behind including this chapter in this book is to help you move toward the
RS platform from CR. If you haven’t used CR in the past, this chapter will help you to get to
know some facts about CR, and you’ll also see how report output similar to RS’s can be pro-
duced using another technology.
This chapter will cover
• A side-by-side comparison of RS and CR
• Developing reports using both RS and CR
Which tool is preferable for developing reports, RS or CR? Tough one, right? Both the tools
come as out-of-the-box solutions with VS 2005 for reporting on a variety of data sources. As
with any competitive tools, each contains features that aren’t in the other. I’d like to remind
you, though, that our discussion is based on the client-side capabilities of both technologies.
In my personal opinion, two choices are always better than one. However, I find it much easier
to work with RS. One of the highlights that most motivates me to use RS is the free hand given
to
developers on the report’s design surface. I can have a chart and a table at the same time
inside the body section; imagine that! RS has brought a whole new functionality for develop-
ers, who can design reports just like they design Windows or Web Forms—just pick the report
item, and place it wher
e you want; it’s that simple.
Before we continue our discussion further, if you are new to CR, you should know that CR
is a reporting tool produced by Business Objects that has been an integral part of the Visual
S
tudio series, including the 2005 release. CR can gather data and design reports from a wide
range of data sources, such as SQL Server, Oracle, and spreadsheets like Microsoft Excel. You
can get more information on CR here:
/>369
CHAPTER 12
8547ch12final.qxd 8/30/07 3:39 PM Page 369
You might wonder why Microsoft is still shipping CR with Visual Studio. Well, since much
d
evelopment exists for CR, Microsoft would like to support it. At the same time, by introduc-
ing RS on the client side, Microsoft is empowering developers to be more productive using
this new reporting tool. By including both tools, Microsoft gives developers the ability to
choose for themselves which platform suits them best. As for long-term commitment, I’ve
seen both CR and RS as report development tools shipped with the Visual Studio 2008 release.
And why a side-by-side reporting project? I think this way you can feel how easy it is to
develop the report using RS. Instead of just telling you that creating reports using RS is easy,
let me show you with the help of this exercise.
Comparing RS and CR Side by Side
The reporting project in this chapter differs from the reporting projects you’ve done so far.
Why? Because, you’ll see the same report output from two different tools side by side. So, if
you’re familiar with CR development, you can see how to leverage your existing skills and
learn the RS equivalent. If you’ve not yet developed any CR reports, this is your chance to
see the CR in action.
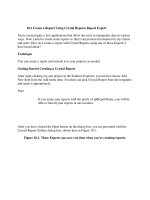
Let’s develop a simple, tabular Books Year to Date Sales report for a publisher. This report
will have a standard header and footer. Year-to-date sales information will be part of the body
section. As Figure 12-1 shows, we’ll see two different report previews. Although the report
content will look the same, you’ll see how reporting is made easy in VS 2005 with these two
out-of-the-box solutions.
Figure 12-1. S
ide-b
y-side report preview
CHAPTER 12
■
MOVING FROM CRYSTAL REPORTS TO REPORTING SERVICES370
8547ch12final.qxd 8/30/07 3:39 PM Page 370
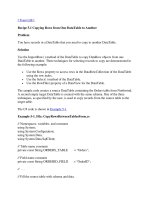
Creating the Windows Forms Project
Please open Visual Studio, and use the following steps to create a Windows application project;
see Figure 12-2 for an illustration of these steps:
1. Click File
➤
New
➤
Project, or press Ctrl+Shift+N on the keyboard.
2. In the “Project types” pane of the New Project dialog box, select Visual C#
➤
Windows.
3. In the Templates pane, select Windows Application.
4. Let’s give a name to the application; I’ve called the project RSandCR. You may choose
a different location for storing the application files according to your preference.
5. Click the OK button to finish the process; VS will create a new Windows application
project. You’ll also notice that a new form with the name
Form1 is part of the project.
Figure 12-2. Create a new Windows application.
Let
’
s mo
v
e on and
add the dataset and the R
eportViewer to the project. So, as we have two
different reports here, do we need the two datasets? Well, no, we can use the same dataset for
both the r
eporting engines. Let’s start by selecting the project under Solution Explorer; right-
click it, and select A
dd
➤
N
ew I
tem
➤
D
ataS
et. Let
’
s name the dataset
dsRSandCR.
CHAPTER 12
■
MOVING FROM CRYSTAL REPORTS TO REPORTING SERVICES 371
8547ch12final.qxd 8/30/07 3:39 PM Page 371
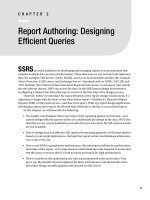
As you know, we use the ReportViewer to display the report output for RS. Similarly, we
n
eed to add the CrystalReportViewer to display the report output of CR. Add the ReportViewer
to the project by dragging Data
➤
ReportViewer from the toolbox and dropping it onto the
design surface. Similarly, add the Crystal ReportViewer by dragging Crystal Reports
➤
Crystal-
ReportViewer from the toolbox and dropping it onto the design surface. Please see Figure 12-3
for the illustration of these steps.
Figure 12-3. Project after adding the dataset and ReportViewers
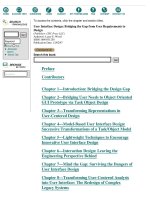
Please make sure you set the properties in Table 12-1. After you specify all the properties,
your
Form1 should look similar to the Figure 12-4.
T
able 12-1.
P
r
operty Settings for the Project
Object Property Value
Form1 Text RS and CR side-by-side example
Form1
Size 790, 500
reportViewer1
Size 750, 200
crystalReportViewer1 S
ize
750, 240
F
igur
e 12-4 sho
ws the r
eferences used by the RS and CR ReportViewers. These references
are automatically added to the project when ReportViewers are placed in
Form1.
CHAPTER 12
■
MOVING FROM CRYSTAL REPORTS TO REPORTING SERVICES372
8547ch12final.qxd 8/30/07 3:39 PM Page 372
Figure 12-4. Form1 with RS and CR ReportViewers
Step 1: Creating a Data Table
Since we already have the dataset in the project, it’s time to add a data table to it. Please use
the following steps to add a data table inside the dataset:
1. You can go to the dataset designer in two ways: double-click dsAccess inside Solution
Explorer, or right-click the
dsRSandCR node and select View Designer.
2. Right-click the design surface, and select Add
➤
DataTable.
3. Click the header of the newly created data table, and name it dtRSandCR. Let’s start
adding columns to
dtRSandCR b
y r
ight-clicking D
ataT
able and selecting Add
➤
C
olumn.
4. A
dd the follo
wing columns into the data table; your data table should look like the one
shown in Figure 12-5:
•
BookTitle (System.String)
•
AuthorLastName (System.String)
•
Price (System.String)
•
YTDSales (System.Double)
CHAPTER 12
■
MOVING FROM CRYSTAL REPORTS TO REPORTING SERVICES 373
8547ch12final.qxd 8/30/07 3:39 PM Page 373
Figure 12-5. Final look of the dtRSandCRs data table
Step 2: Designing the Report Layout
Before we start designing the report, let’s take a moment to analyze the report layout in
Figure 12-1. Although the output of both reports looks the same, we need to use different
approaches to report design. You’ll use the table report item for the RS part of this exercise.
How about CR? Do we have the table report item in the CR design tool set also? I know
many questions like these might be going through your mind, but hold on to them for now.
As we go through each step of the report development, you’ll see the different approaches to
producing the same report unfold.
All right, we’ve got our dataset in place with a data table and all the necessary columns.
We’re all set to start working on designing the report layout. As you know, we need two reports:
one each for RS and CR. The process to add reports in CR is similar to one we use for RS; the
only difference is to select the proper report type.
Let’s start adding the RS report by selecting the project under Solution Explorer. Right-
click it, and select Add
➤
New Item. Next, select Report from the Add New Item dialog box
(shown in Figure 12-6). Please name the report
rptRS.rdlc. Click the Add button to complete
the process.
Let’s add the CR report now. Again, select the project under Solution Explorer, right-click
it, select Add
➤
New Item, and then select Crystal Report from the Add New Item dialog box.
Please name the report
rptCR.rdlc. Click the Add button to complete the process.
Figure 12-6. A
dding the ne
w RS and CR r
epor
ts
CHAPTER 12
■
MOVING FROM CRYSTAL REPORTS TO REPORTING SERVICES374
8547ch12final.qxd 8/30/07 3:39 PM Page 374